Русский
 Қазақша
 Eesti
November 9 – November 15, 2026: Weekly economic update
Key market updates

Key Takeaways:
- The policy rate was raised to a range of 3.75 - 4.00%; rhetoric is hawkish;
- Monetary policy remains moderately restrictive;
- U.S. macroeconomic data continue to support a soft-landing scenario: inflation risks are increasing, the labor market is cooling without signs of recession, and current conditions do not yet warrant a rate cut.
- The Fed slightly improved its GDP and employment forecasts and raised its near-term inflation forecasts.
The main developments of last week: a sharp rise in debt market yields, a hawkish shift in Fed rhetoric, and higher expectations for federal funds rate hikes.
Most voting members of the Fed's Board spoke during the week. Bottom line: Fed rhetoric has shifted noticeably in a hawkish direction. Waller, Logan, Collins and Bowman directly or indirectly support further tightening; Barkin is more cautious but also sees inflation as the main risk. At the same time, a new factor is increasingly mentioned — the AI investment boom as a source of additional demand and inflationary pressure.
At the same time, the CPI and PPI data show no sign of an inflationary impulse. All volatile measures (including energy and food) came in below the previous releases, while core measures were unchanged.
This contrast in rhetoric compared with the recent FOMC meeting, and against the backdrop of the current inflation release, allows us to stick to our base case: the regulator's verbal interventions are continuing.
Inflation: Consumer Price Index (October)
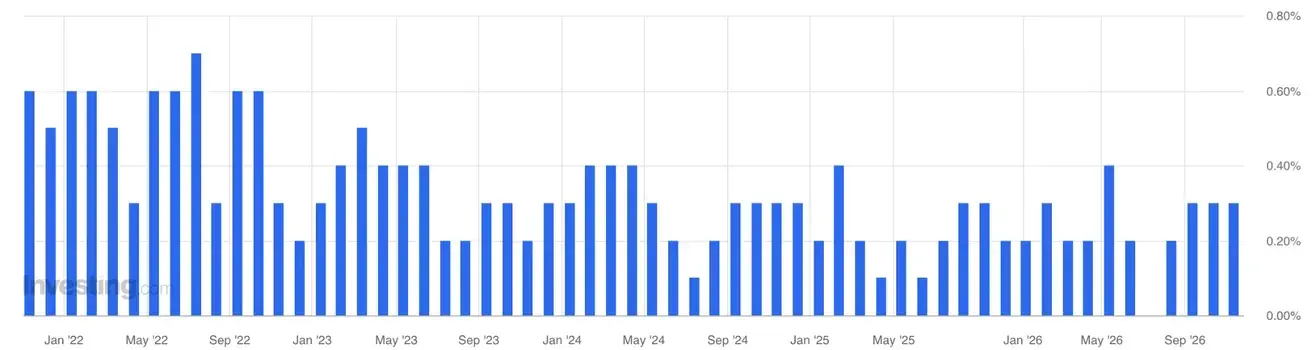
- Core CPI (MoM): 0.3% (previous: 0.3%); (YoY) — (previous: 2.4%):
- CPI (MoM): 0.4% (previous: 0.6%); — (previous: 3.4%):
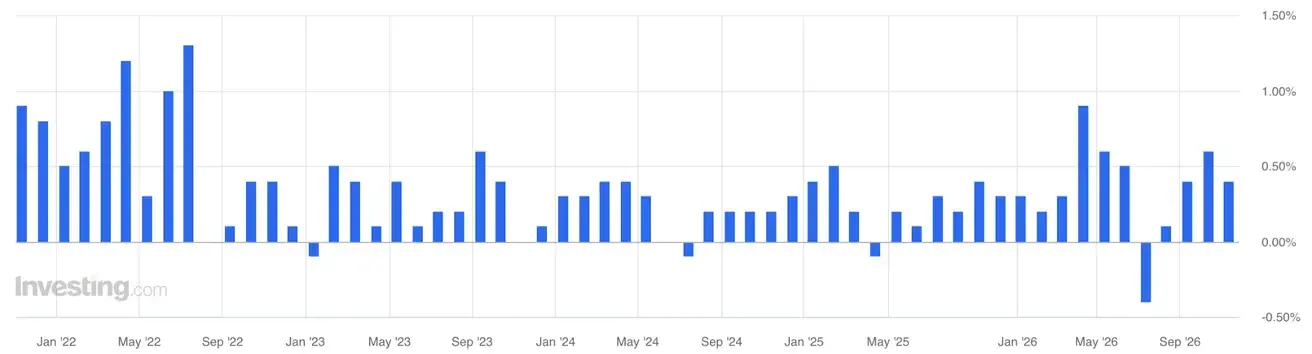
The U.S. Bureau of Labor Statistics (BLS) explained that in October 2025, due to the lapse in federal government funding, CPI data were not collected for most categories. As a result, there is no valid October 2025 / October 2026 comparison base for October 2026. Annual figures are expected to reappear in November 2026.
Producer Price Index (October)
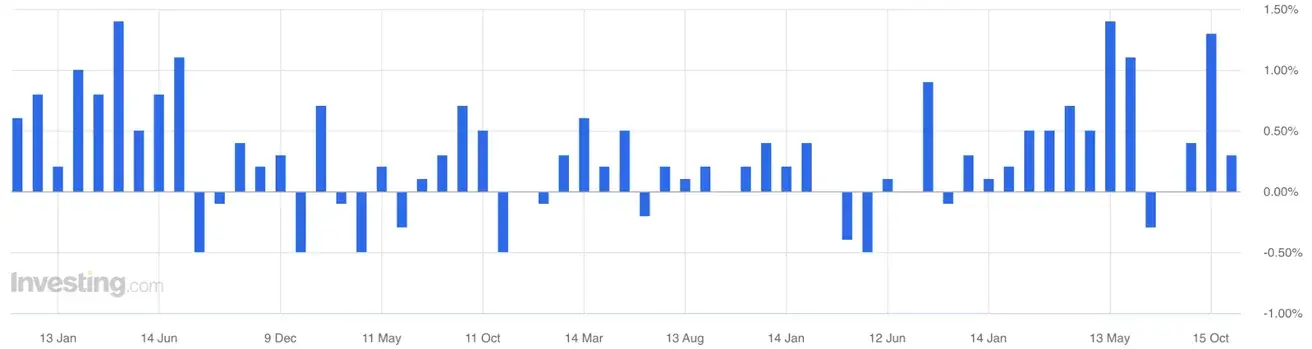
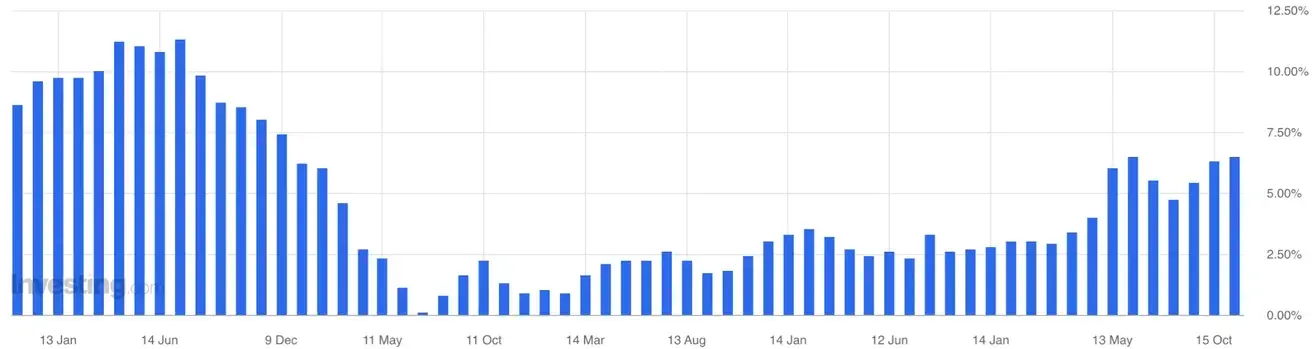
- PPI (MoM): 0.3% (previous: 1.4%, revised):
- PPI (YoY): 6.3% (previous: 6.5%):
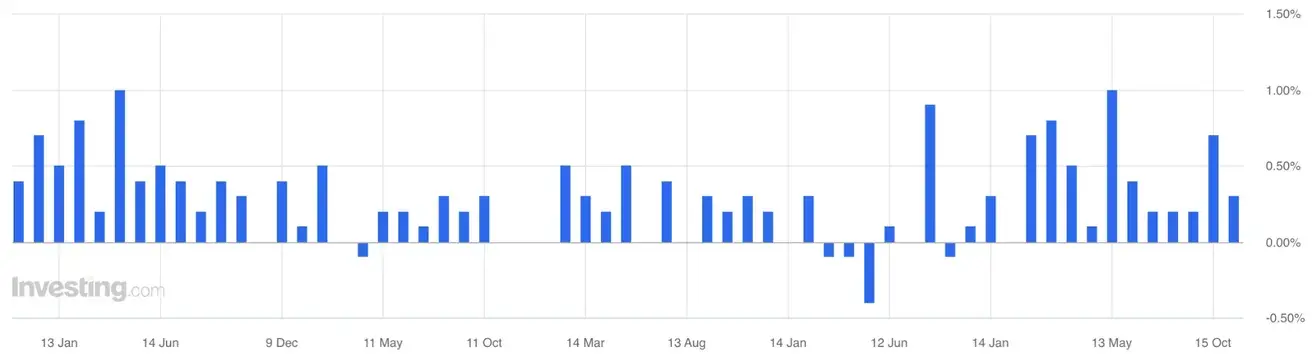
- Core PPI (MoM): 0.3% (previous: 0.8%, revised):
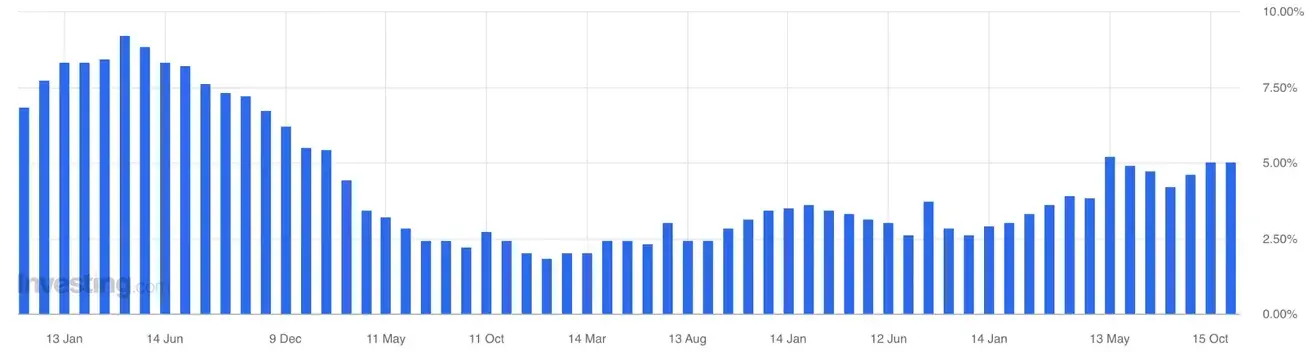
- Core PPI (YoY): 5.0% (previous: 5.0%):
Inflation Expectations (Michigan) (October)
- 12-month Inflation Expectations: 4.3% (previous: 4.7%).
- 5-Year Inflation Expectations: 3.4% (previous: 3.5%).
The Fed's inflation benchmark
Core PCE Price Index (September)
MoM: 0.3% (previous: 0.2%):
YoY: 3.1% (previous: 3.0%):
Headline PCE Price Index (September):
MoM: 0.5% (previous: 0.3%):
YoY: 3.6% (previous: 3.4%):
GDP (U.S. Bureau of Economic Analysis, BEA) — Q3 2026 (QoQ), advance estimate: 3.4% (Q2 2026: 2.2%):
GDPNow (the Atlanta Fed's real-time estimate of official GDP growth ahead of release (Q3 2026)): 3.7% (previous: 3.4%).
Business Activity Index (PMI) (October)
(Above 50 indicates expansion; below 50 indicates contraction)
- Services PMI: 56.1 (previous: 58.8)
- Manufacturing PMI: 54.9 (previous: 56.0)
- Composite PMI: 55.9 (previous: 58.4)
Labor Market (BLS) (October)
- Unemployment rate: 4.1% (previous: 4.2%);
- Total number of people receiving unemployment benefits in the U.S.: 1,697K (previous: 1,718K);
- Initial jobless claims: 200K (previous: 189K);
- Change in nonfarm payrolls: 165K (previous: 60K, revised);
- Change in private nonfarm payrolls: 159K (previous: 78K, revised);
- Average hourly earnings (YoY): 3.1% (previous: 3.2%, revised) — a slowdown, which is positive in terms of inflationary pressure;
- JOLTS job openings: 7.523M (prev: 7.271M).
Monetary Policy
Fed Officials' Rhetoric
- Michelle Bowman (Fed Board Governor, FOMC member, November 10): rather hawkish rhetoric — inflation is proving more persistent than expected, while the economy and the labor market remain solid. Bowman allows for further tightening but stresses the need to take into account already tighter financial conditions and the risks around AI capex and energy;
- Austan Goolsbee (Chicago Fed President, FOMC member, November 9 and 12): noticeably more concerned about inflation — he called its dynamics “troubling” and separately noted that the data center construction boom may already be overheating demand, pushing up prices for equipment, land, construction and energy;
- Thomas Barkin (Richmond Fed President, FOMC member, November 9): inflation remains the main risk for him, but he favors a cautious approach to decision-making — he is not precommitting to a move at the December meeting and wants to wait for new inflation and employment data;
- Christopher Waller (Fed Board Governor, FOMC member, November 10): one of the most hawkish signals of the week — the economy is growing strongly, the labor market is close to full employment, and inflation is too high. In his view, further tightening will be needed sooner rather than later, although the rate need not be raised at every meeting;
- Susan Collins (Boston Fed President, November 13): a hawkish signal — she said that a further rate hike appears necessary and that the policy path may turn out somewhat tighter than she had previously expected due to persistent inflation;
- Philip Jefferson (Fed Vice Chair, November 13): noted a resilient economy and labor market but inflation above target; he sees the inflation trajectory as the key guide for future policy. He also noted that AI could boost productivity and potentially the neutral rate.
Bottom line of the week: Fed rhetoric has shifted noticeably in a hawkish direction.
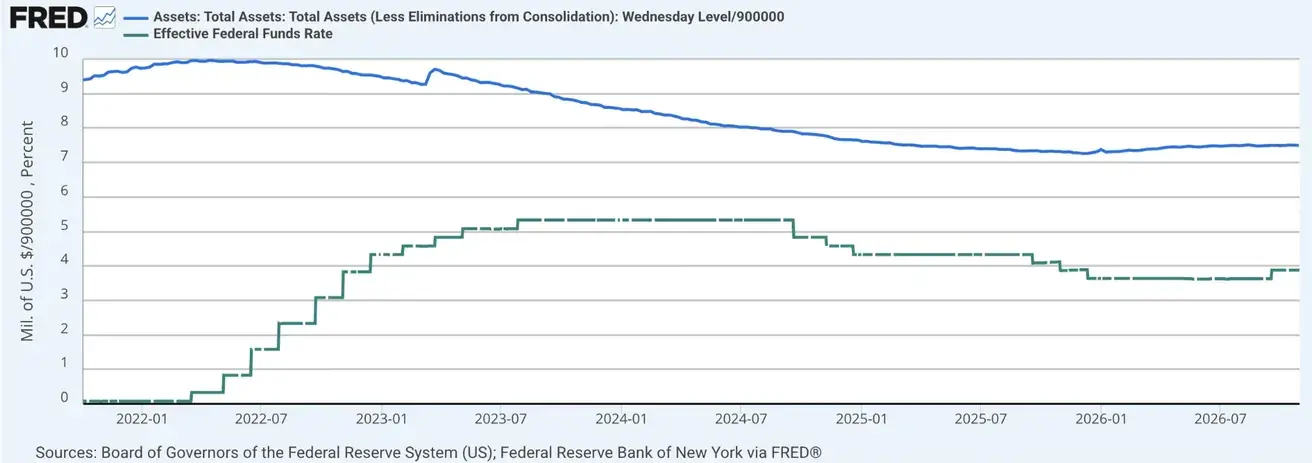
Federal funds rate (EFFR): 3.75%–4.00%
Federal Reserve balance sheet: $6.758 trillion, +3.41% since the end of QT ($6.535 trillion):
Market Forecast for Rate (FedWatch)
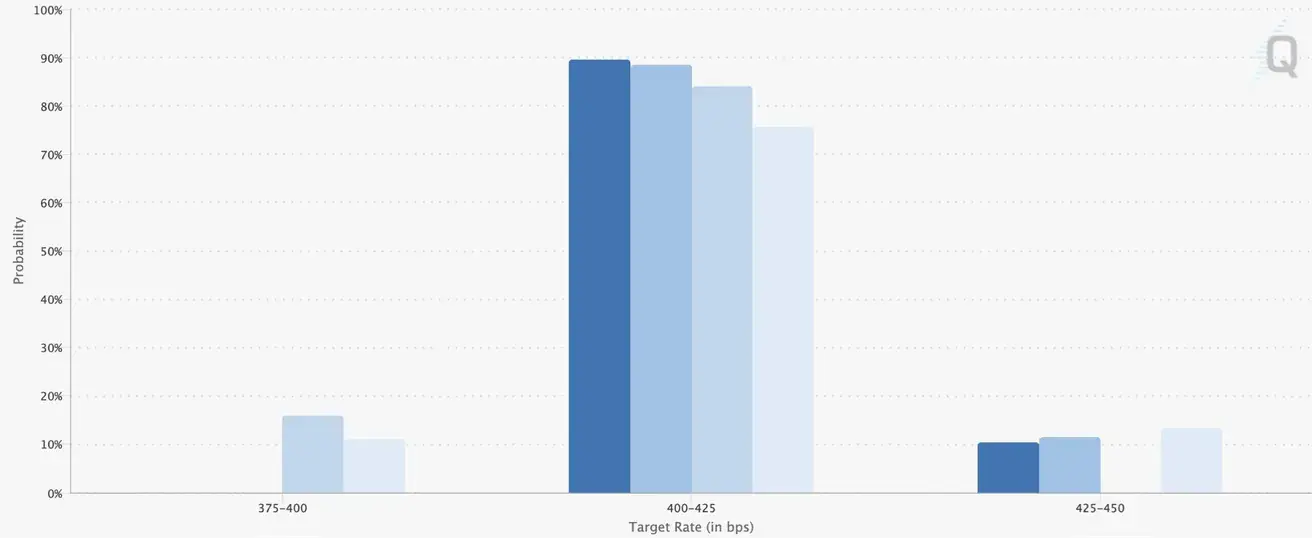
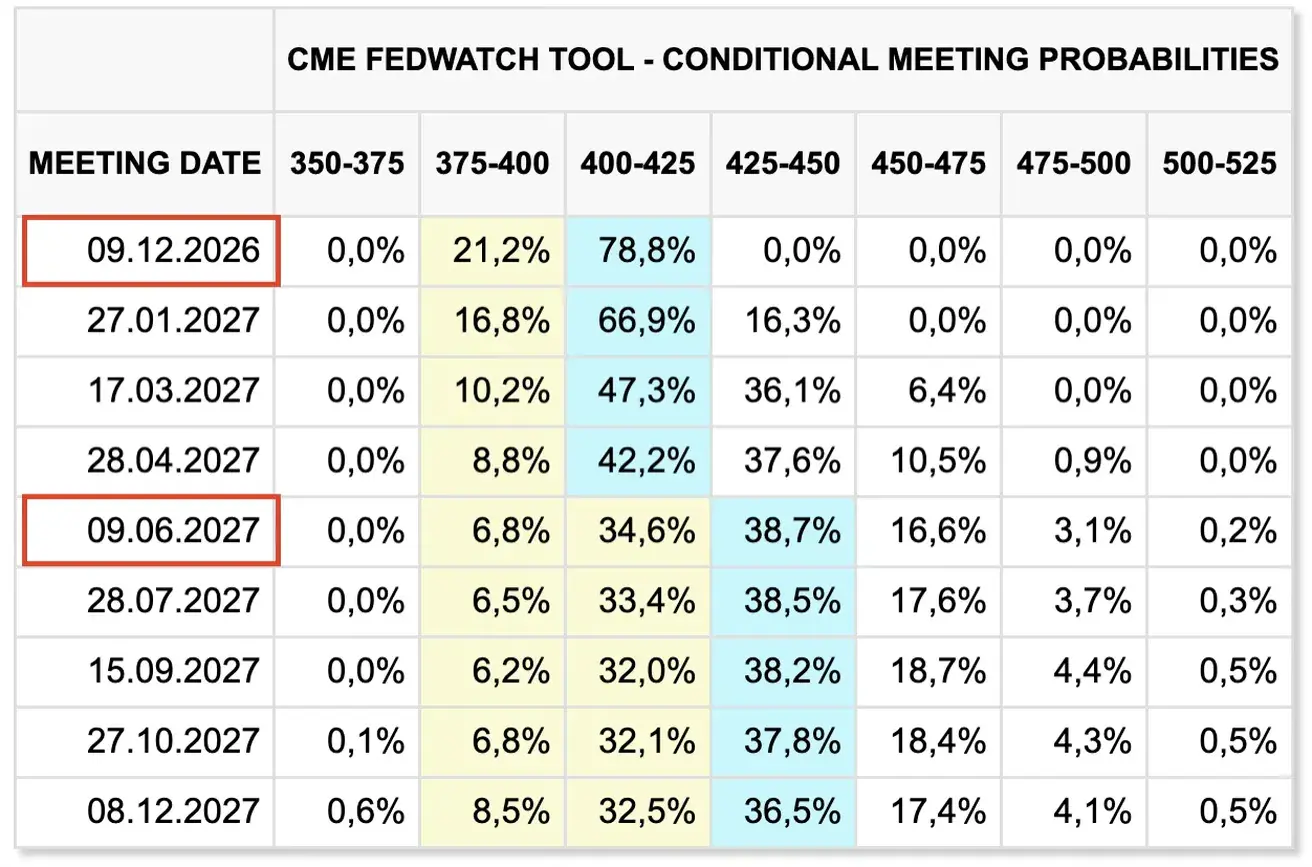
For the next FOMC meeting (December 9), a rate hike remains the more likely outcome: the probability of a 0.25% hike stands at 89.69% (a week earlier: 78.83%; two weeks earlier: 70.74%):
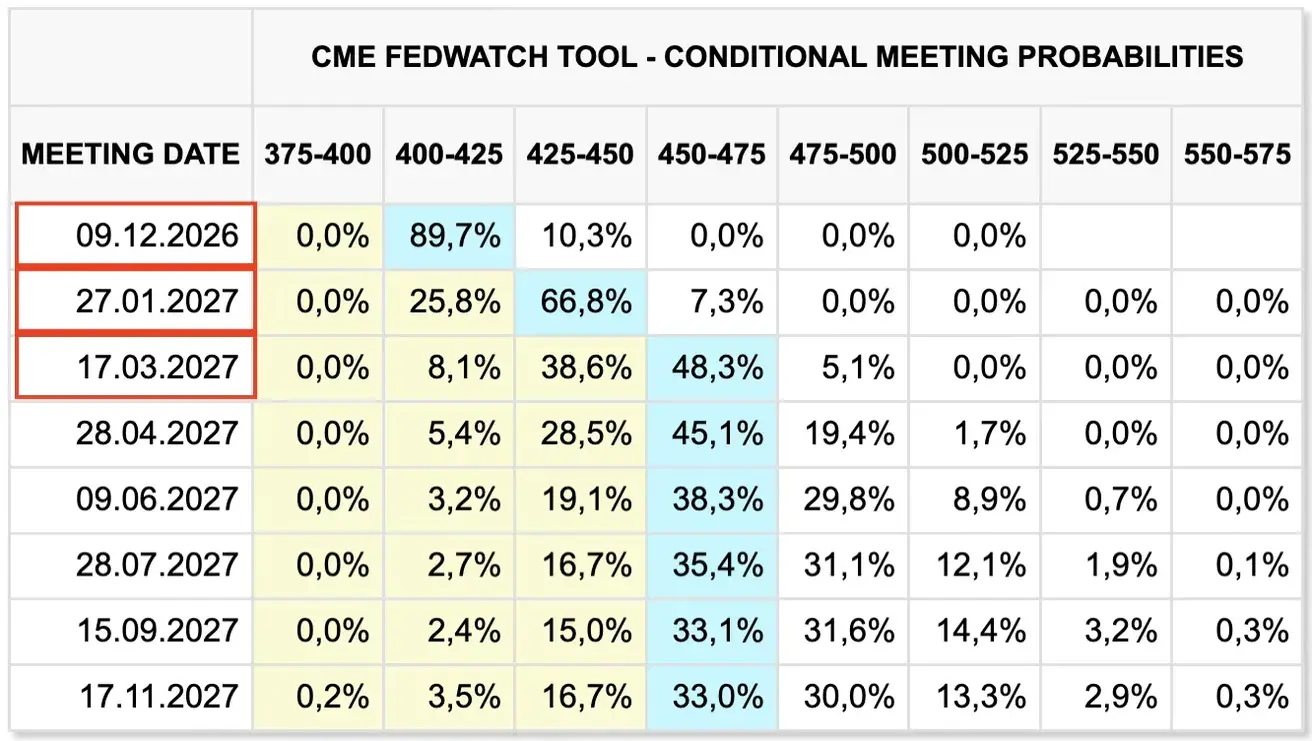
Over the next 12 months: expectations have worsened — three 0.25% rate hikes bringing the rate to a range of 4.50–4.75%, with a hike at each subsequent meeting:
Today:
A week earlier:
Bond Market
The negative factor is expectations of rate hikes, plus weak demand for new Treasury issuance. A large refunding took place during the week: $58 billion in 3-year notes, $42 billion in 10-year notes, and $25 billion in 30-year bonds.
The 3-year auction was weak: a bid-to-cover ratio of 2.53, the lowest since August 2025. The 10-year auction also weakened to 2.46 versus 2.77 a month earlier, and the 30-year to 2.36 versus 2.54.
Yields:
- 3-month Treasury bill auction: 4.060% (previous: 4.040%);
- 6-month Treasury bill auction: 4.145% (previous: 4.150%);
- 3-year Treasury note auction: 4.627% (previous: 4.932%);
- 10-year Treasury note auction: 5.020% (previous: 5.300%).
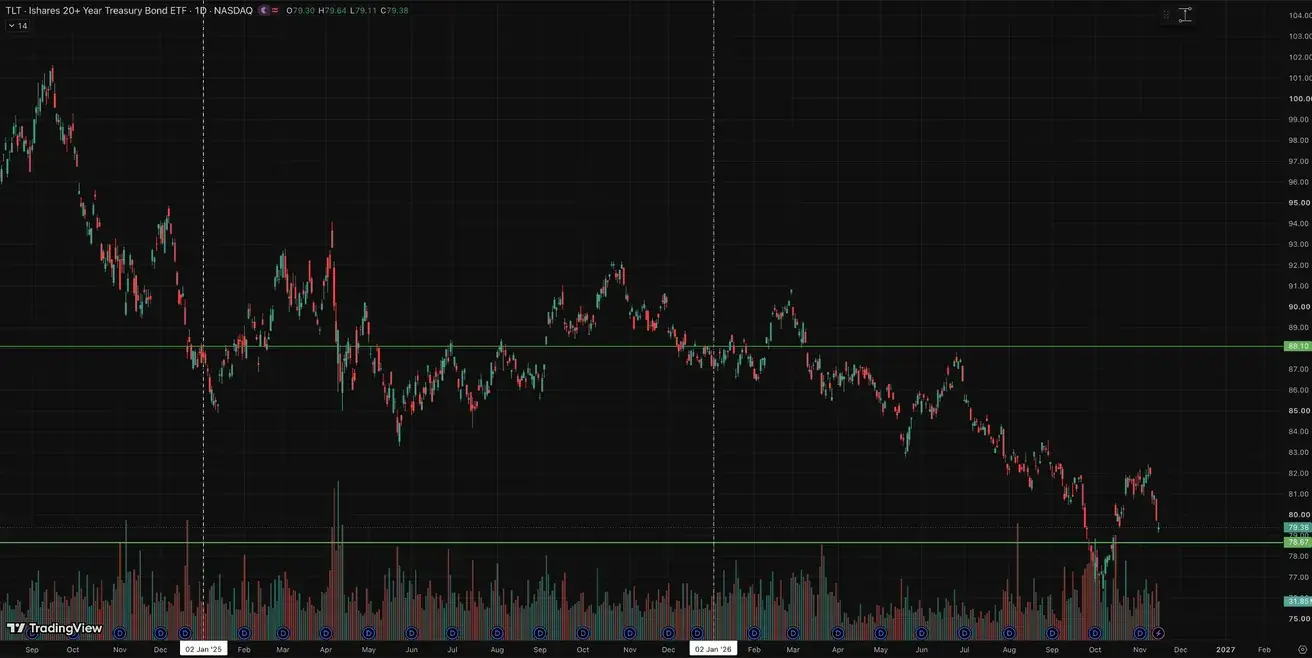
U.S. Treasury Bonds 20+ Years (TLT ETF): weekly performance: -3.10% (week close: $79.38); year-to-date: -9.93%
Yields and Spreads
- Market Yield on U.S. Treasury Securities at 10-Year Constant Maturity: 5.15% (previous: 4.88%);
- 2-Year U.S. Treasury Yield: 4.87% (previous: 4.54%);
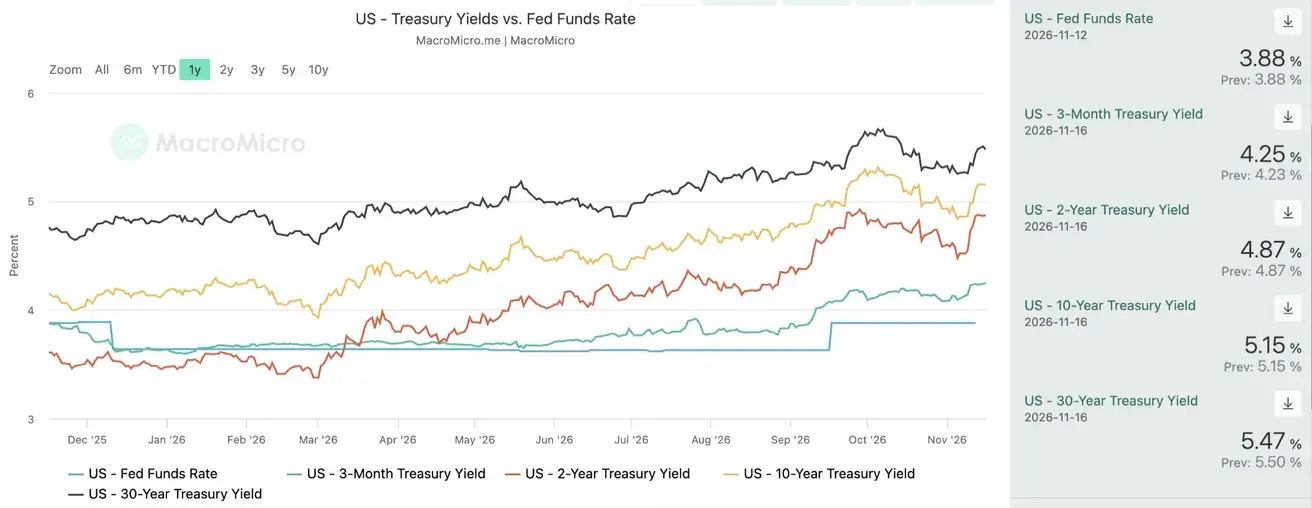
- The yield spread between 10-year and 2-year U.S. Treasury securities stands at 28 basis points (previous: 34 bps);
- The yield spread between 10-year and 3-month U.S. Treasury securities stands at 90 basis points (previous: 76 bps).
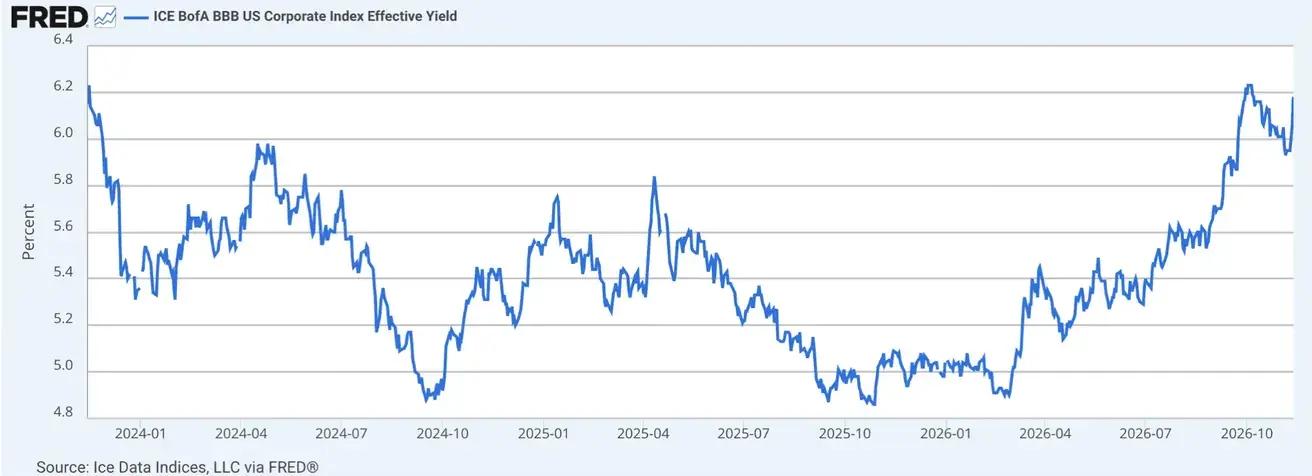
- ICE BofA BBB US Corporate Index Effective Yield: 6.18% (previous: 5.93%).
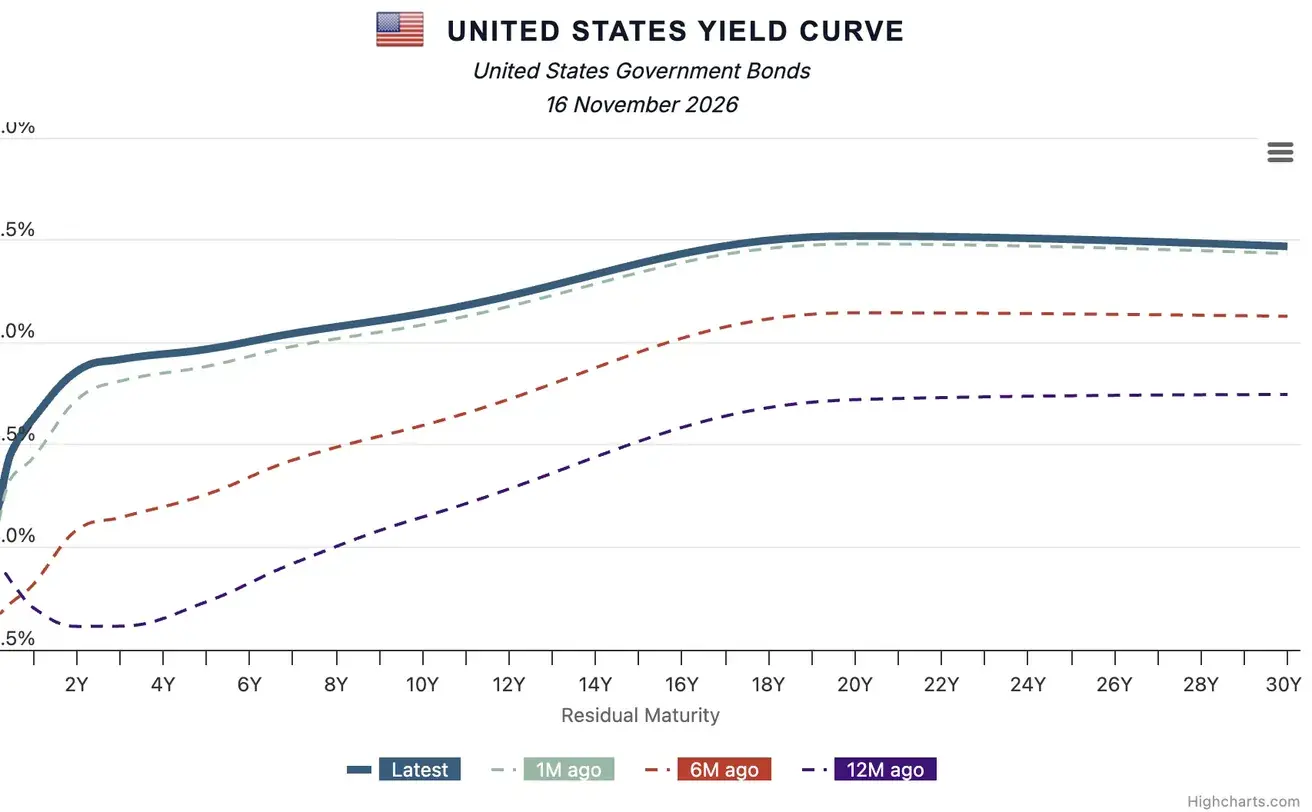
U.S. Treasury Yield Curve
The cost of a 5-year U.S. Credit Default Swap (CDS) (insurance against default): 35.31 bps (vs. 34.87 bps a week earlier).
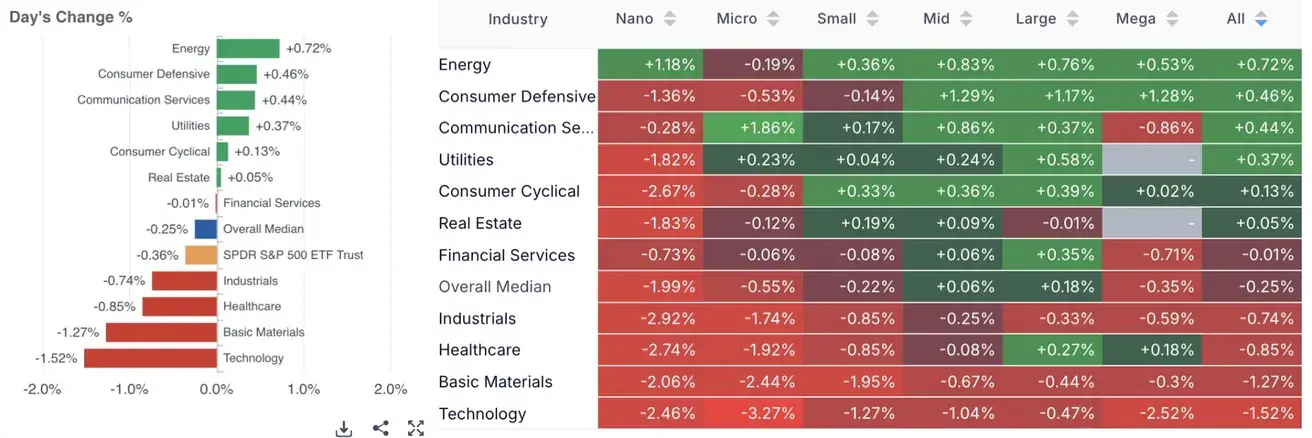
The energy and defensive sectors benefited. Laggards: technology, basic materials, and industrials.
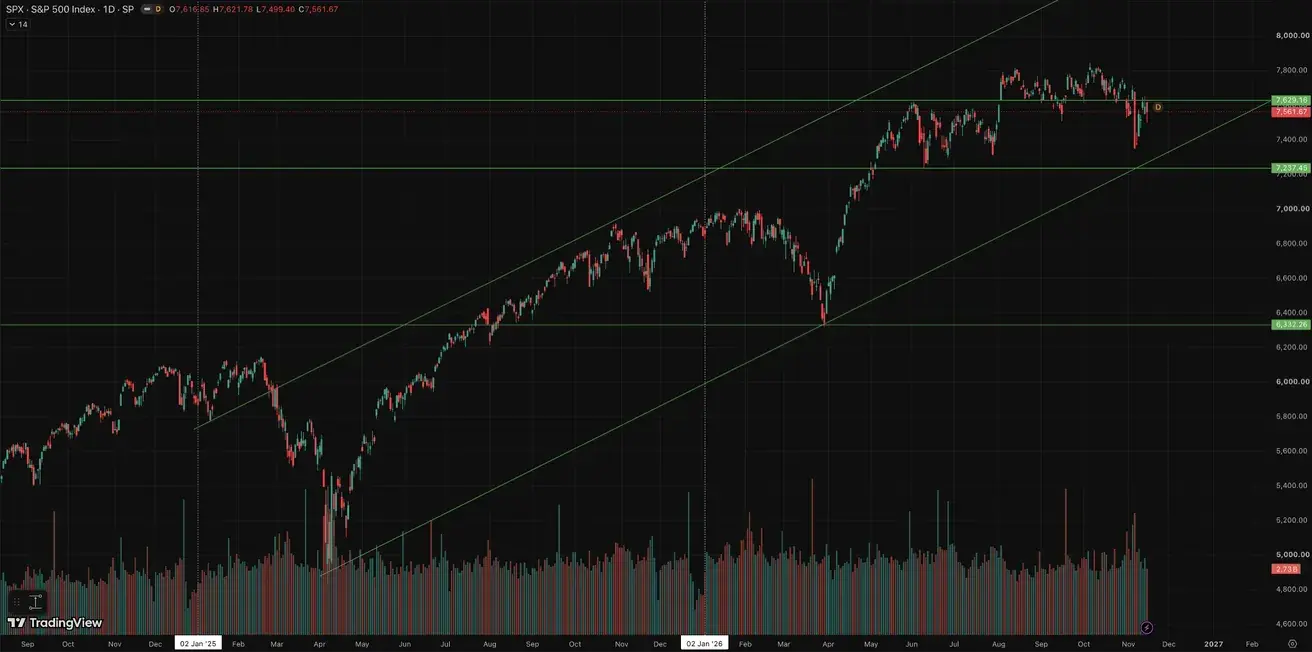
S&P500
Weekly performance: +2.51% (week-end close: 7,561.67); year-to-date: +10.46%.
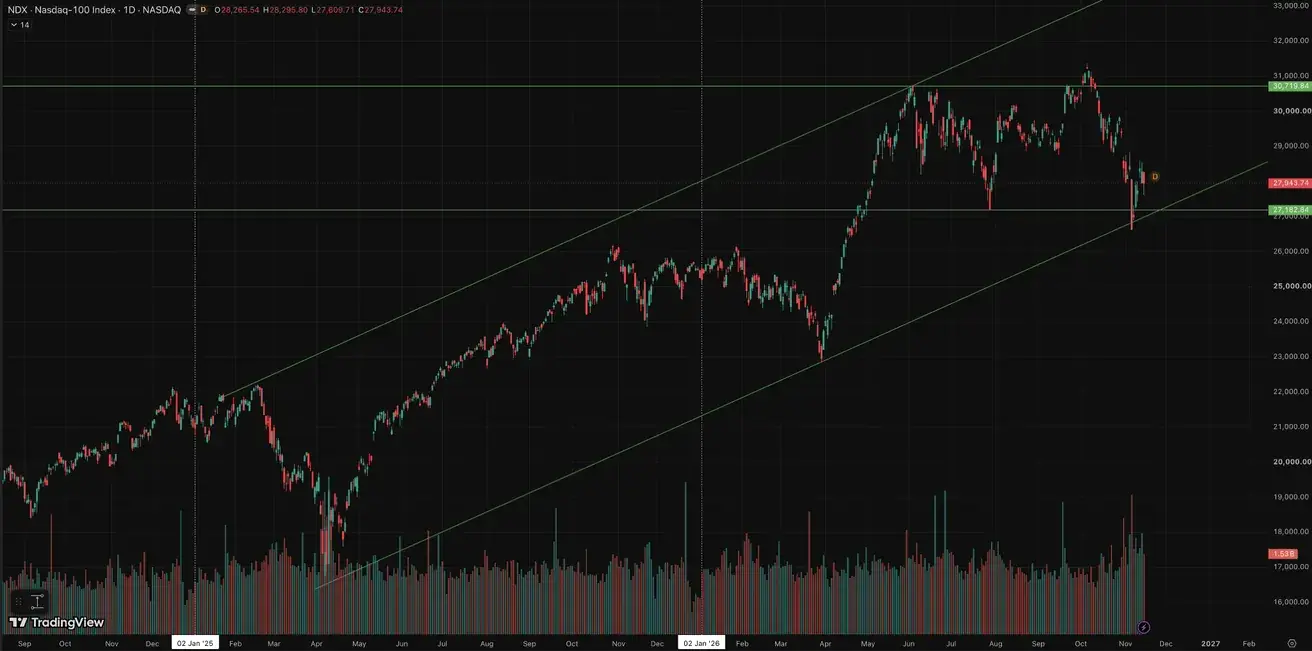
NASDAQ100
Weekly performance: +3.53% (week-end close: 27,943.74); year-to-date: +10.67%.
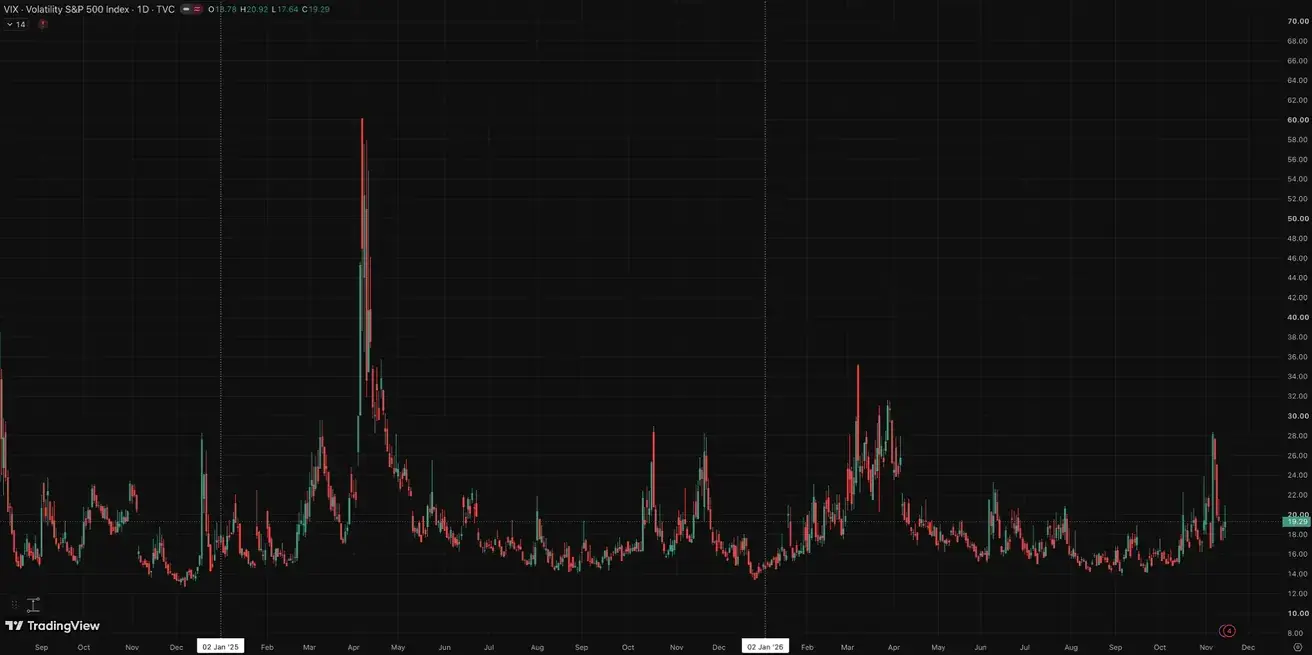
VIX
VIX (volatility index): week-end close at 19.29 points.
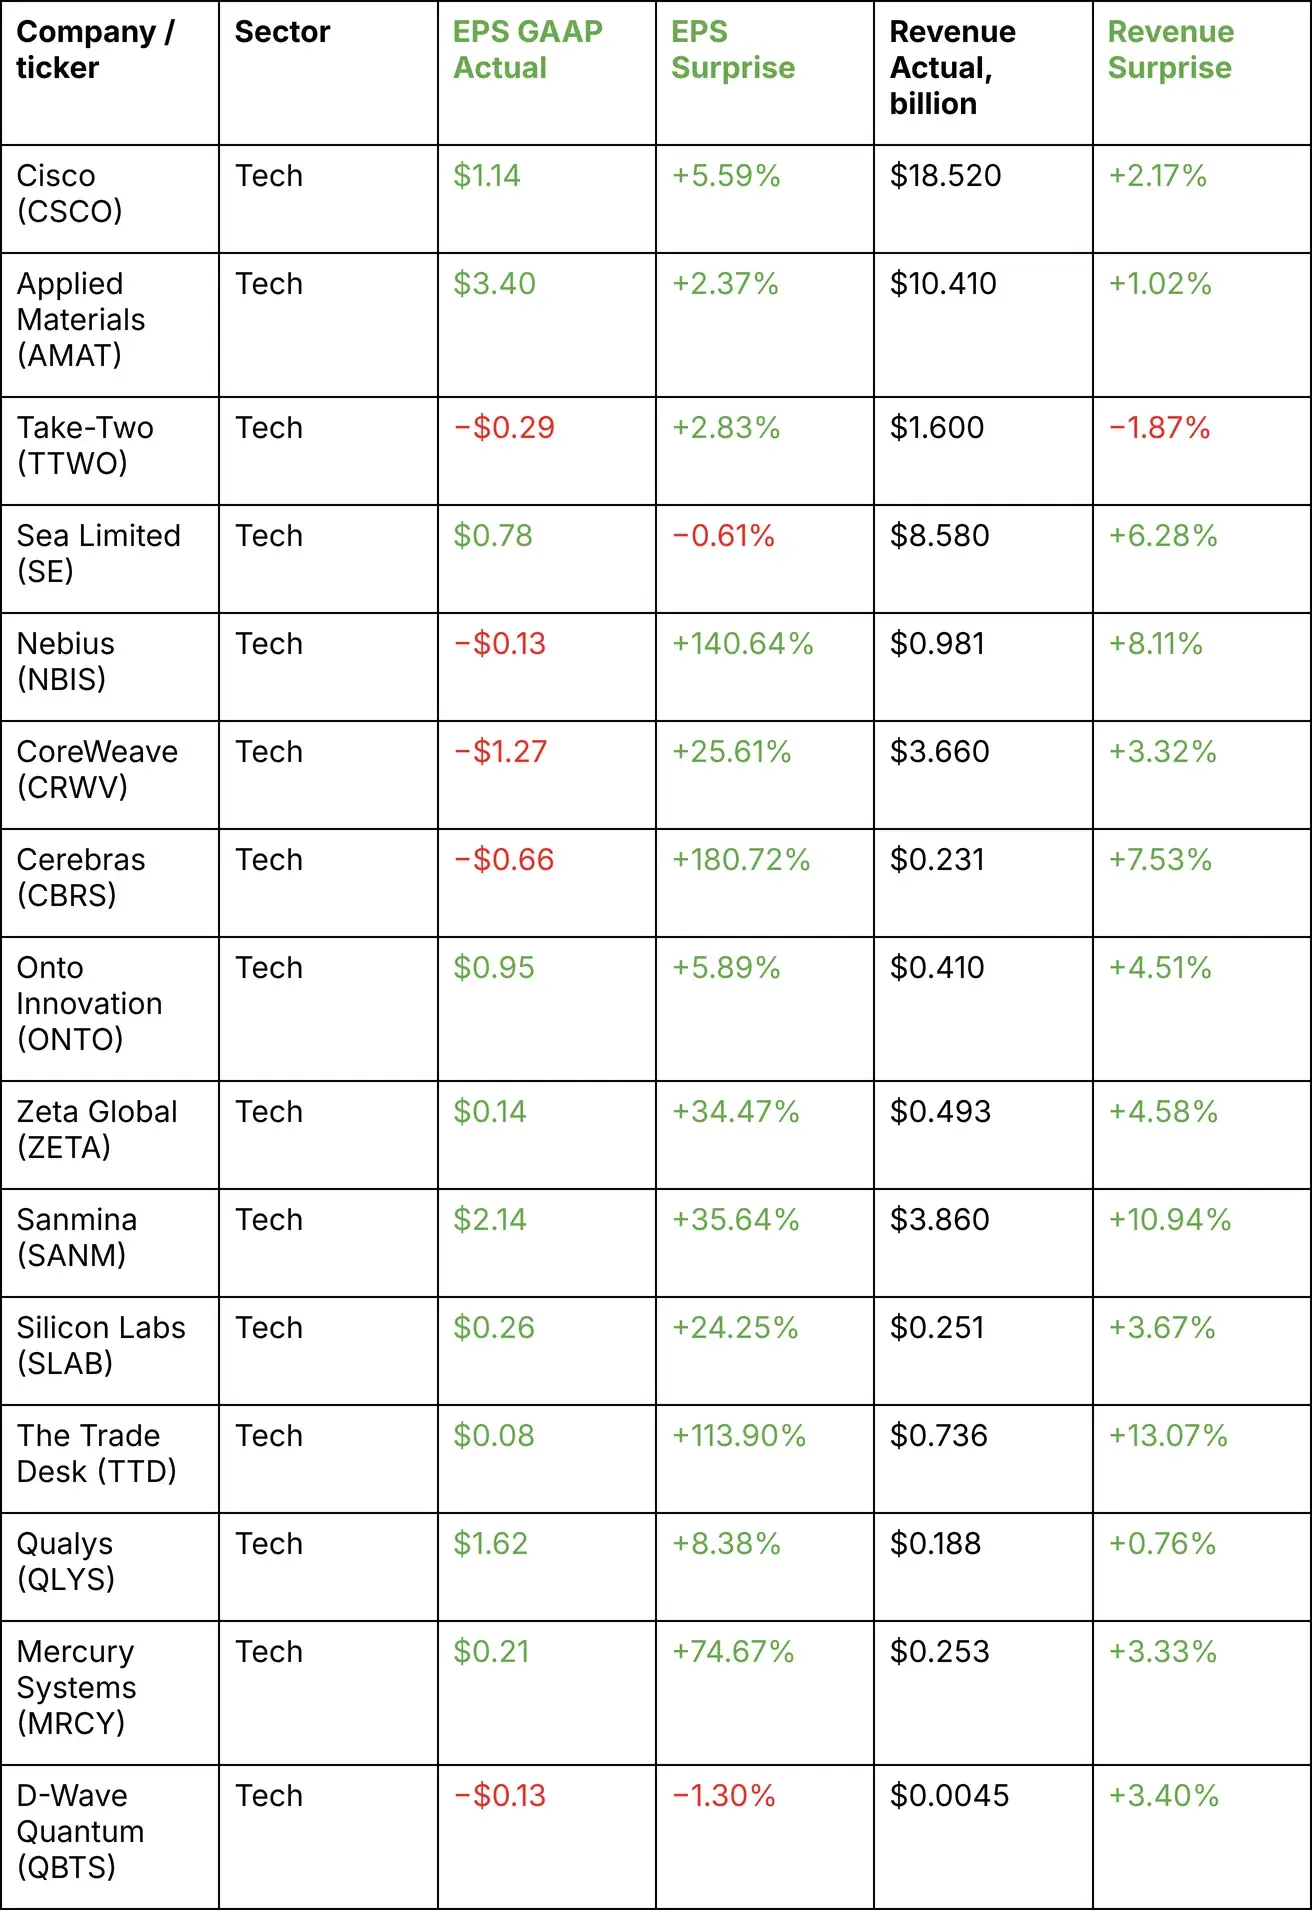
Tech Company Earnings, November 9–13
Commentary:
Dynamics: positive
Over the past week, the U.S. technology sector rose by about 2.7%, and all U.S. companies in the sample except Take-Two and D-Wave Quantum delivered strong financial results. Compared with the previous week, earnings figures are now much higher: the EPS surprises of Cerebras, TTD, Nebius and Mercury Systems are especially notable. However, as the tech market is currently more volatile, 4 of the 13 U.S. companies in the sample reported negative results this week (though these are offset by triple-digit EPS surprises). Reports from Cisco, Applied Materials, CoreWeave and Sanmina point to continued strong demand for AI infrastructure, cloud computing, networking equipment and semiconductor technologies.
Given the Democrats' victory in the U.S. general elections on November 5, which has raised concerns among many tech investors, the tech sector's dynamics are clearly positive.
Company Guidance:
Overall, guidance is predominantly positive: most companies that issued guidance expect revenue growth, sustained strong demand or further business expansion, especially in AI, cloud infrastructure and semiconductors. However, several companies have specific weak spots or headwinds:
- Cisco raised its full-year revenue guidance but expects a slight sequential decline in adjusted EPS next quarter;
- CoreWeave raised its 2026 revenue guidance, but high capital expenditures and expected interest expenses in Q4 continue to weigh on net income;
- Nebius slightly lowered its 2026 revenue guidance due to part of its revenue shifting into 2027, despite continued strong demand for AI infrastructure;
- Sanmina expects annual revenue growth but forecasts a decline in adjusted quarterly EPS from $4.43 to $3.50–3.85;
- Qualys raised its full-year revenue guidance but expects lower adjusted EPS in Q4.
(Additionally): Silicon Labs announced that it will be acquired by Texas Instruments, with the deal expected to close in the first half of 2027 (TI will buy SL).
Eurozone
- ECB — the rhetoric is moderately hawkish, but there is no signal that aggressive rate hikes are needed. The ECB acknowledges inflation risks while taking into account the cooling effect of already tighter financial conditions;
- Against the backdrop of the conflict in the Middle East, the ECB revised its GDP forecasts downward and raised its inflation projections for the coming years.
Key Points from ECB Meetings and Officials' Speeches:
ECB Economic Bulletin (November 12): the previous picture was confirmed — inflation remains above target, but economic growth is weak; financial conditions are already fairly tight. In other words, the ECB is maintaining a cautiously hawkish but not aggressive approach.
Philip Lane (ECB Executive Board member, November 10): The speech was mainly about monetary policy communication. The key message: markets react not only to the rate itself but also to how the ECB explains the future path of inflation and policy; high-quality communication helps manage expectations and financial conditions. There was almost no new signal on rates.
Isabel Schnabel (ECB Executive Board member, November 13): her “Made in Europe” speech focused on Europe's competitiveness, investment, technological lag and geopolitical fragmentation. The key message: Europe is not doomed to stagnation, but it needs deeper capital markets, investment, and higher productivity. The monetary policy signal was secondary.
Eurogroup (November 9): eurozone finance ministers discussed inflation, the fiscal outlook and the macroeconomic situation, as well as the digital euro and banking sector risks. The main backdrop is persistent inflation uncertainty amid weak growth and the need to maintain fiscal discipline.
ECOFIN (November 9, plus a separate budget meeting on November 10): ministers discussed the economic consequences of the war, fiscal rules, the Recovery Fund and regulatory simplification; on November 10, they agreed on the parameters of the EU's 2027 budget — €199.7 billion in commitments and €211.5 billion in payments, with priorities on security, Ukraine and economic resilience.
Macroeconomic Data
Interest Rates
- Deposit Facility Rate: 2.50% (previous: 2.50%);
- Marginal Lending Facility Rate: 2.9% (previous: 2.9%) — the rate at which banks can obtain overnight funding from the central bank;
- Main Refinancing Rate (Policy Rate): 2.65% (previous: 2.65%).
Inflation: Consumer Price Index (CPI) (October, flash estimate)
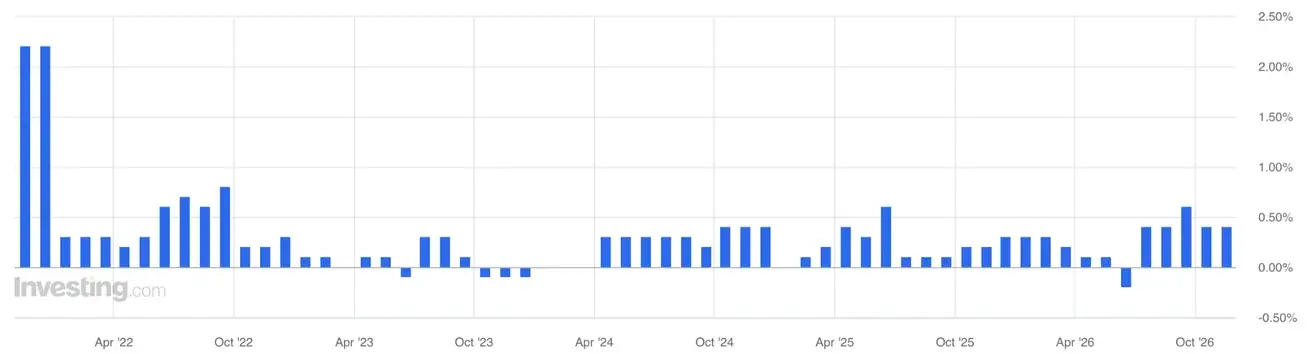
- Core CPI (MoM): 0.3% (previous: 0.2%):
- Core CPI (YoY): 2.5% (previous: 2.5%):
- Headline CPI: 0.4% (MoM) (previous: 0.6%);
- CPI: 4.0% (YoY) (previous: 3.8%).
Producer Price Index (PPI) (October)
- MoM: 2.5% (previous: 2.0%):
- YoY: 11.1% (previous: 8.3%):
GDP Q3 2026 (preliminary estimate)
- QoQ: 0.4% (previous: 0.6%):
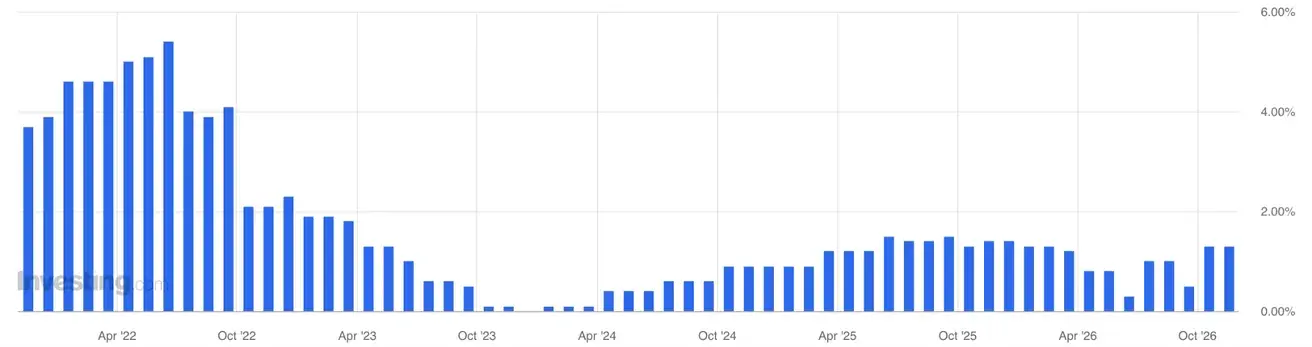
- YoY: 1.3% (previous: 1.2%, revised):
Trade balance (USD) (YoY): -16.1 bn (previous: 10.7 bn);
Industrial production (September): (MoM) -0.5% (previous: -0.3%, revised):
Unemployment Rate (September): 6.5% (previous: 6.4%).
Eurozone Consumer Confidence Index: -17.9 (previous: -16.8)
Purchasing Managers’ Index (PMI) (September)
- Services PMI: 51.4 (previous: 53.0);
- Manufacturing PMI: 52.7 (previous: 52.9);
- S&P Global Composite PMI: 51.7 (previous: 52.9).
Euro Stoxx 600 (FXXP1!)
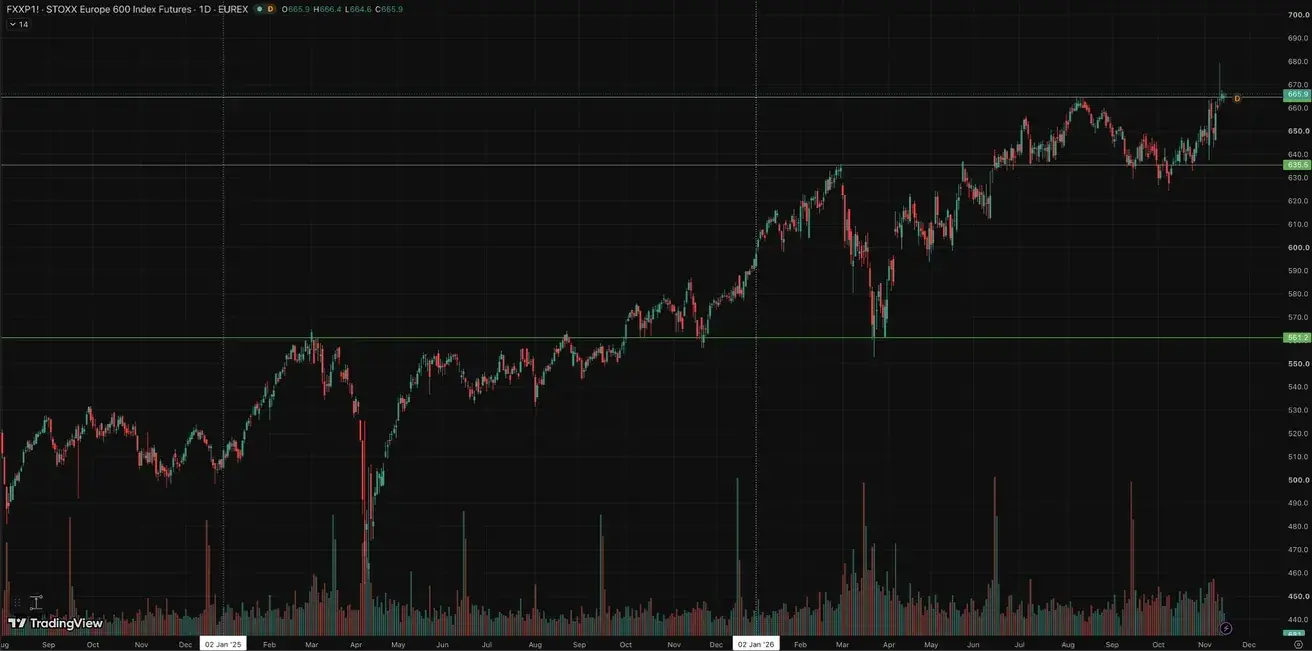
Weekly performance: +2.46% (week-end close: 665.1); year-to-date: +11.78%.
China
China’s economy continues to stabilize, supported by strong exports, while domestic demand and investment gradually recover. Policymakers remain measured and targeted in their stimulus approach.
- Interest rates remain unchanged;
- Monetary policy remains accommodative;
- China reaffirmed its commitment to fiscal support for economic growth under its 2026 plan, including measures to stimulate domestic demand, optimize tax incentives and subsidies, and modernize industrial capacity.
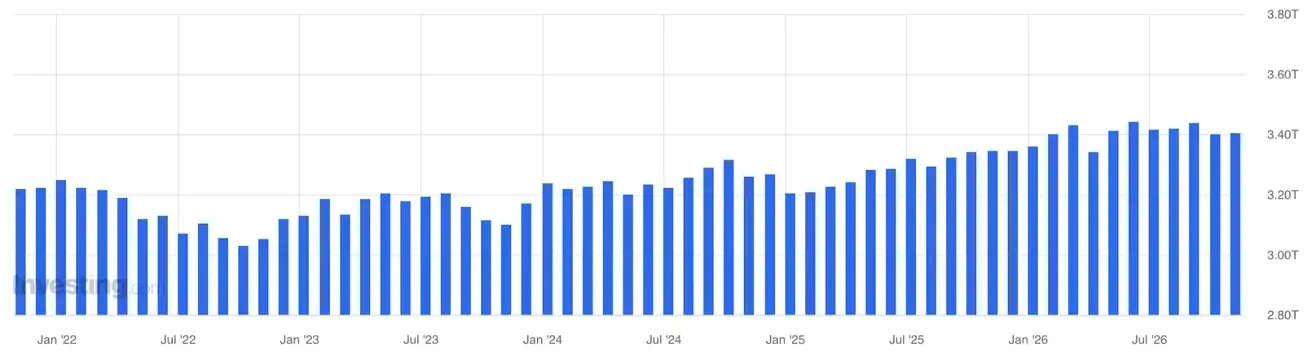
International foreign exchange reserves were virtually unchanged in October at $3.405 trillion (+0.14% MoM). The stable level of reserves preserves a substantial external buffer for the economy and does not indicate any noticeable pressure on reserves from the yuan exchange rate.
The People's Bank of China continues to actively build up its gold reserves, with purchases accelerating precisely amid the correction in gold prices. About 23 tonnes were bought in September, 63 tonnes in the third quarter and 103 tonnes year-to-date. October SAFE data show continued purchases of roughly another 26 tonnes:
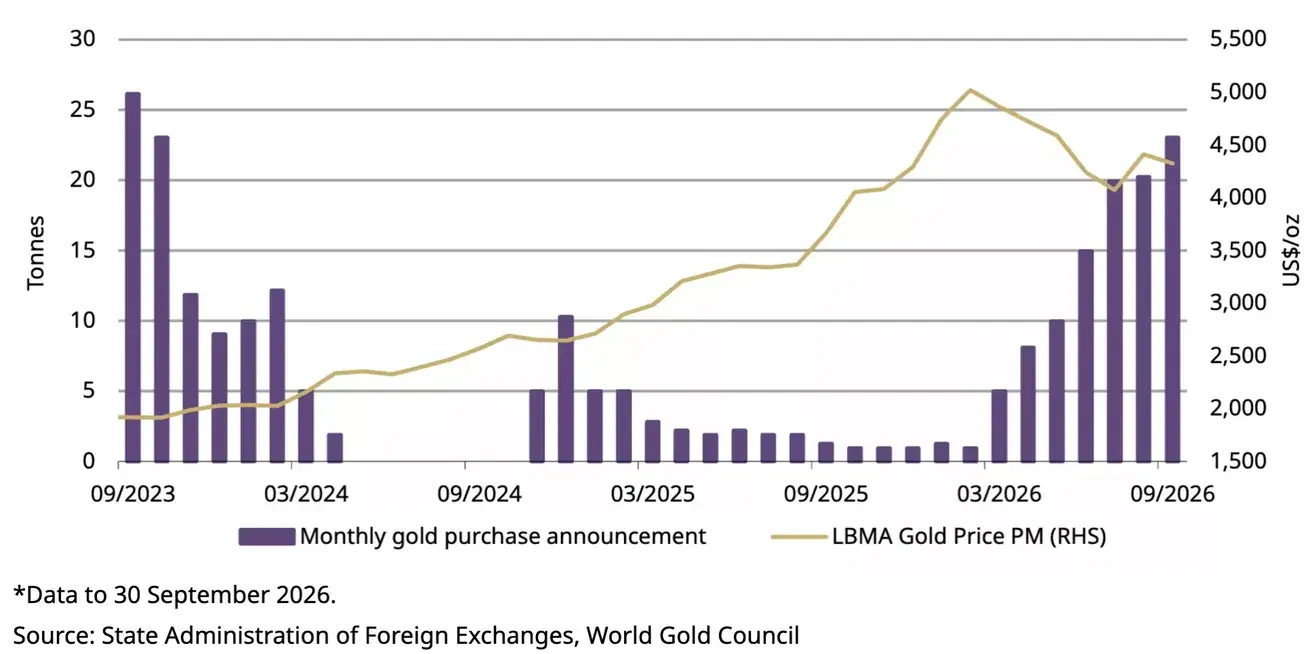
China continues to diversify its reserve assets: direct holdings of U.S. Treasuries have declined by about $105 billion since the start of 2026.
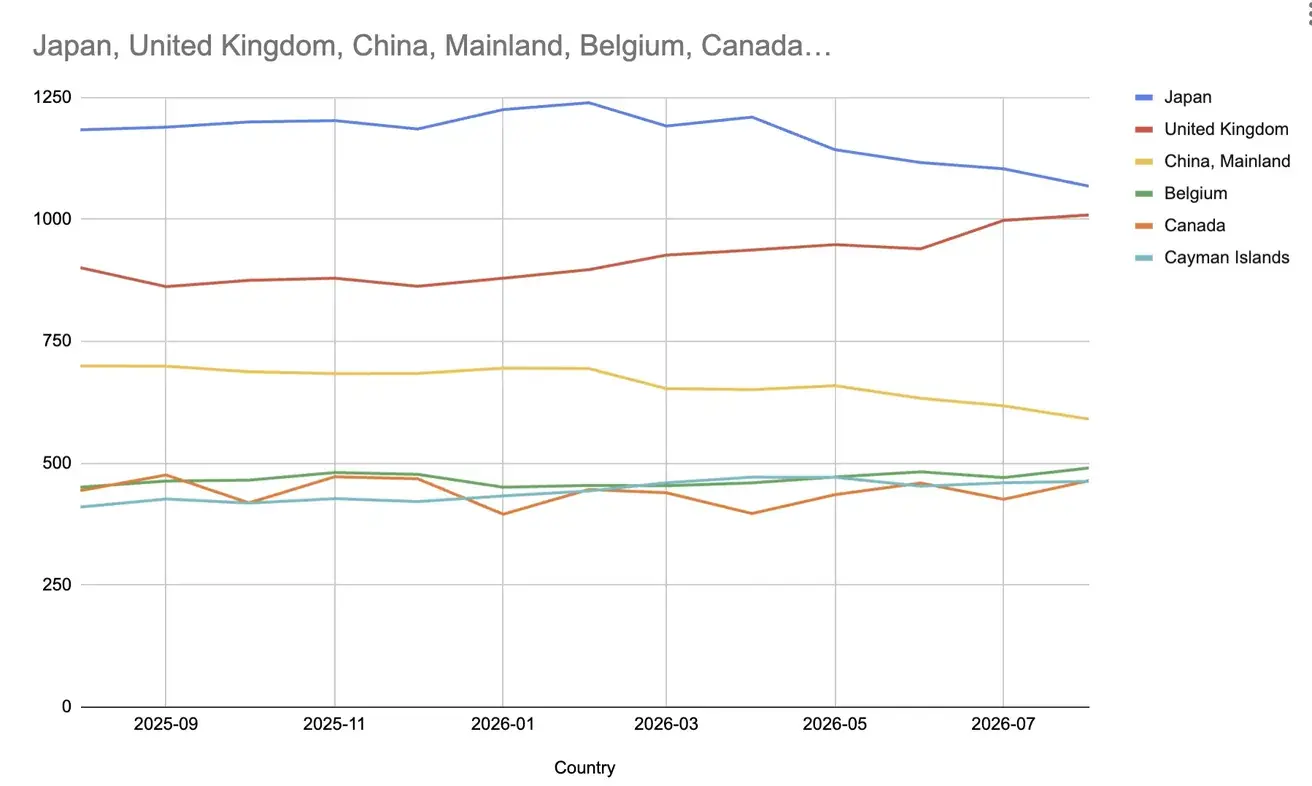
* chart based on data from ticdata.treasury.gov
The key trend is not a reduction in reserves but their reallocation. China maintains a large external buffer but continues to change its structure: building up gold and reducing direct exposure to Treasuries.
Macroeconomic Data
Interest Rates
- 1-Year Loan Prime Rate (medium-term lending): 3.00%;
- 5-Year Loan Prime Rate (benchmark for mortgage lending): 3.50%.
Inflation Indicators (October)
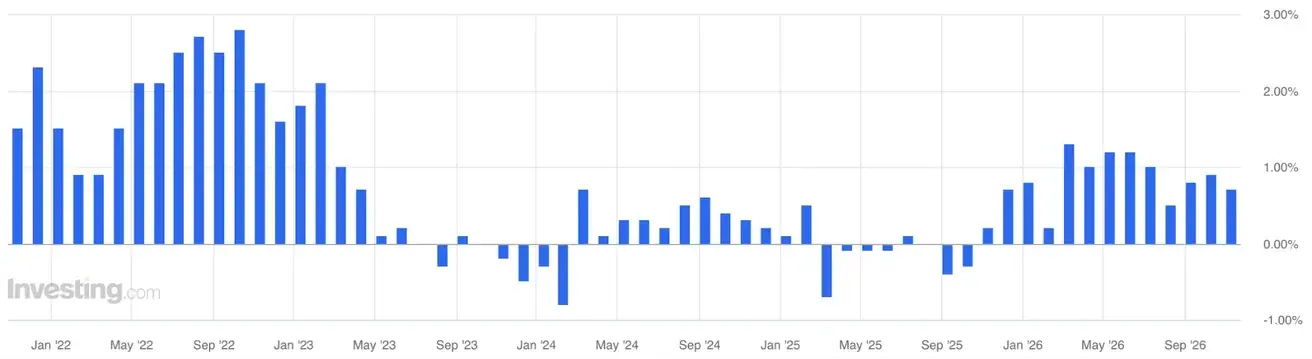
CPI slowed to 0.7% YoY in October, and core inflation to 0.8%. Food prices fell 2.9% YoY, while services rose only 0.7%, meaning there is still no strong domestic price impulse from consumers.
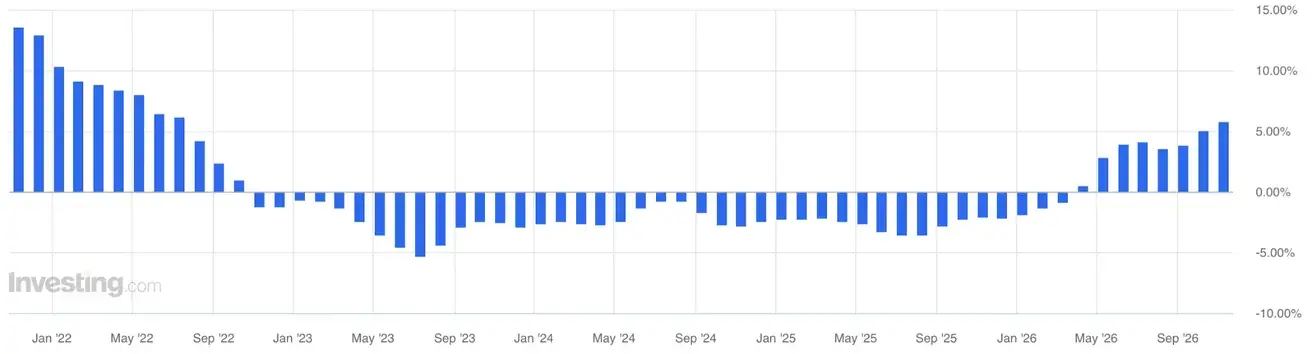
PPI, however, accelerated to 5.7% YoY, with the increase almost entirely concentrated in production inputs: producer goods +7.4%, mining +27.9%, raw materials +11.6%. Producer purchase prices rose even more, by 7.9%, including fuel and energy +18.6% and chemical raw materials +16.8%.
Thus, inflation in China remains primarily cost-driven: the main pressure is building in mining, raw materials, and energy, while weak pass-through of rising costs to final prices points to persistently weak domestic demand and pressure on producers' margins.
- Consumer Price Index (CPI): 0.2% MoM (previous: 0.4%)
- Consumer Price Index (CPI): 0.7% YoY (previous: 0.9%)
- Producer Price Index (PPI): 5.7% YoY (previous: 5.0%)
Trade Data (October)
China's foreign trade remains very strong, but October's dynamics became more balanced.
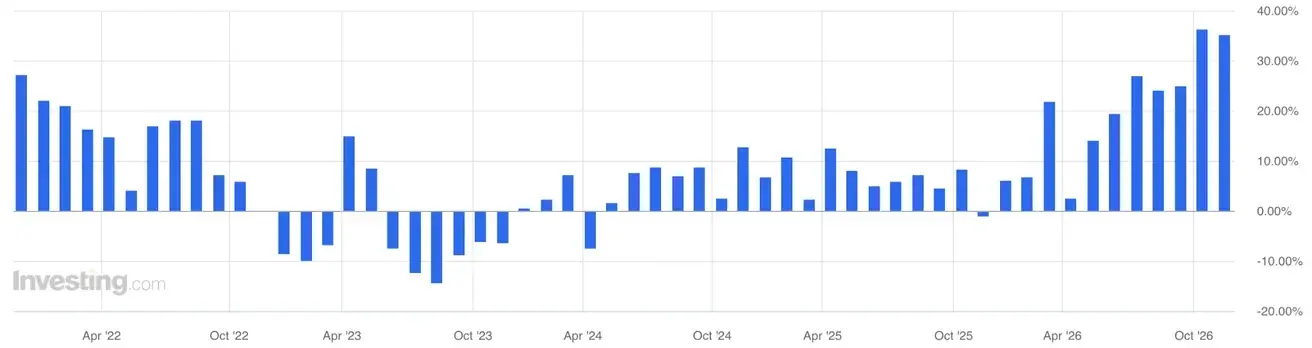
Exports rose 35.2% YoY (almost maintaining September's 36.3% pace). This confirms that the external sector remains one of the main drivers of the economy.
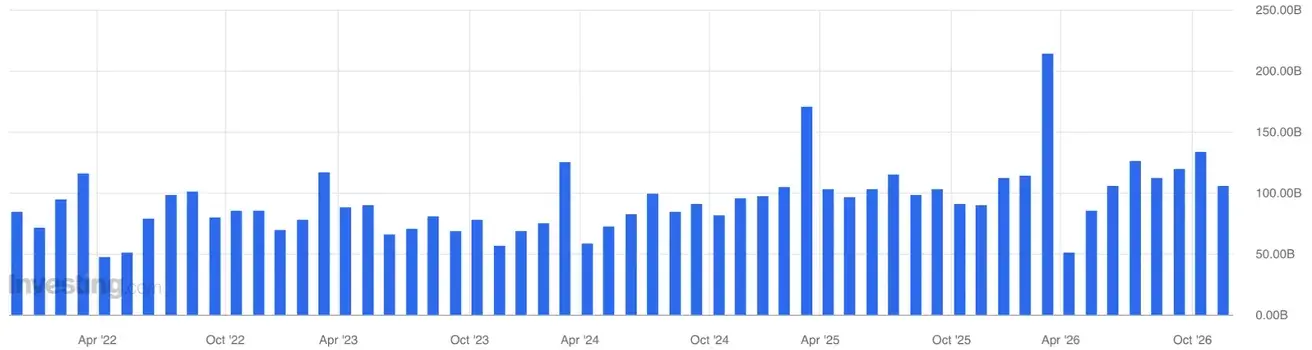
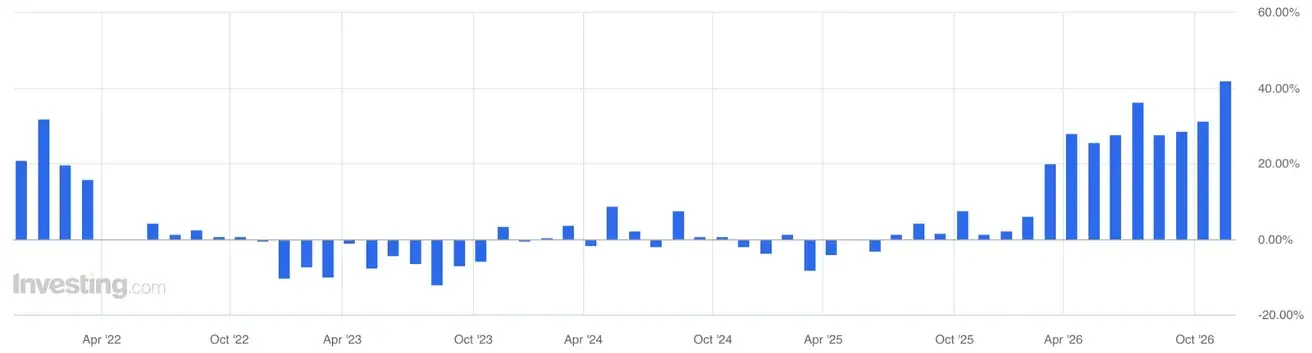
Imports: +41.6% YoY (vs. 31.0% a month earlier). As a result, the trade surplus narrowed to $105.3 billion from $133.5 billion in September. In other words, the surplus shrank not because of a collapse in exports but mainly because of a sharp acceleration in imports.
On the one hand, one could say that rising imports mean rising domestic demand, but that is not the case for China today. Import growth is driven not by consumer goods (cars, electronics, food, etc.) but mainly by oil, gas, metals, semiconductors, components and capital goods. This rather reflects a strengthening industrial cycle, inventory restocking or preparation for further exports.
Trade balance (USD) (YoY): $105.28 bn (previous: $133.53 bn):
Imports: 41.6% YoY (previous: 31.0%):
Exports: 35.2% YoY (previous: 36.3%):
GDP (Q3 2026)
- QoQ: 1.2% (previous: 0.9%);
- YoY: 4.5% (previous: 4.3%).
Labor Market
- Unemployment Rate (September): 5.2% (previous: 5.3%).
Industrial Activity
- Industrial Production (September, YoY): 5.5% (previous: 5.2%).
Fixed Asset Investment
- September, YoY: -7.2% (previous: -6.7%).
Retail Sales
- September, YoY: 1.1% (previous: 0.4%):
Purchasing Managers’ Indices (PMI) (October)
- Manufacturing PMI: 49.3 (previous: 50.1);
- Non-Manufacturing PMI: 49.7 (previous: 50.2);
- Composite PMI: 49.7 (previous: 50.7).
Stock Market
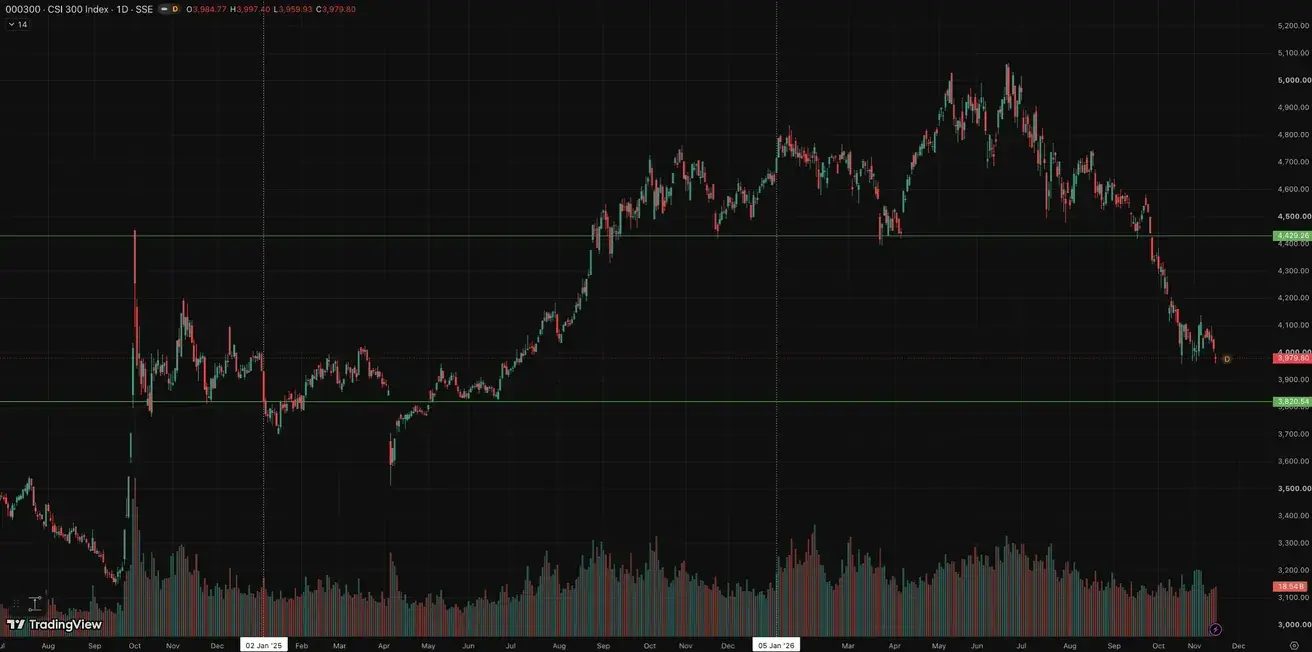
Huang's resignation was not just Nvidia corporate news for China but a new political and technological risk. The market began pricing in the likelihood of tighter U.S. restrictions on AI chip supplies and Chinese companies' access to computing infrastructure, increasing pressure on China's tech sector and contributing to the stock market decline.
CSI 300 Index (000300.HK)
Weekly performance: -0.94% (week-end close: 4,016.29); year-to-date: -27.04%.
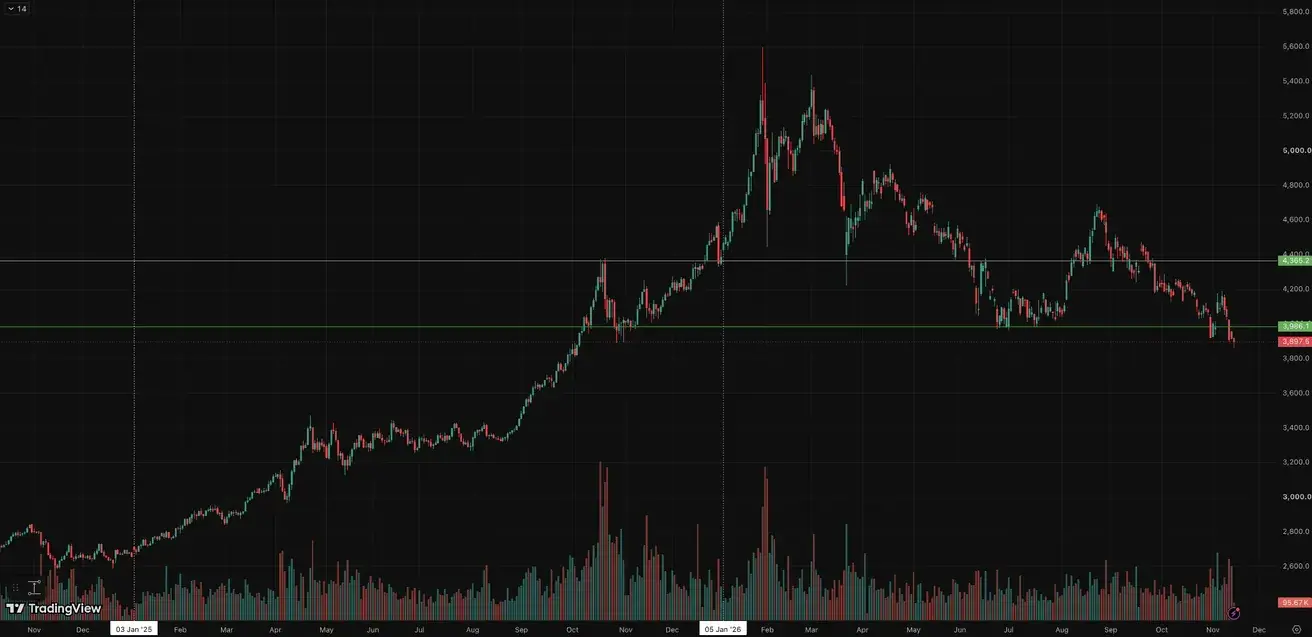
Gold Futures (GC)
Gold futures (GC): the stronger dollar and the sharp rise in yields are again weighing on gold.
Weekly performance: -4.30% (week close: $3,918.4/troy oz); year-to-date: -9.55%.
Central bank gold purchases remain concentrated: in 2026, the main demand comes from Poland, China, Uzbekistan, Kazakhstan, and the Czech Republic, while Turkey and Russia remain the largest sellers. China and Poland continue building reserves even at high gold prices, confirming the long-term nature of reserve diversification.
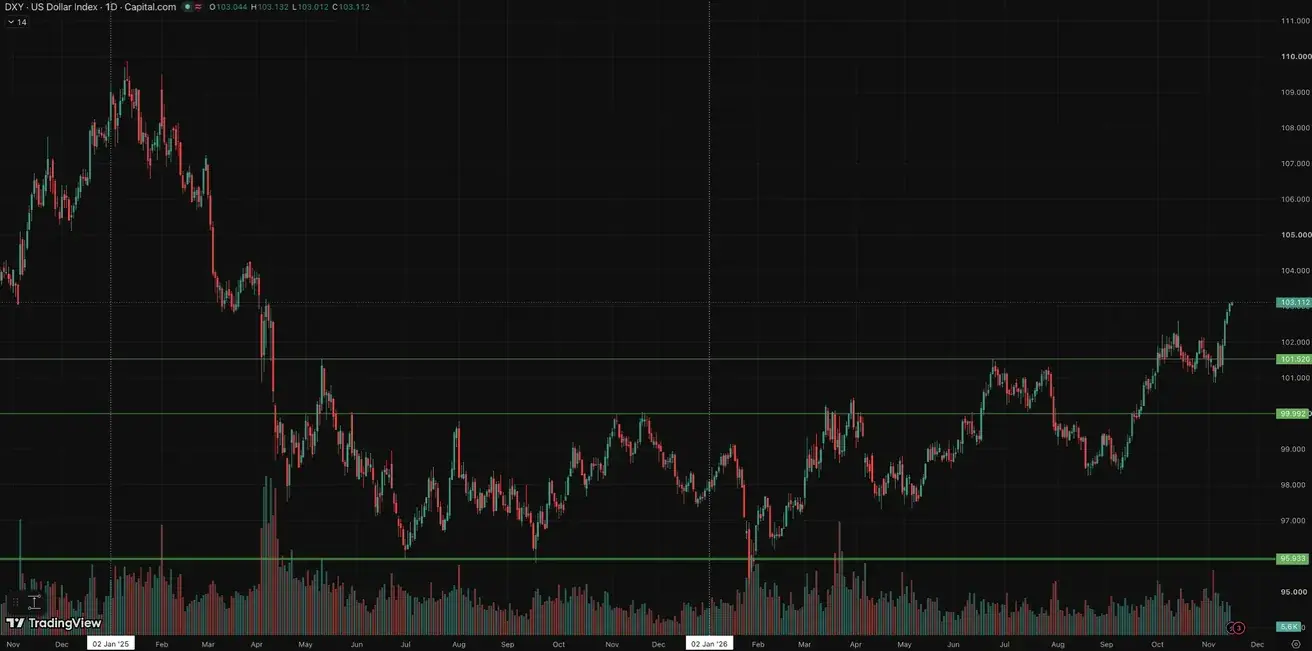
Dollar Index Futures (DX)
Weekly performance: +1.09% (week close: 103.076); year-to-date: +5.18%.
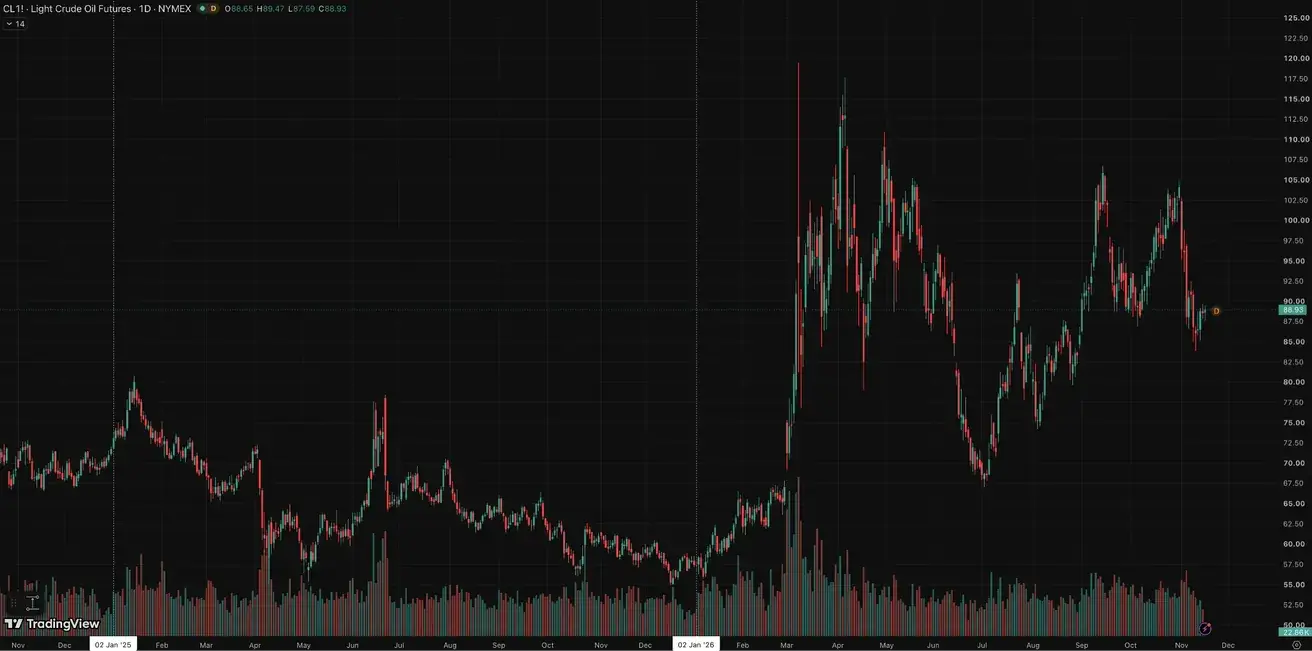
Oil Futures
Weekly performance: -2.50% (week close: $88.56 per barrel); year-to-date: +54.26%
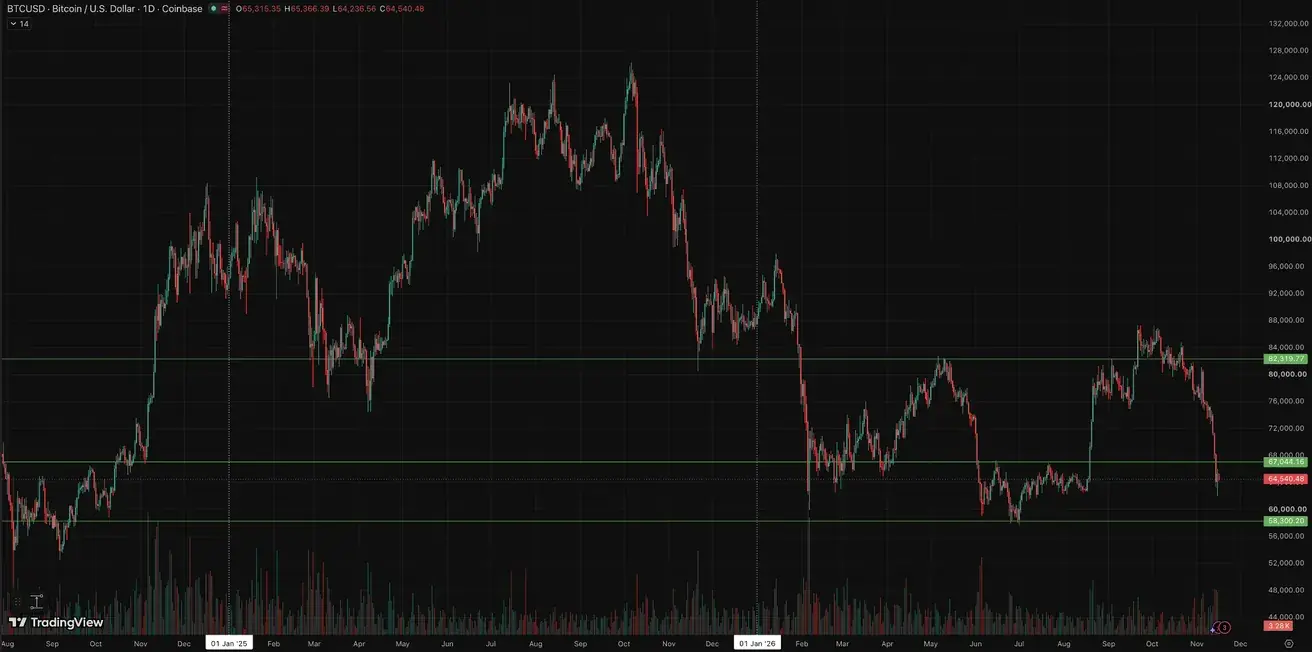
Cryptocurrencies
BTC Futures
Weekly performance: -12.63% (week close: $65,315.35); year-to-date: -25.54%.
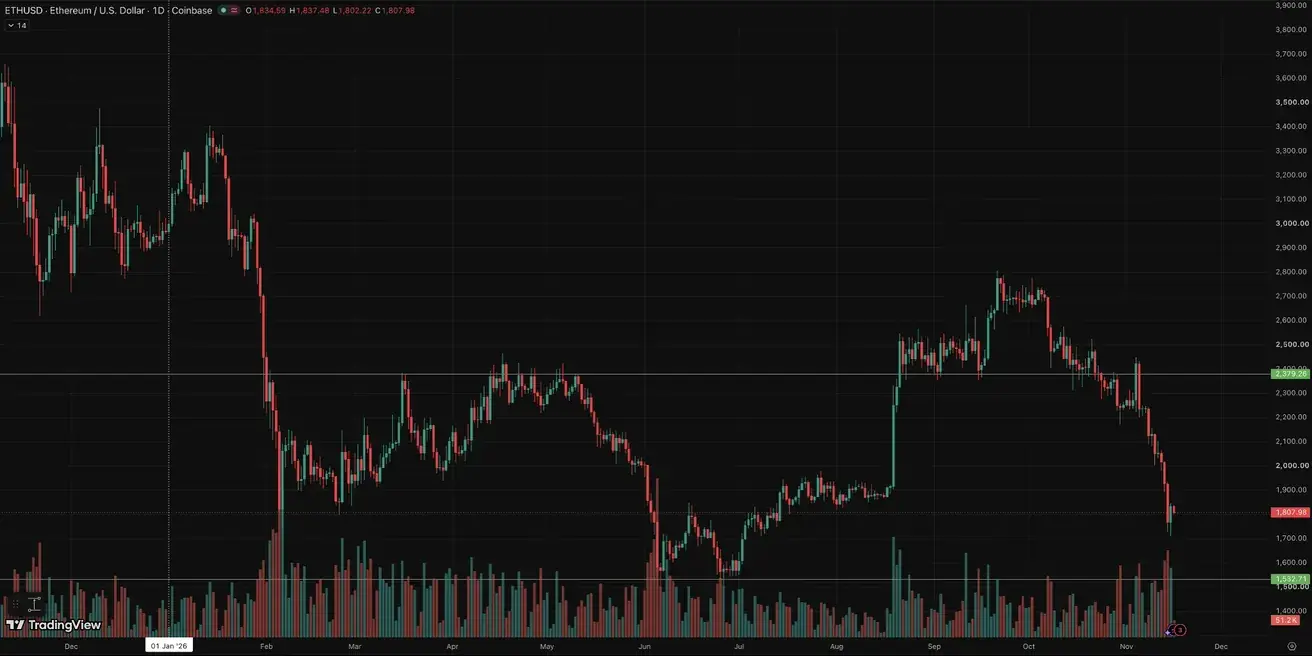
ETH Futures
Weekly performance: -13.68% (week close: $1,834.54); year-to-date: -38.31%.
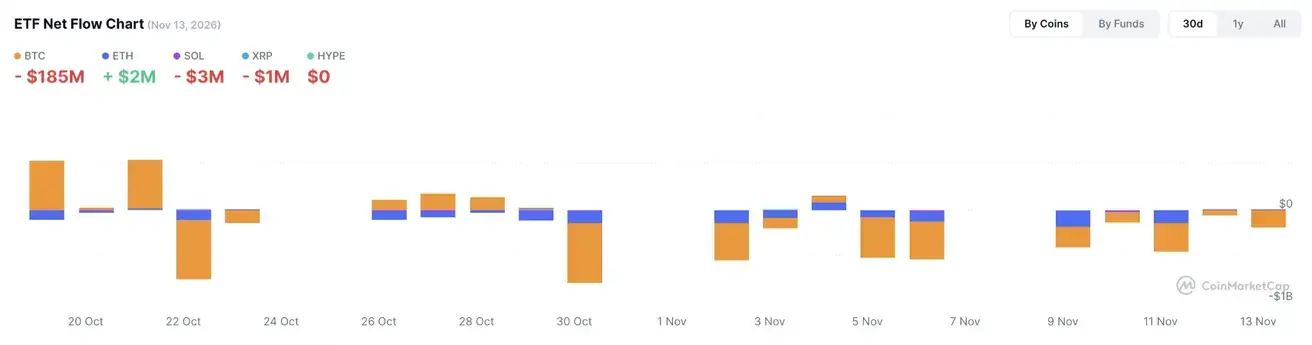
ETF Net Flows