 Lietuvių
 Русский
 Қазақша
 Eesti
EestiOctober 14 — 18: Weekly economic update
Key market insights

In our weekly column, we share the main macroeconomic indicators for the market with you.
MACROECONOMIC STATISTICS
INFLATION
- Core Consumer Price Index (CPI) (YoY) (Sept): 3.3%, (pre: 3.2%);
- Consumer Price Index (CPI) (YoY) (Sept): 2.4%, (pre: 2.5%).
THE FED'S INFLATION TARGET
- Core price index of personal consumption expenditure PCE (YoY) (Aug): 2.7% (pre: 2.6%);
- The price index of personal consumption expenditures (YoY) (July): 2.2%, (pre: 2.5%).
INFLATION EXPECTATIONS
-
12-month expected inflation (Sept): 2.9%, pre: 2.7%;
-
5-year expected inflation (Sept): 3.0% pre: 3.1%.
-
BEA (U.S. Bureau of Economic Analysis) GDP: (q/q) (2nd Quarter) (Third Estimate): 3.0% (prev: revised 1.6%), GDP Deflator (q/q) (3rd Quarter): 2.5% (prev: revised 3.0%).
-
GDP (Bank of Atlanta): The short-term GDP forecast was raised to 3.4% from the previous estimate of 3.2%.
-
Retail Sales (USA) (September): month-over-month (m/m): 0.4% (prev: 0.1%), core Retail Sales (m/m): 0.5% (prev: 0.2%)
BUSINESS ACTIVITY INDEX (PMI)
- Services sector (June): 55.4 (pre: 55.7);
- Manufacturing sector (September): 47.0 (pre: 47.9 revision);
- S&P Global Composite (September): 54.4 (pre: 54.6 revision).
Empire State Manufacturing Index (New York):
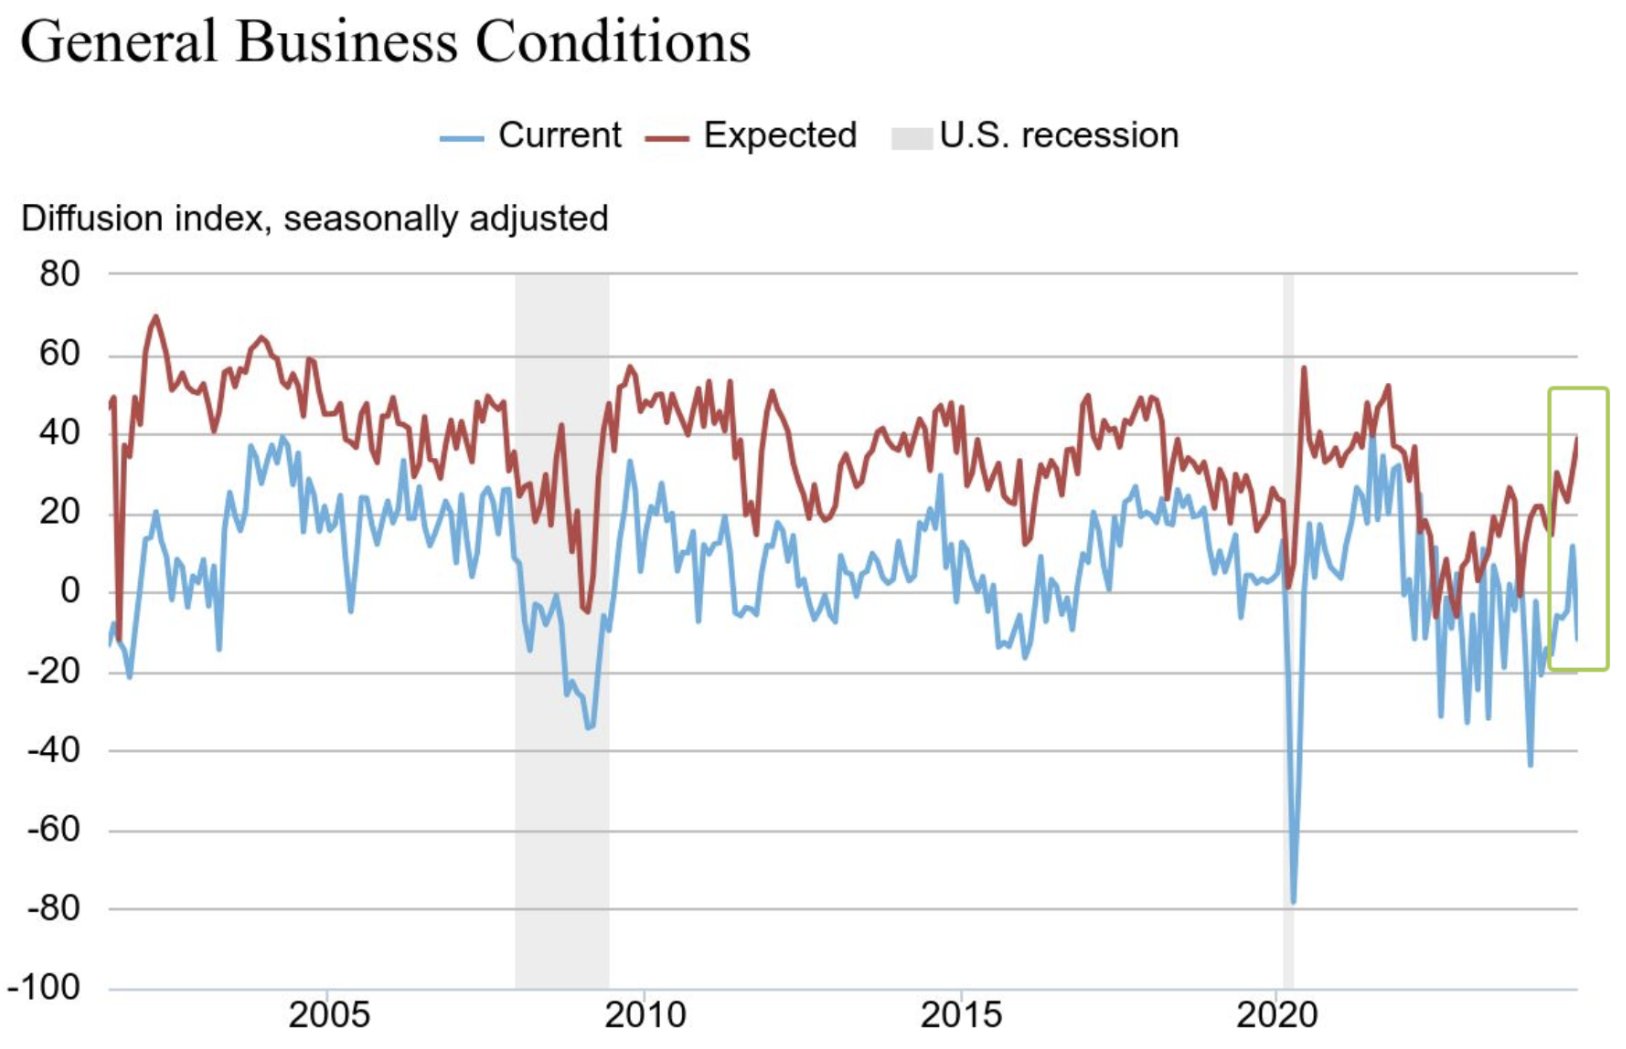
The Empire State Manufacturing Index evaluates the relative level of business conditions in New York State. A level above zero indicates an improvement in conditions, below is an indication of deteriorating conditions. The graph shows the correlation between the real values (blue line and expectations).
After entering positive territory last month, the main index of general business conditions fell back by twenty-three points to a negative value of -11.9. New orders fell and current shipments also declined.
LABOR MARKET
- Unemployment rate (August): 4.1% (pre: 4.2%);
- Non-farm Payrolls (August): 254K (pre: 159K revision);
- Change in nonfarm private sector employment (August): 223K, (pre 114K revision);
- Average hourly earnings (August, YoY): 4.0% (pre: 3.9%).
MONETARY POLICY
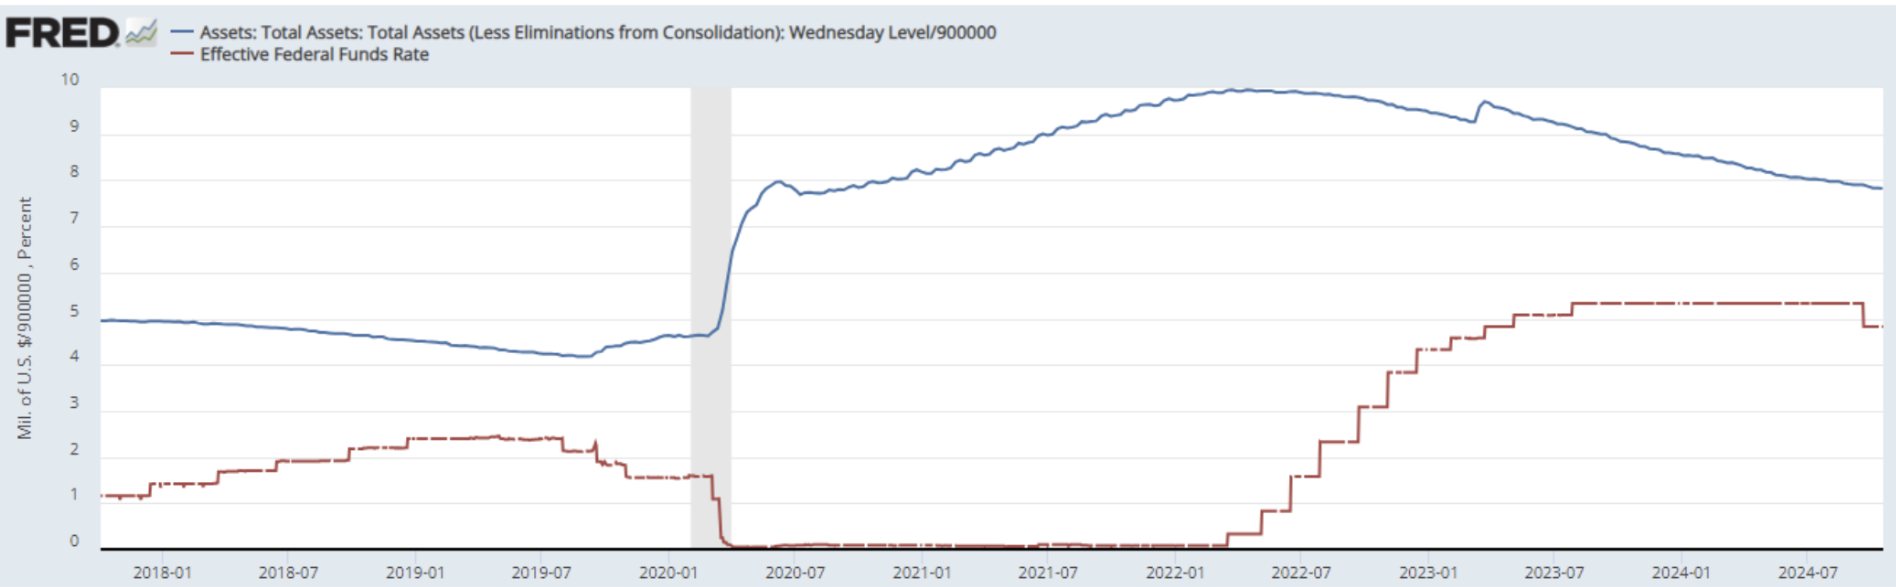
- Federal Funds Rate (EFFR): 4.75% – 5.00% (in red);
- Fed Balance Sheet (in blue): $7.039 trillion (vs last week: $7.046 trillion):
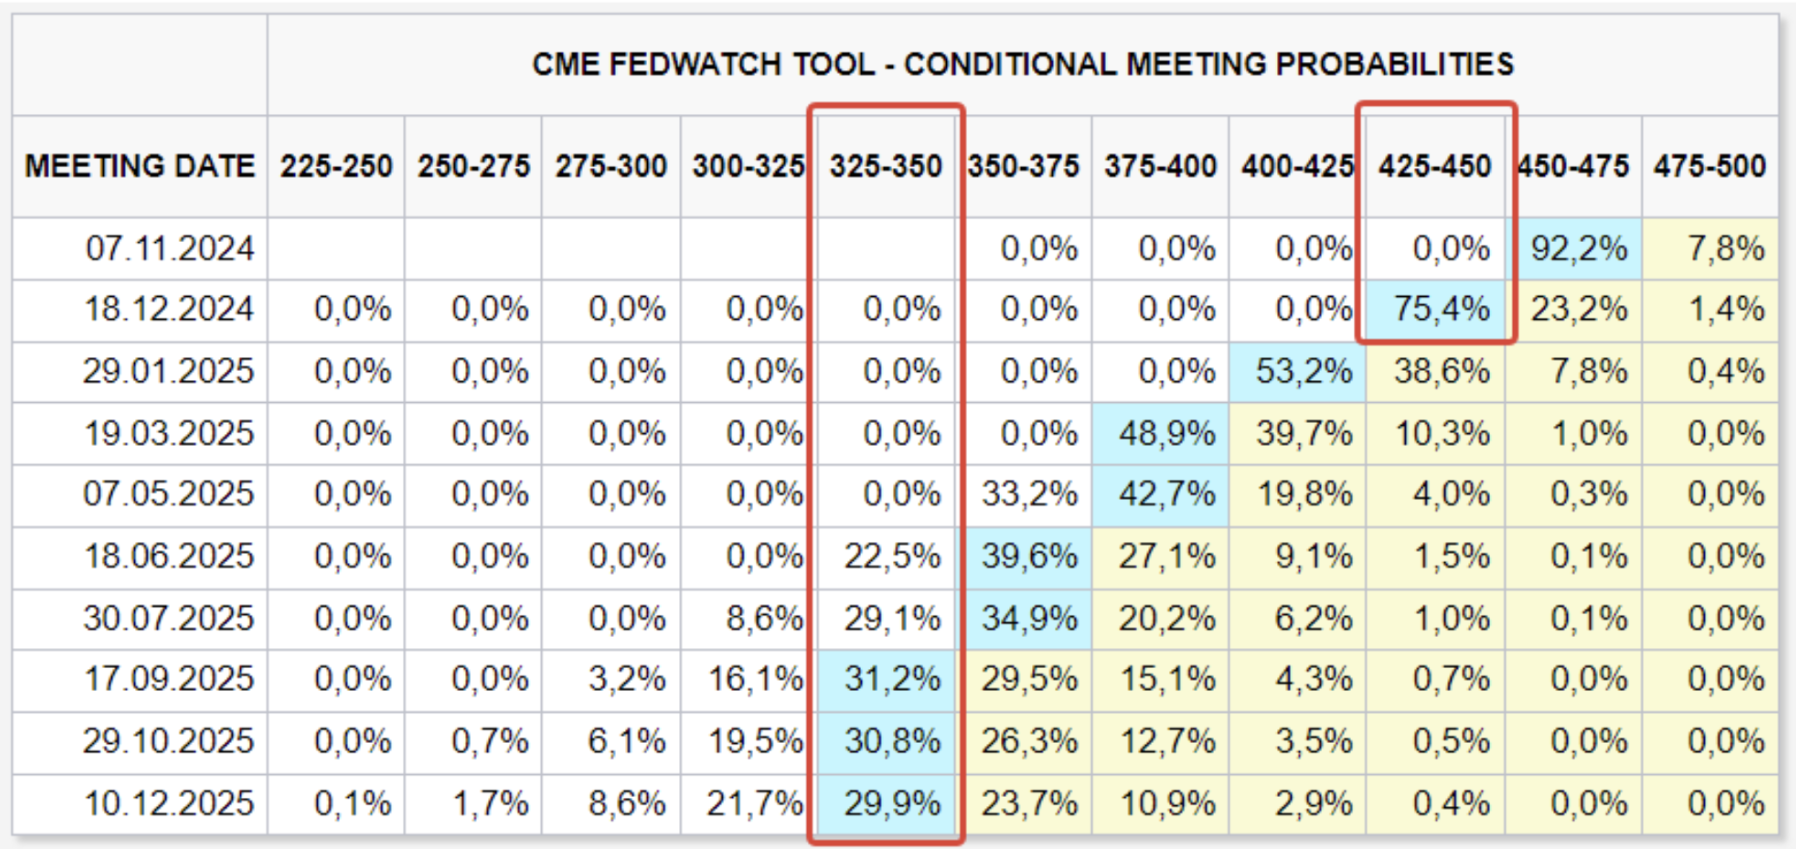
MARKET FORECAST FOR RATE
Today:
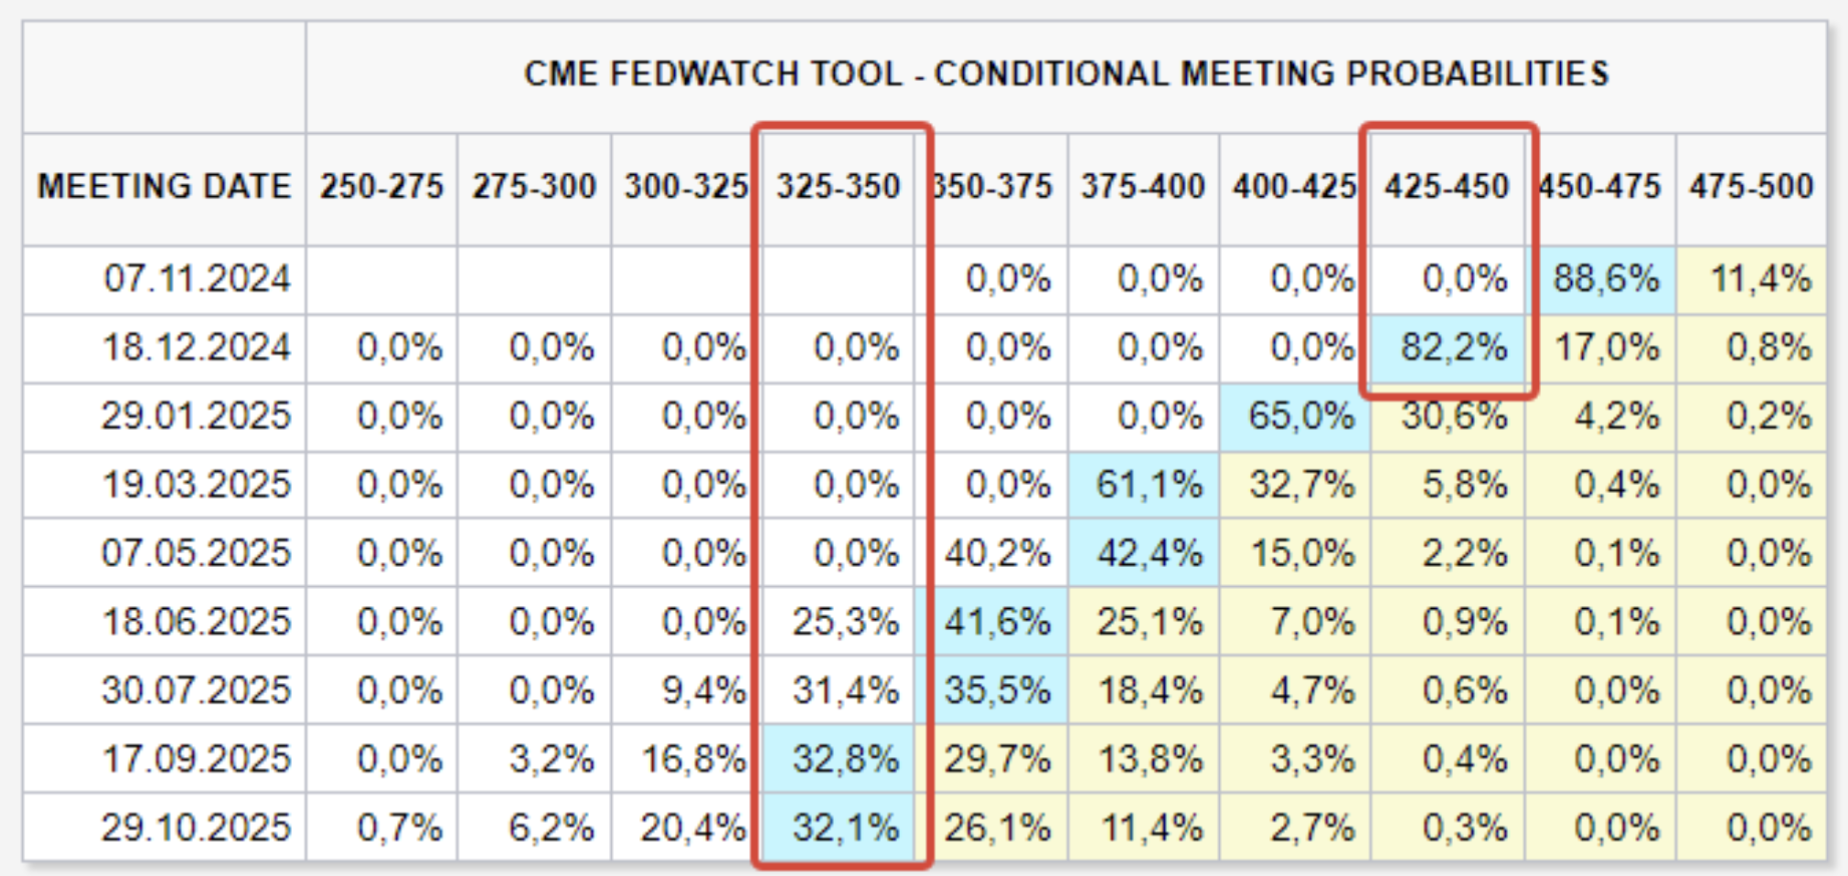
A week earlier:
Fed Rhetoric: Minneapolis Federal Reserve Bank President Neel Kashkari stated that a "further moderate reduction" in the central bank's base interest rate is likely in the coming quarters.
FedWatch Expectations: Unchanged, with two rate cuts expected by year-end to a range of 4.25%-4.50%. Long-term expectations (12 months) anticipate a 1.50% reduction, bringing the rate down to 3.25%-3.50%.
MARKET
MARKET CAP PERFORMANCE
The stock market:
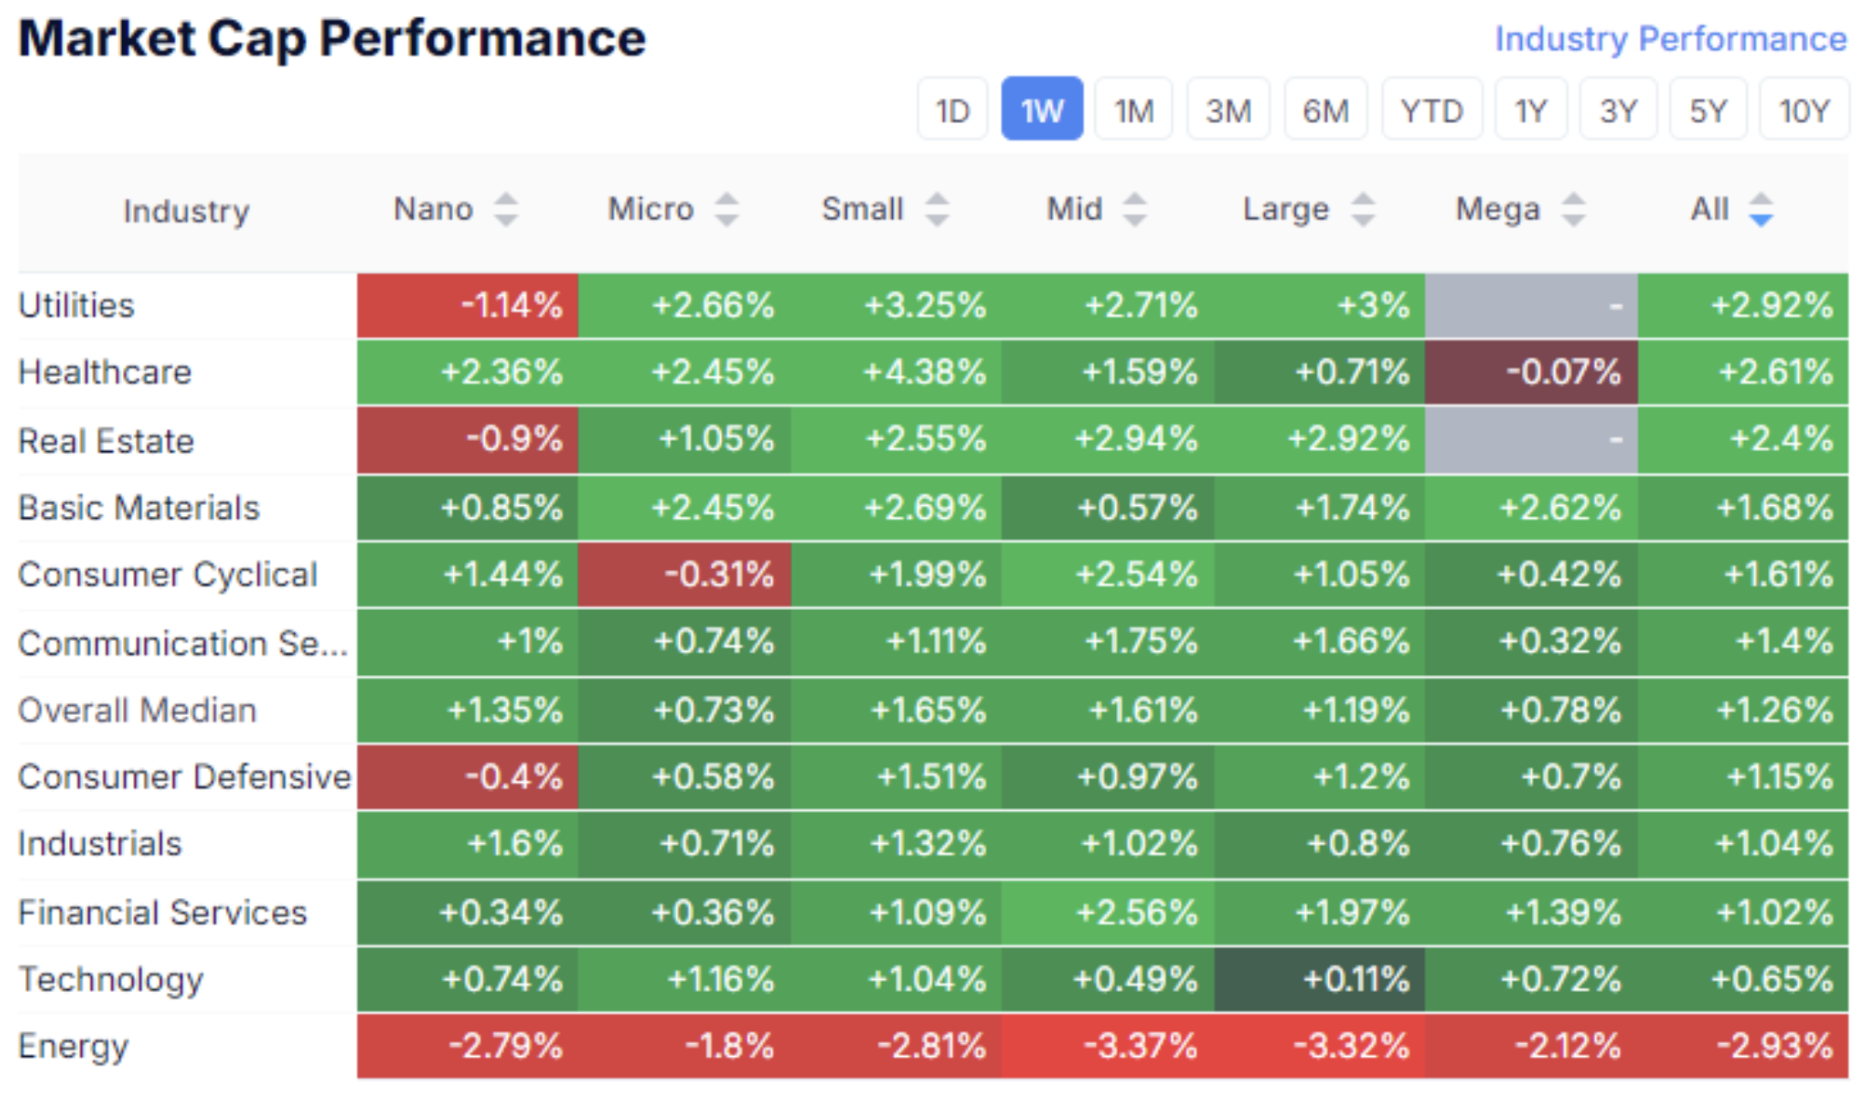
Last week, the US stock market showed mostly positive dynamics. The median growth of the stock market was 1.26%. Demand was observed for almost all asset classes, with the exception of the energy sector. The increased Risk ON persists.
Technological market:
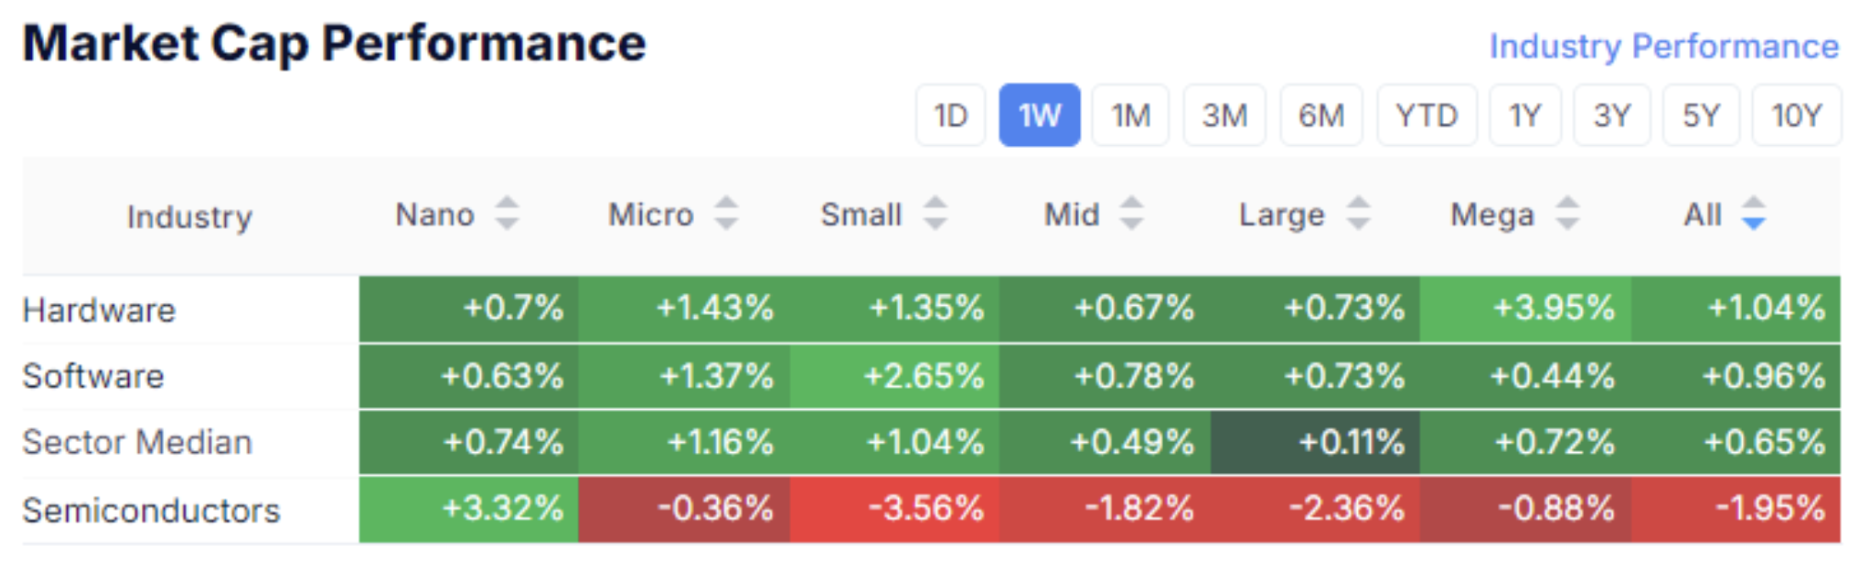
The technological sector saw demand in software and hardware, while semiconductor assets experienced an outflow.
IGV/BAT
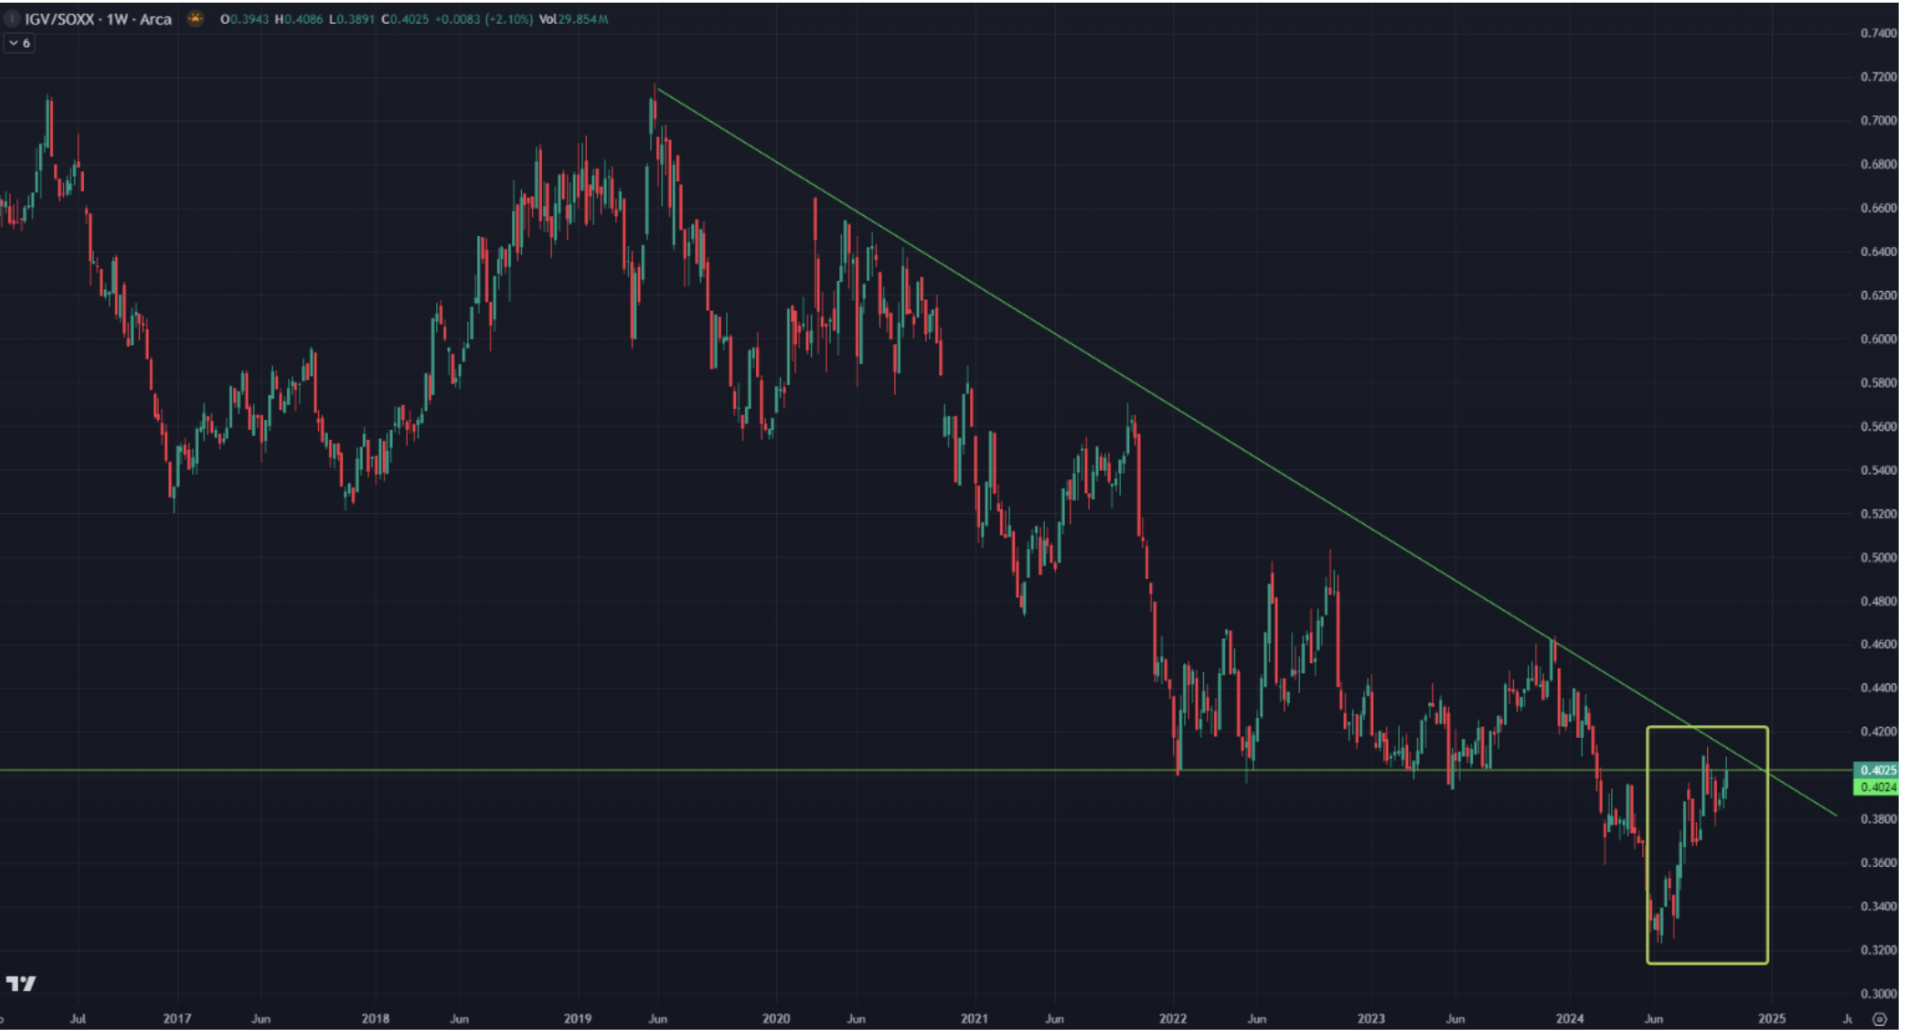
The ratio of the IGV Fund ETF (tracks software companies) and the SOXX Fund ETF (tracks semiconductor companies).
This multiplier has been decreasing for 5 years since 2019, indicating greater demand for semiconductors. But since July of this year, the trend has turned around and the multiplier is testing the 2-year resistance level for the second time.
This indicates the rotation of assets from the hyped (overbought) semiconductor sector to the software developer sector, despite the fact that NVDA showed a historical maximum last week.
SP500
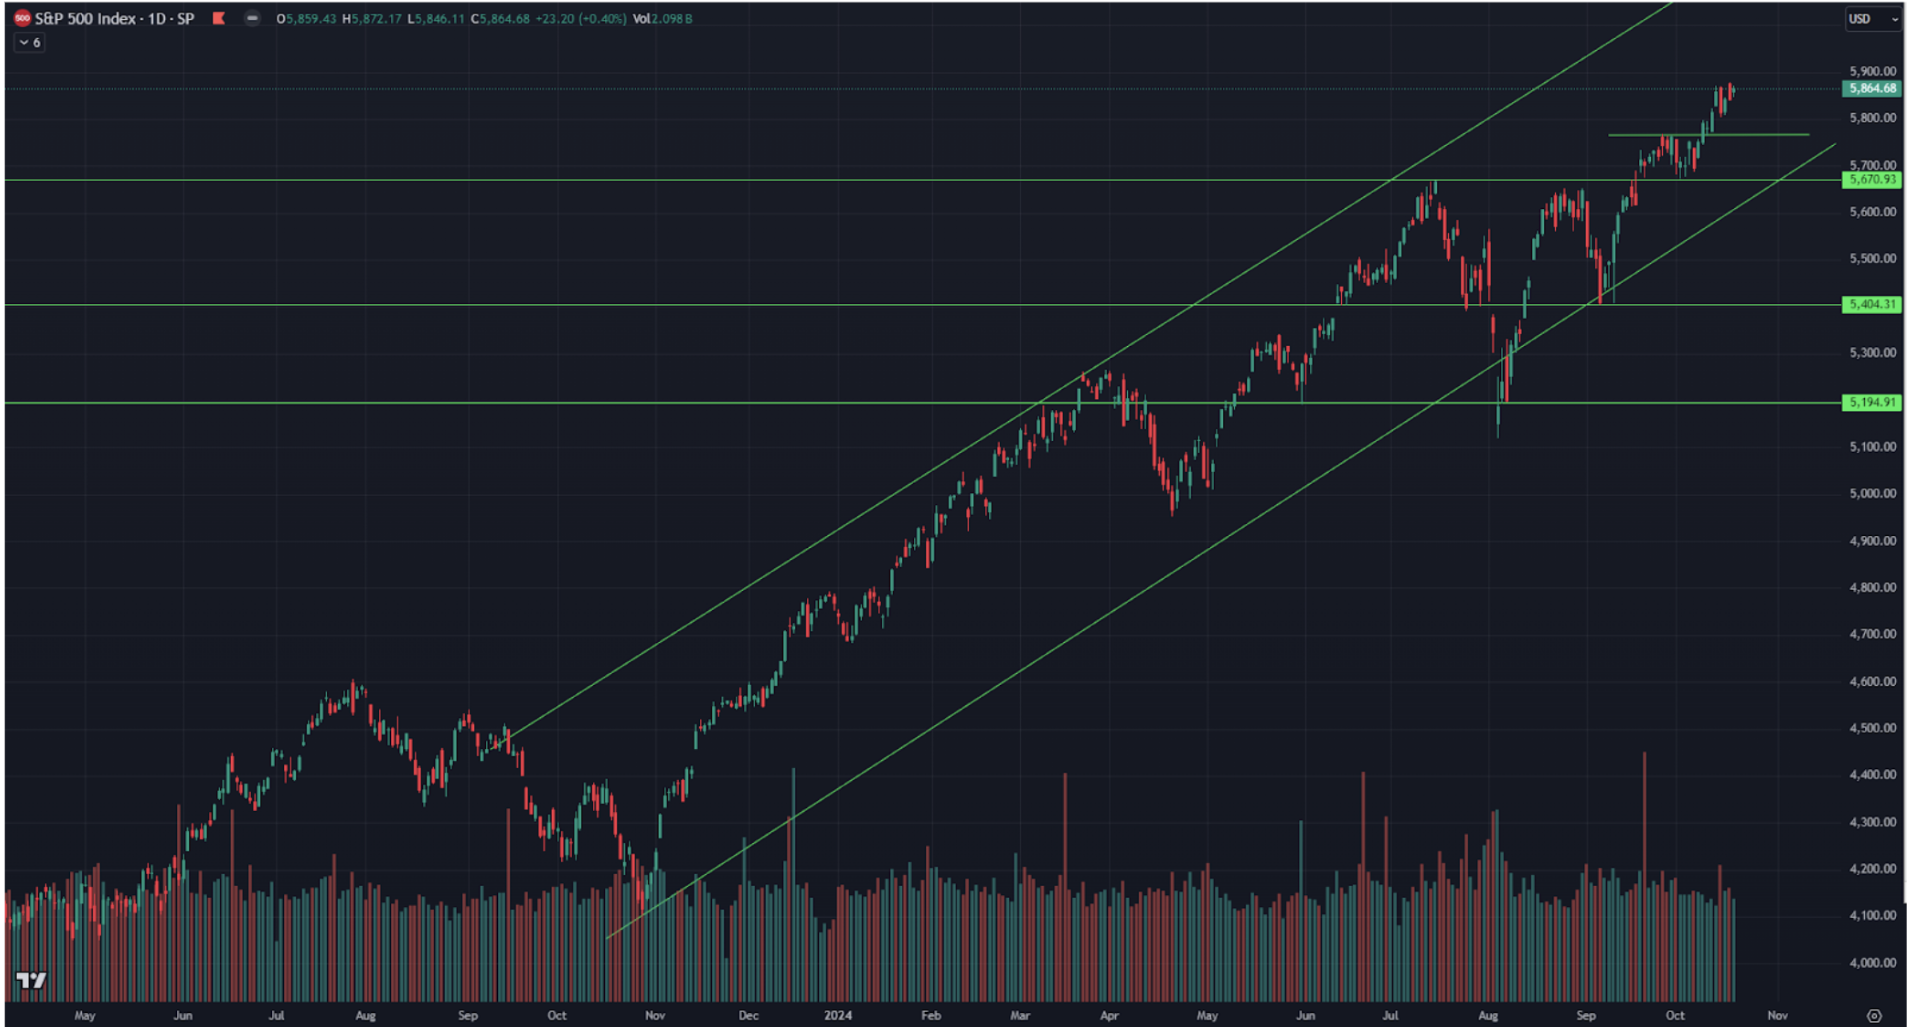
VIX
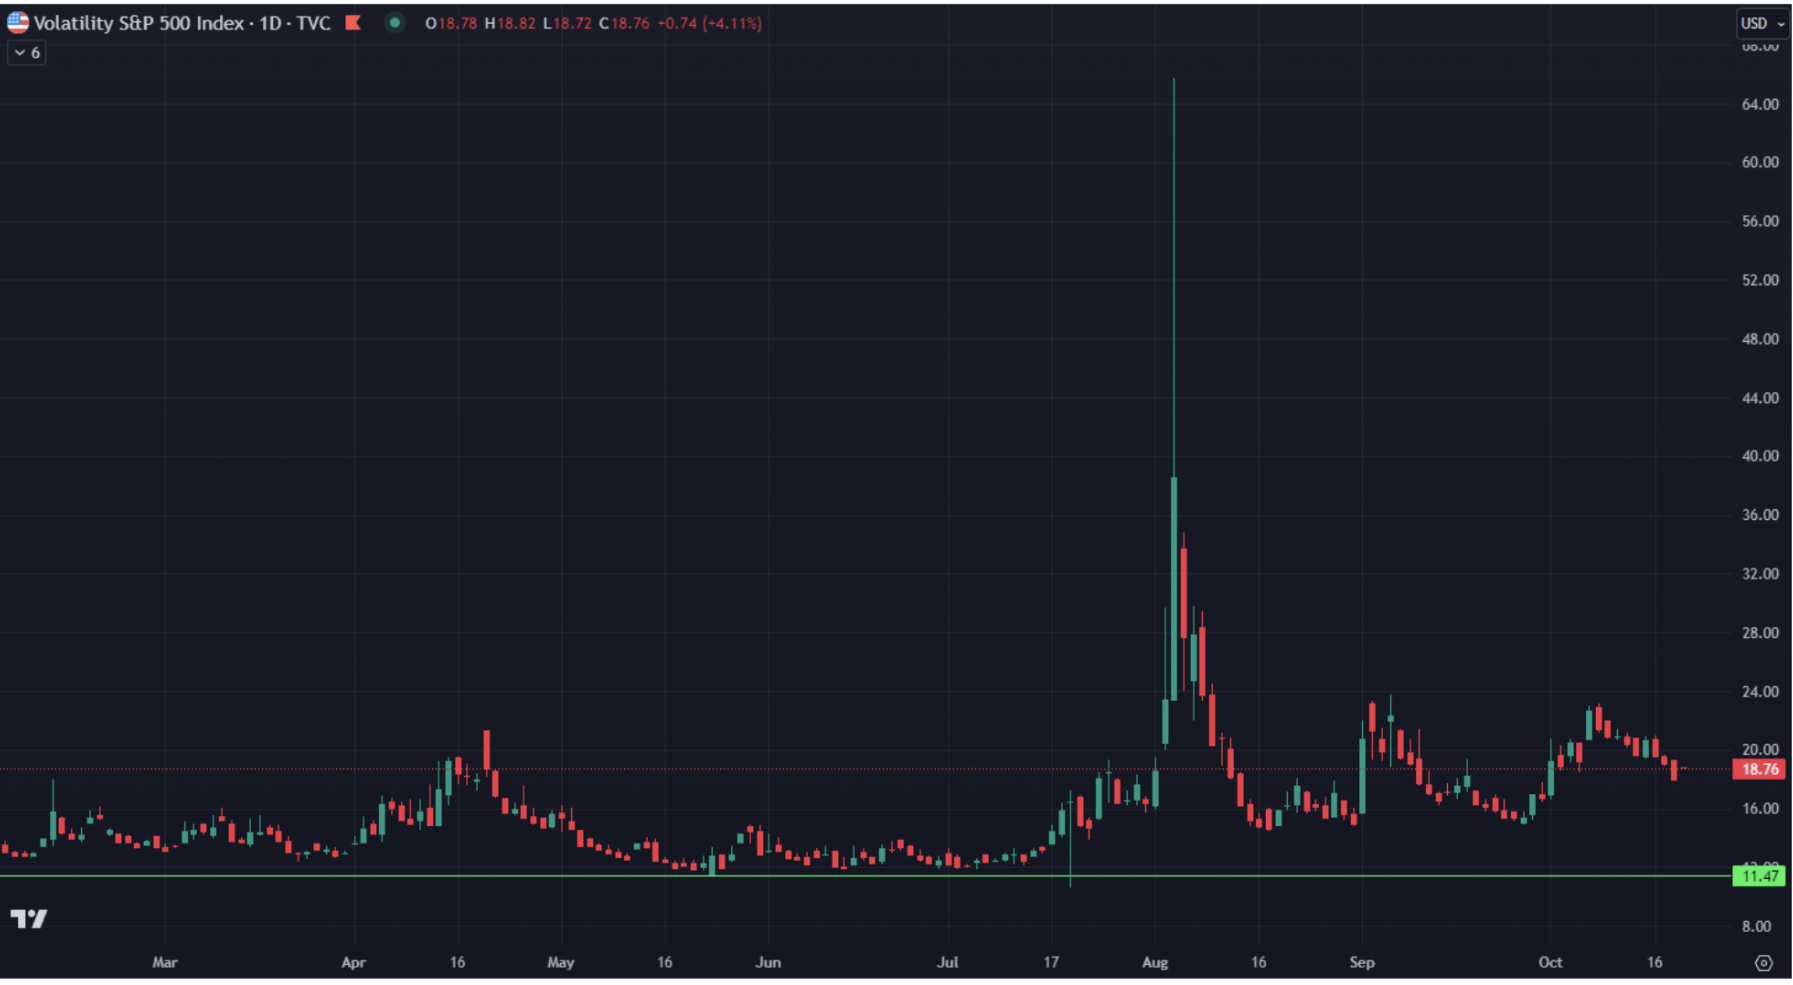
The SP500 index hit a new historical high of 5878, growing 0.85% for the week. The volatility index VIX gradually declined to 18.75.
Forecasts
UBS Global Research raised its S&P 500 target for the end of 2025 from 6000 to 6400. The main thesis is that lower interest rates will reduce corporate borrowing costs and default risks, increasing both the average earnings per share and stock valuations. Financial conditions point to reduced stress and increased liquidity, which should positively impact valuations.
However, Goldman Sachs' earnings per share (EPS) forecast for Q4 this year is negative:
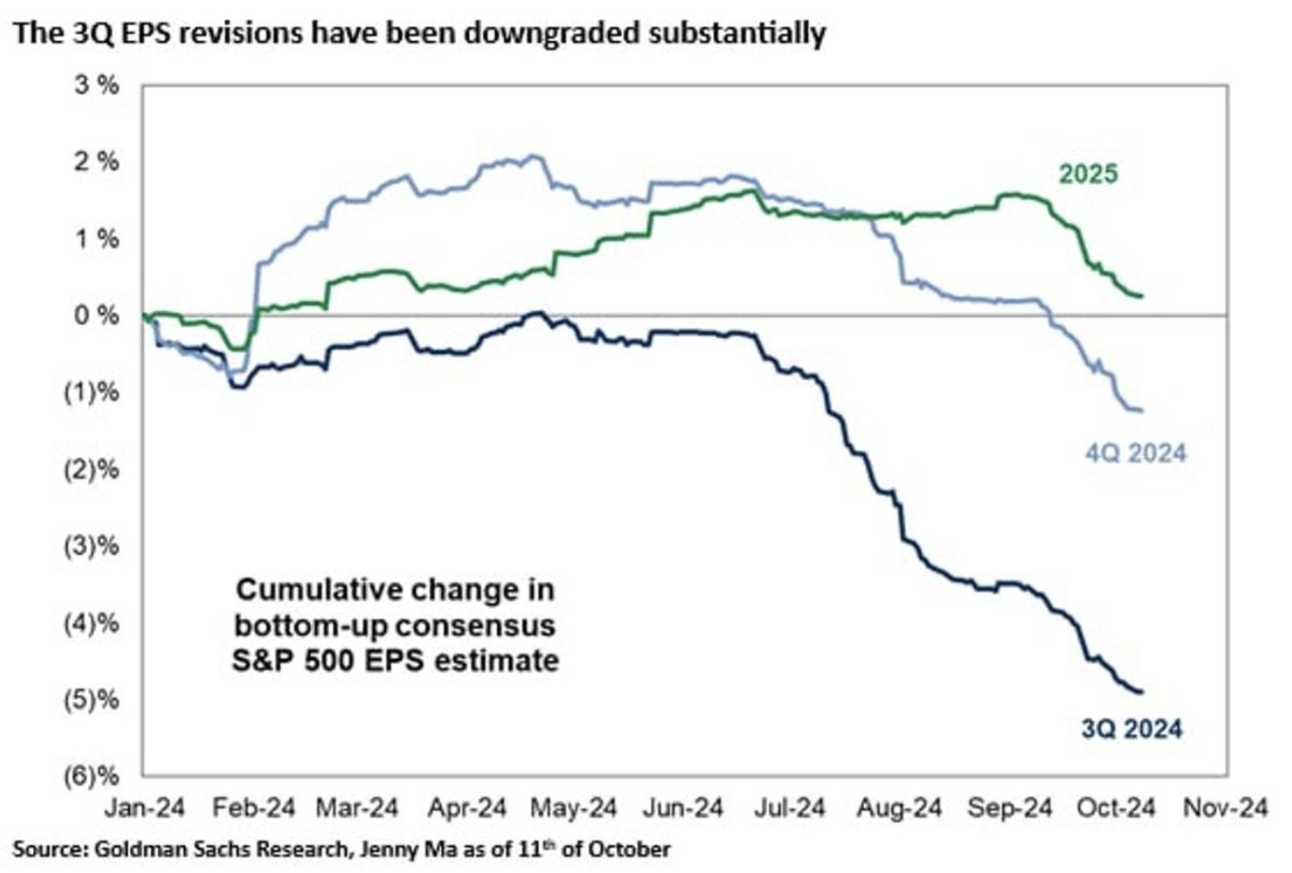
Additionally, the 2025 projections also show a downward trend, indicating a potential economic slowdown in the medium term.
TREASURY MARKET
Treasury Bonds UST10:
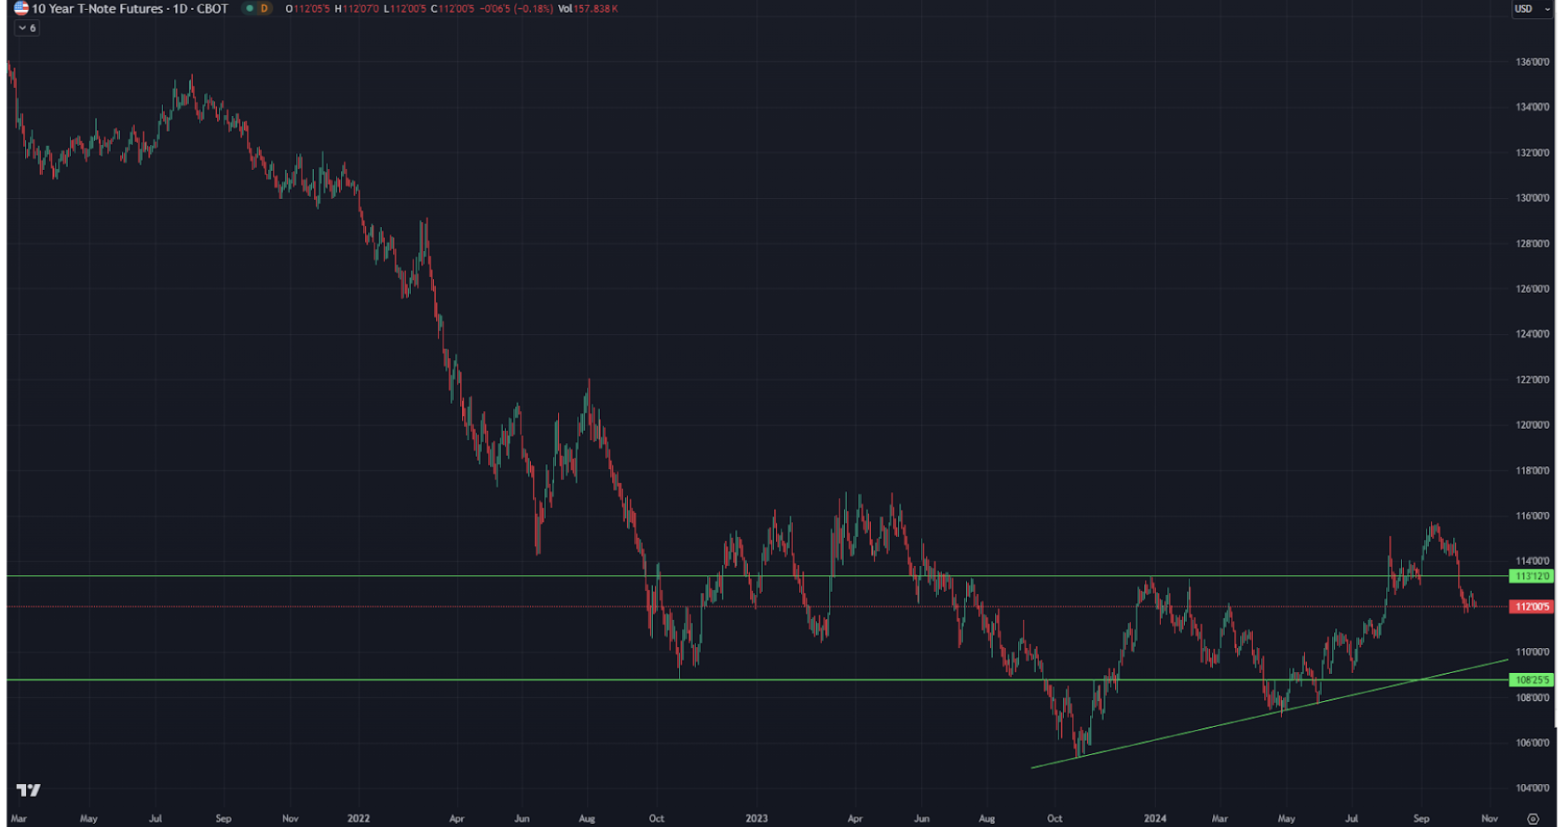
Yields
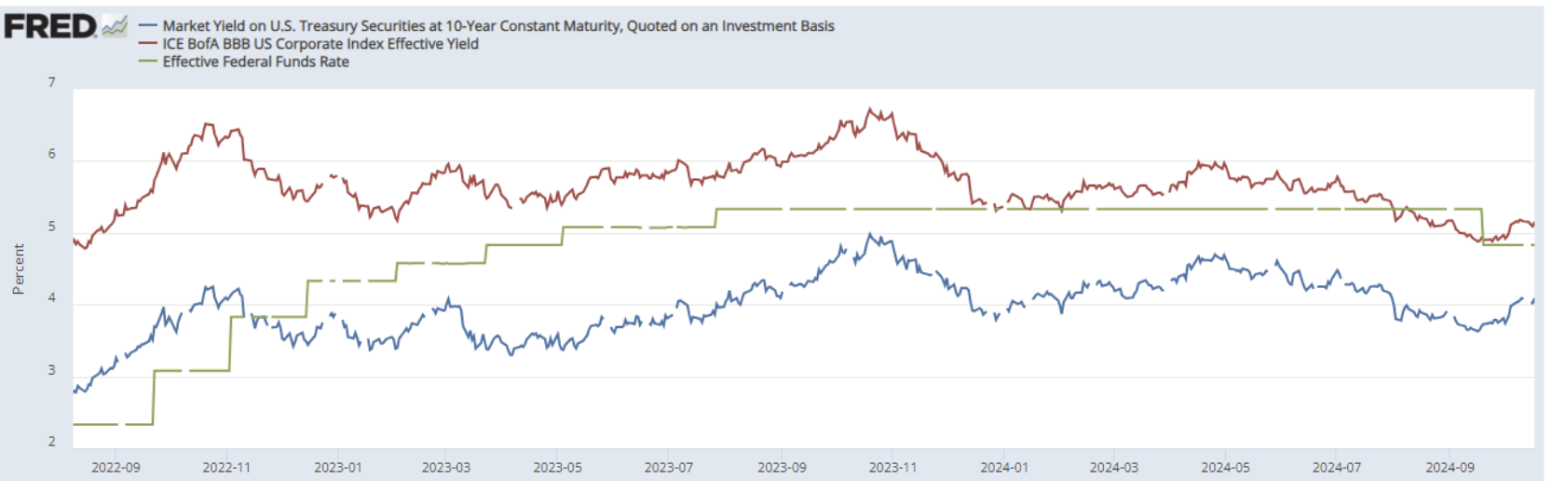
Futures for 10-year treasuries showed near-zero dynamics last week. The bond market has been in correction since mid-September, despite expectations of a 0.5% rate cut by the end of this year. The market yield (red line) was 4.09%. The yield of the BBB-rated corporate index (blue line) is 5.15%. The interest spread is 1.06%.
GOLD
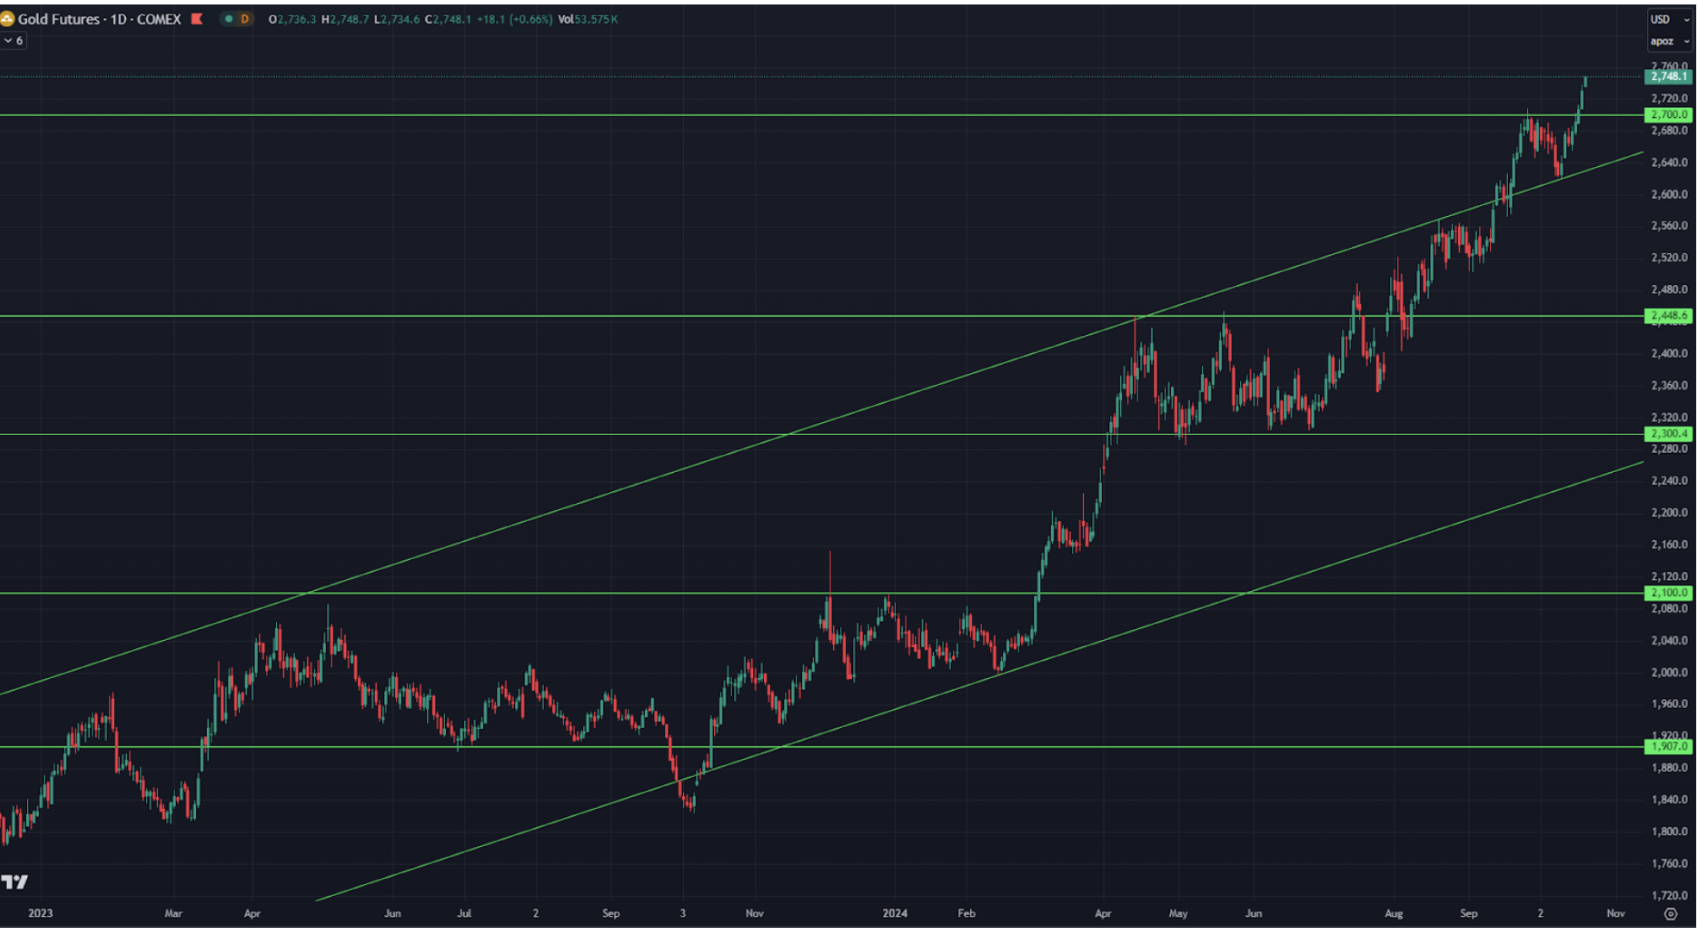
The gold market is experiencing a record rally. Futures for the yellow metal today cost $ 2,749/tr.oz. The growth since the beginning of the year was almost 33%, ahead of the SP500 index with an increase of 23.8% since the beginning of the year. Purchases by central banks continue to be key growth factors, and market concerns about inflation risks play an important role.
Global public debt growth forecast:
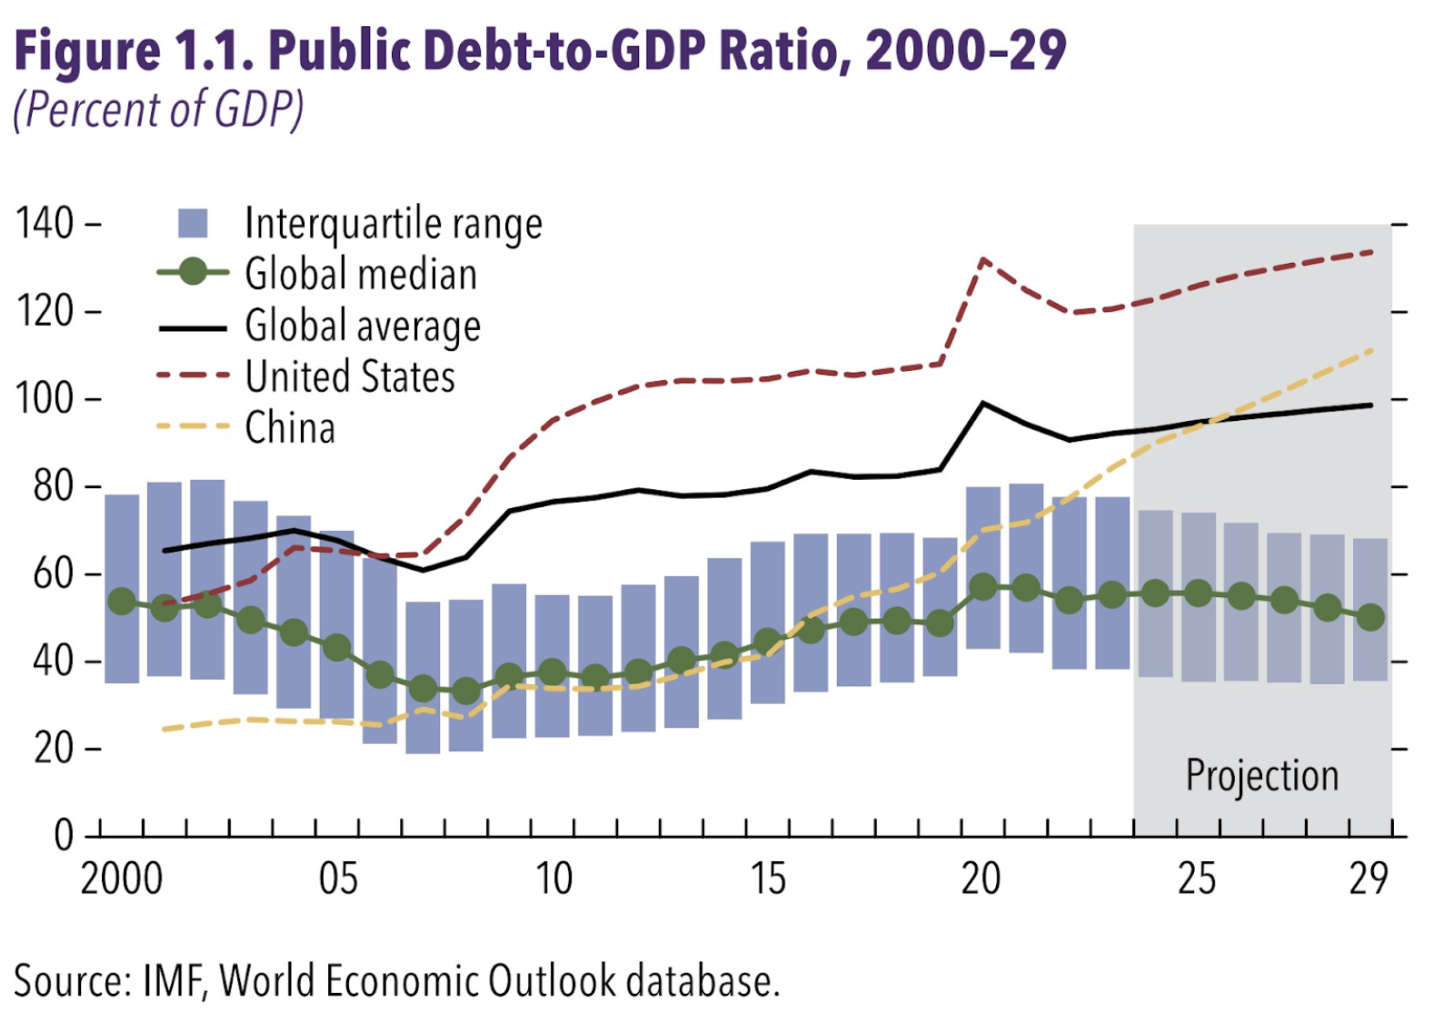
According to the forecast of the International Monetary Fund, the main issuers will be the United States and China. The national average will also continue to grow (the black line) with the forecast that debt will approach 100% of global GDP by the end of the decade. This is a long-term pro-inflation factor.
BTC
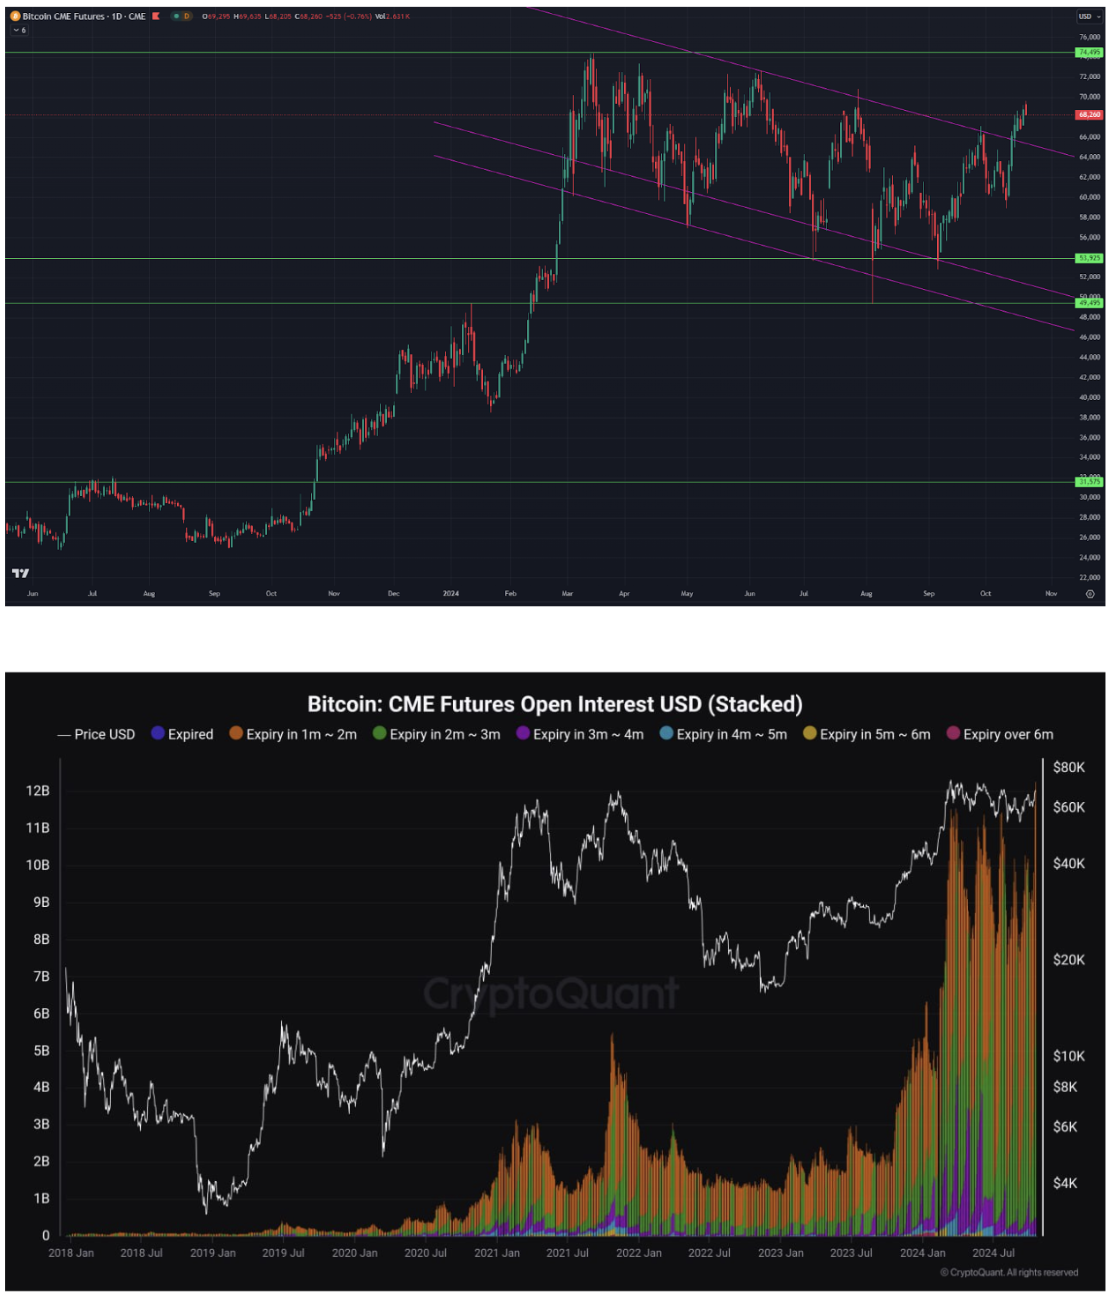
Bitcoin futures came out of an eight-month downward channel. The growth of the first cryptocurrency is likely to continue, as the Risk ON in the markets persists. The correlation of bitcoin with the SP500 index is positive with an average value of 0.8.
According to CryptoQuant, open interest in CME futures has reached its highest historical level.