Lietuvių
 Русский
 Қазақша
 Eesti
EestiOctober 20–24, 2025: Weekly economic update
Key market updates

Macroeconomic Statistics
INFLATION
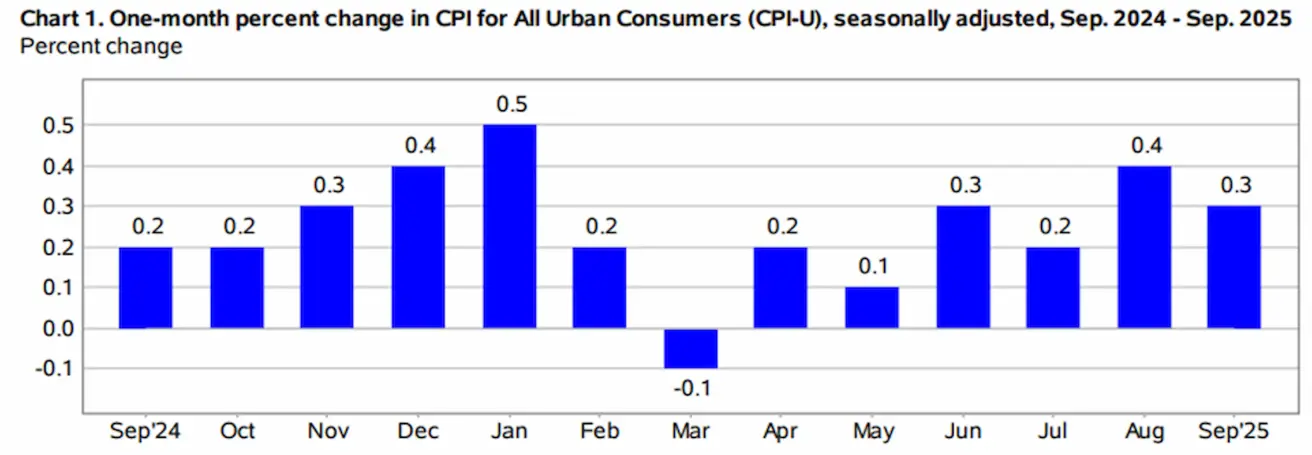
- Core Consumer Price Index (CPI) (m/m) (August): 0,2% (previous: 0.3%)
- Consumer Price Index (CPI) (m/m) (August): 0.3% (previous: 0.4%)
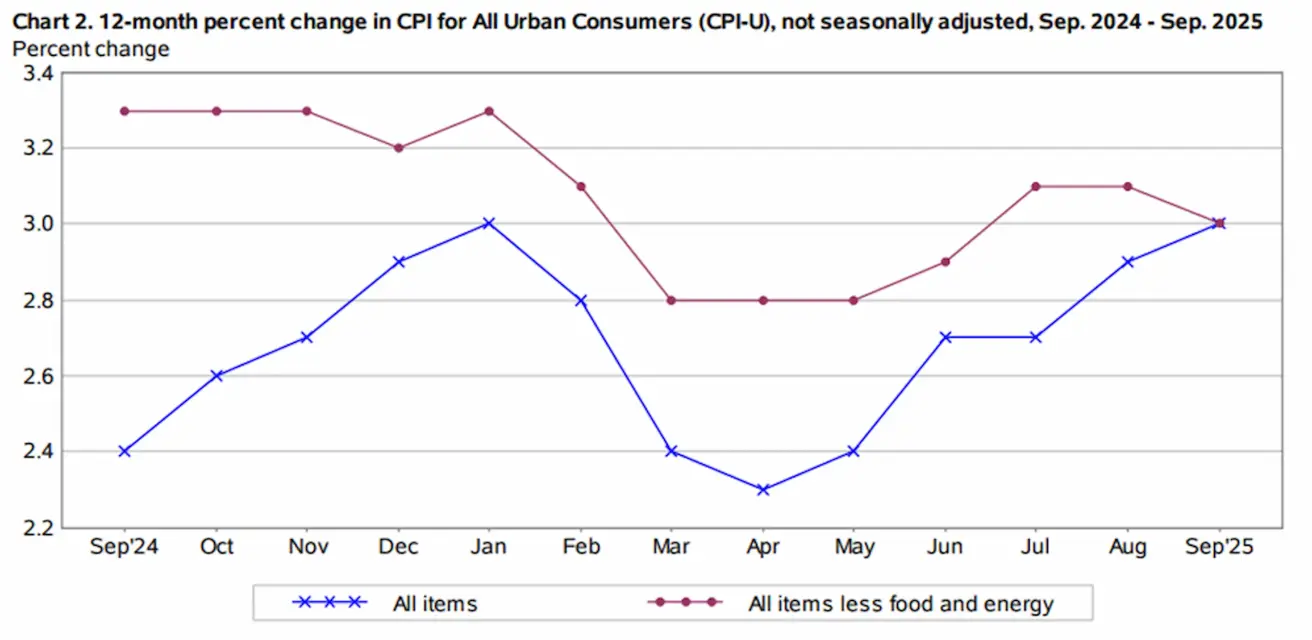
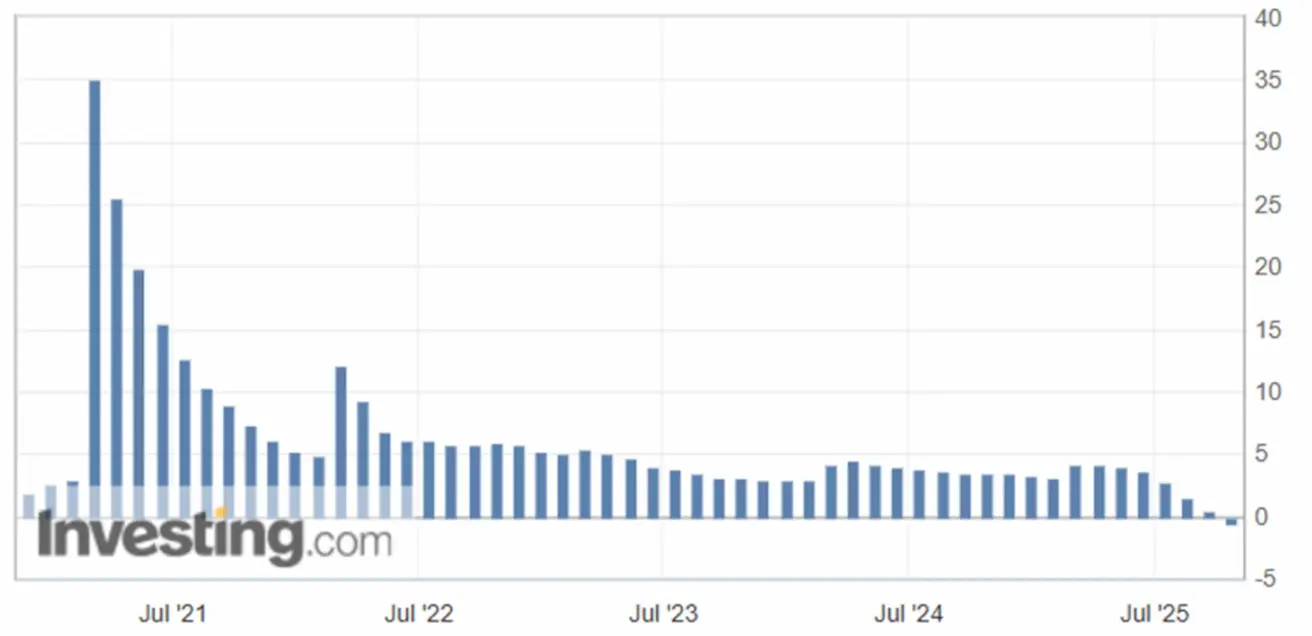
- Core Consumer Price Index (CPI) (y/y) (August): 3.0% (previous: 3.1%)
- Consumer Price Index (CPI) (y/y) (August): 3.0% (previous: 2.9%)
INFLATION EXPECTATIONS (MICHIGAN)
- 12-month expected inflation (August): 4.6% (prev: 4.7%)
- 5-year expected inflation (August): 3.9% (prev: 3.7%)
PRODUCER PRICE INDEX (PPI):
- PPI (m/m) (August): -0.1%, prev: 0.7%
- Core PPI (m/m) (August): -0.1%, prev: 0.7% GDP (U.S. Bureau of Economic Analysis, BEA) (Q2 2025, annualized, second estimate): +3.8% (advance estimate: 3.30%; Q1 2024: – 0.5%)
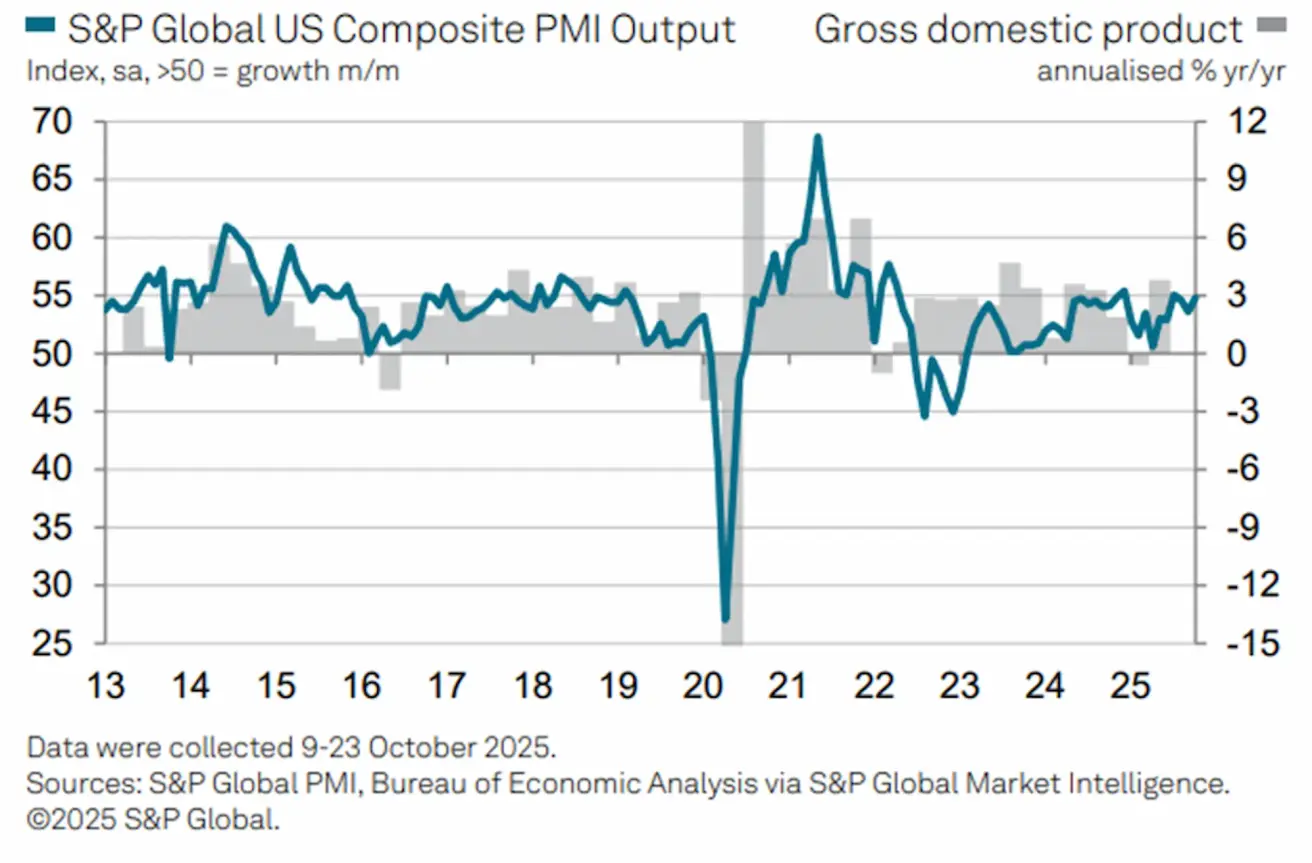
Business Activity Index (PMI):
(Above 50 indicates expansion; below 50 indicates contraction)
- Services sector (September): 55.2 (previous: 54.2)
- Manufacturing sector (September): 52.2 (previous: 52.0)
- S&P Global Composite (September): 54.8 (previous: 53.9)
LABOR MARKET:
- Unemployment rate (August): 4.3% (previous: 4.2%)
- Total number of individuals receiving unemployment benefits in the US: 1,926K (vs 1,920K).
- Change in nonfarm payrolls (August): 22K (previously revised: 79K)
- Change in U.S. private nonfarm payrolls (August): 38K (previous: 77K)
- Average hourly earnings (August, y/y): 3.7% (previous: 3.9%)
- JOLTS job openings (August): 7.227M (vs. 7.181M)
- ADP Nonfarm Employment Change (Sep): -32K (vs -3K)
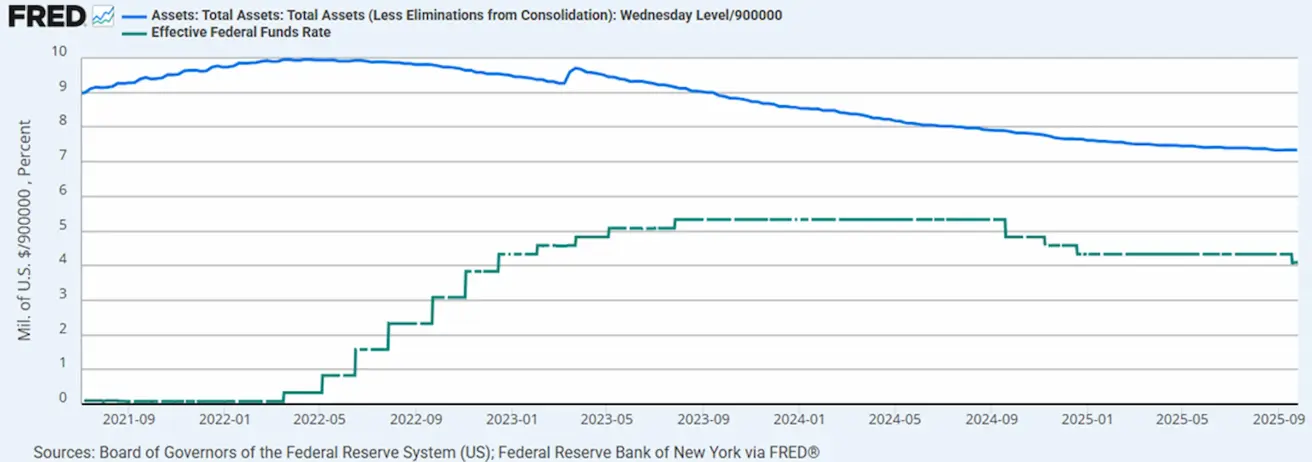
MONETARY POLICY
- Federal Funds Effective Rate (EFFR): 4.00% - 4.25%
- Federal Reserve balance sheet increased: $6,589T (vs. previous week: $6,596T)
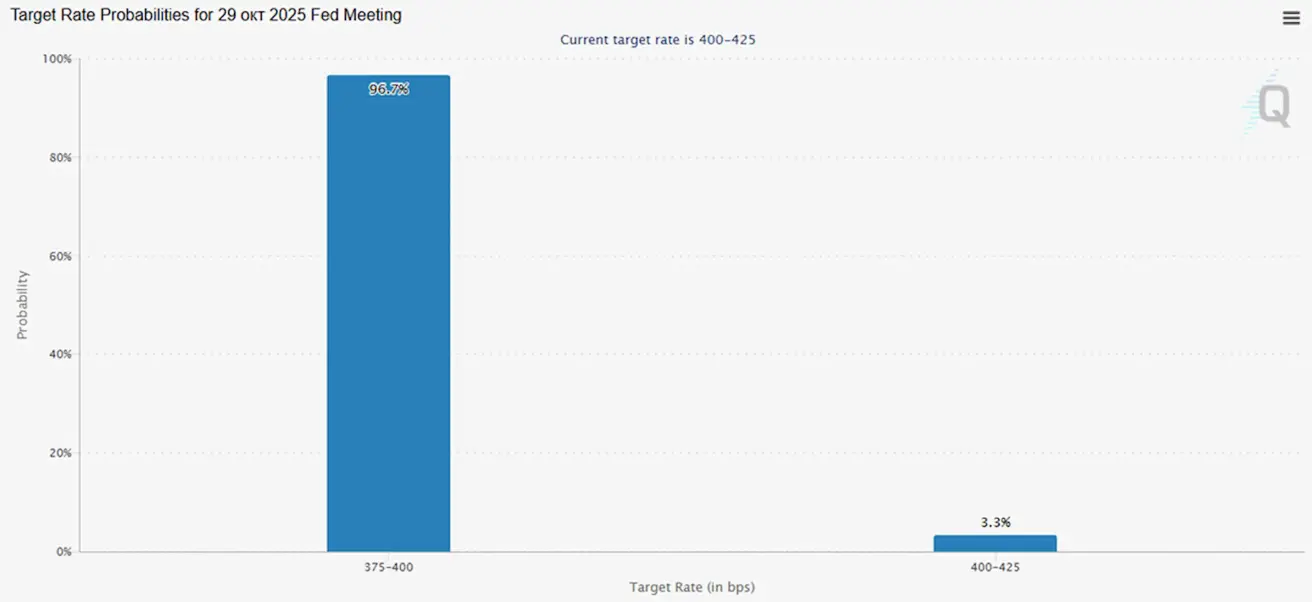
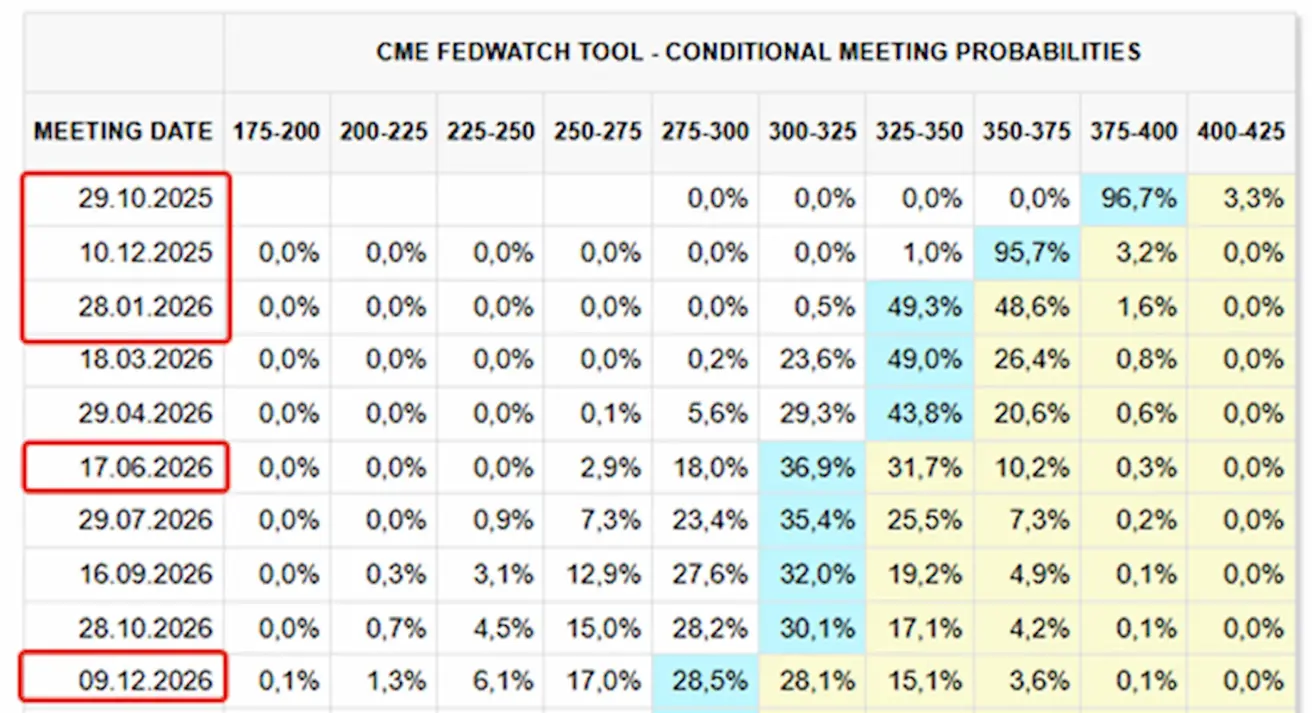
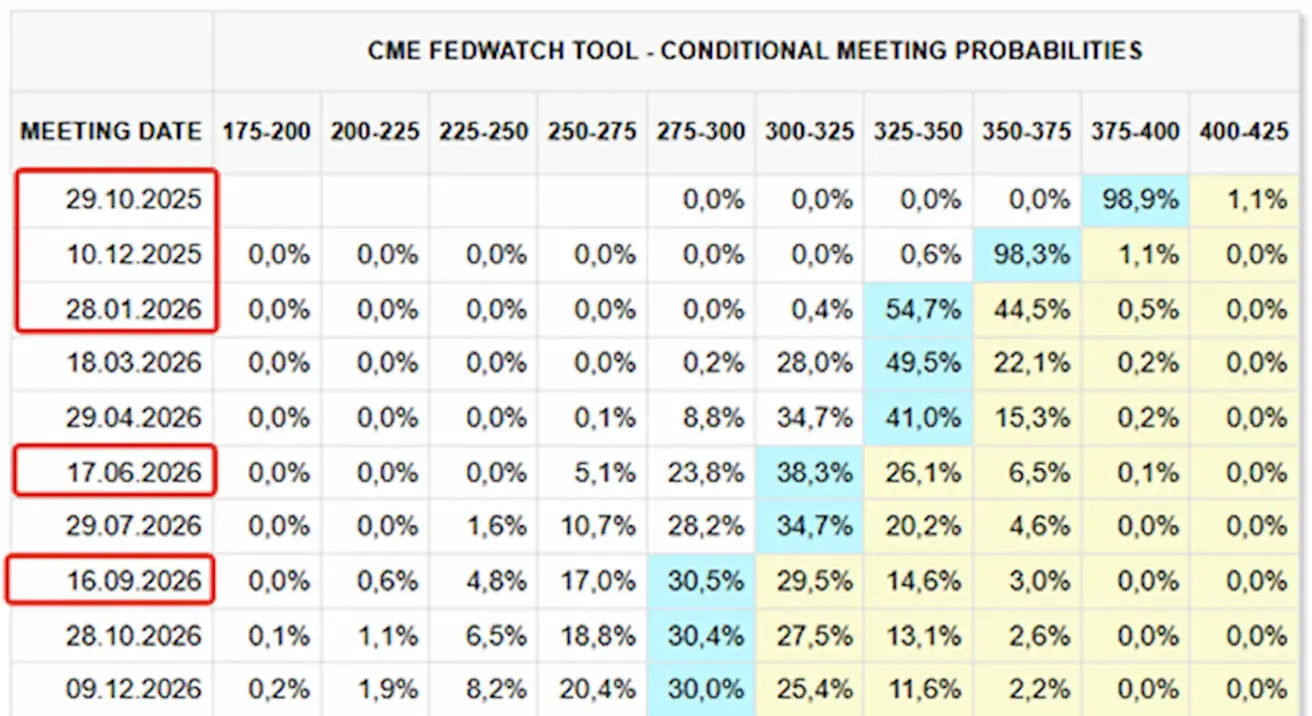
MARKET FORECAST FOR RATE (FEDWATCH)
Expectations for the upcoming FOMC meeting on October 29:
Today
А week earlier:
Commentary
Last week, equity markets stayed firmly in risk-on mode. Inflation prints undershot forecasts and were received positively, especially alongside improving business-activity gauges.
A Trump–Xi meeting is expected in South Korea on Thursday, bolstering optimism after constructive talks over the weekend. Senior trade officials from the U.S. and China said they had reached agreements on several contentious issues, paving the way for Presidents Trump and Xi to finalize a deal and de-escalate trade tensions.
Scott Bessent remarked that the threat of 100% tariffs on Chinese goods has been “effectively taken off the table.”
CPI rose 0.3% m/m. On a y/y basis, both headline CPI and core CPI increased 3.0%. Inflation expectations eased 0.1pp to 4.6% over the next 12 months, but rose 0.2pp to 3.9% on a five-year horizon.
Preliminary PMI data for October point to solid and resilient economic growth at the start of the fourth quarter, with business activity gaining momentum in both manufacturing and services, despite some reports that firms were affected by the government shutdown.
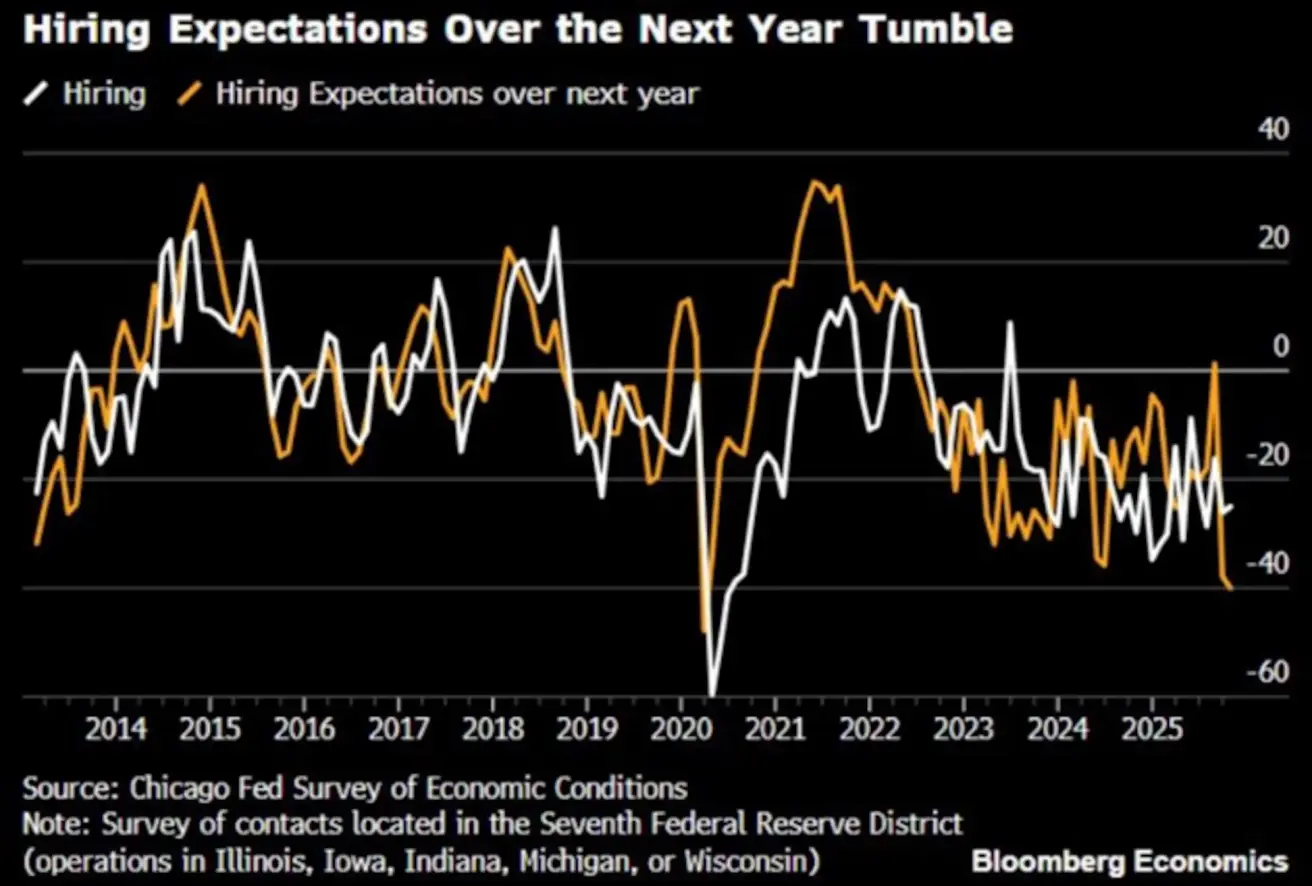
However, business confidence in the outlook for the coming year deteriorated further, remaining near three-year lows, as companies express concern over policy uncertainty, particularly regarding tariffs.
The U.S. federal budget recorded a $198 billion surplus in September (compared with a $345 billion deficit in August), marking an overall swing of $543 billion.
Chicago Fed: Hiring expectations for the next year: -40% — the lowest level since the COVID year of 2020.
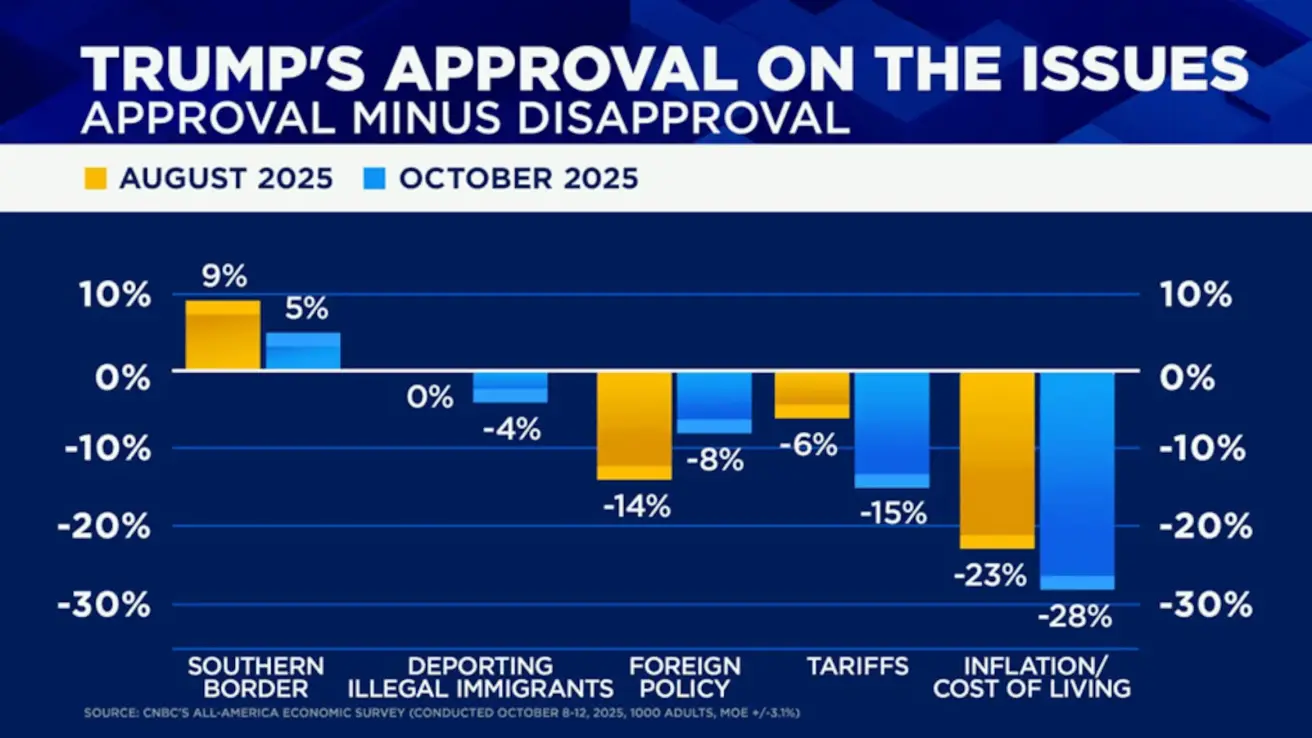
Trump’s disapproval rating amid the government shutdown (CNBC poll) rose from 43% in August to 55% in October. Key drivers: tariffs and inflation:
Market expectations (FedWatch):
- Next meeting (October 29): The implied probability of a 25 bps rate cut stands at 96.7%, and the market now anticipates two cuts in total by year-end, bringing the target range to 3.50–3.75%.
- Over the next 12 months: Markets are pricing in five 25 bps cuts, taking the rate down to a range of 2.75–3.00%.
Market
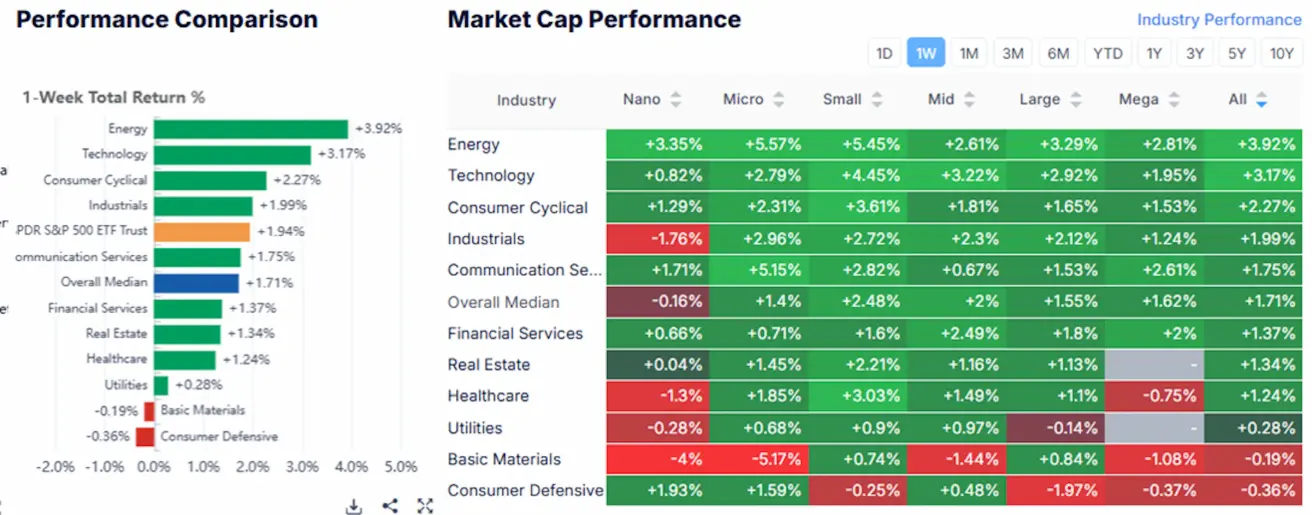
Equity Market
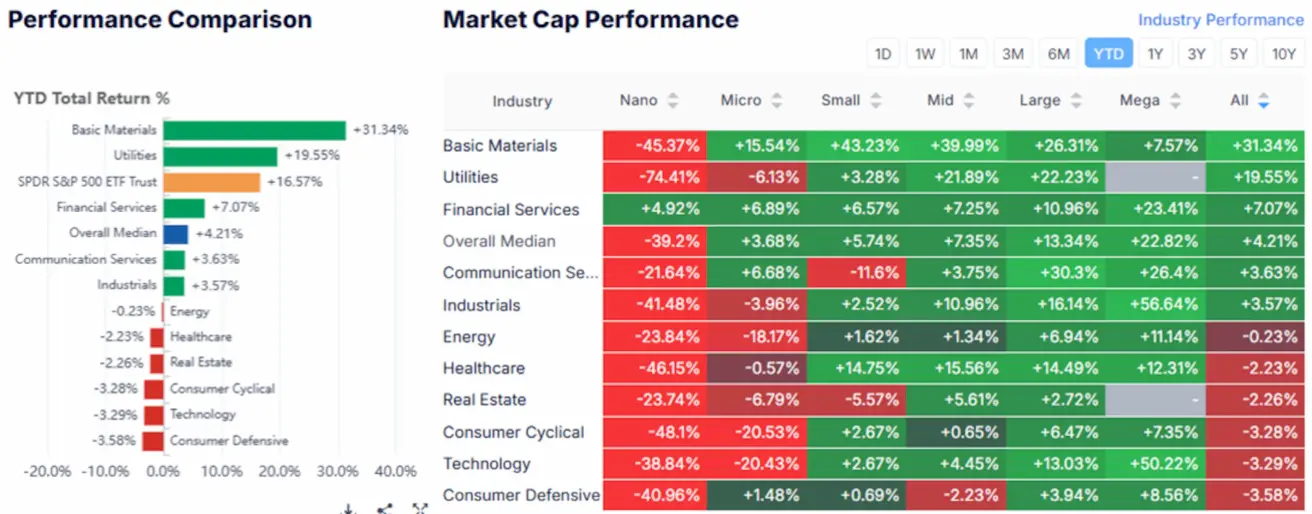
By the end of the week, the median gain stood at +1.71%. Leaders: energy, technology, and consumer cyclical sectors. Laggards: consumer defensive, basic materials, and utilities.
Year-to-Date (the period from the beginning of the year to the current date): +4.21%. Leaders: the basic materials sector, the utilities sector, and the financial sector.
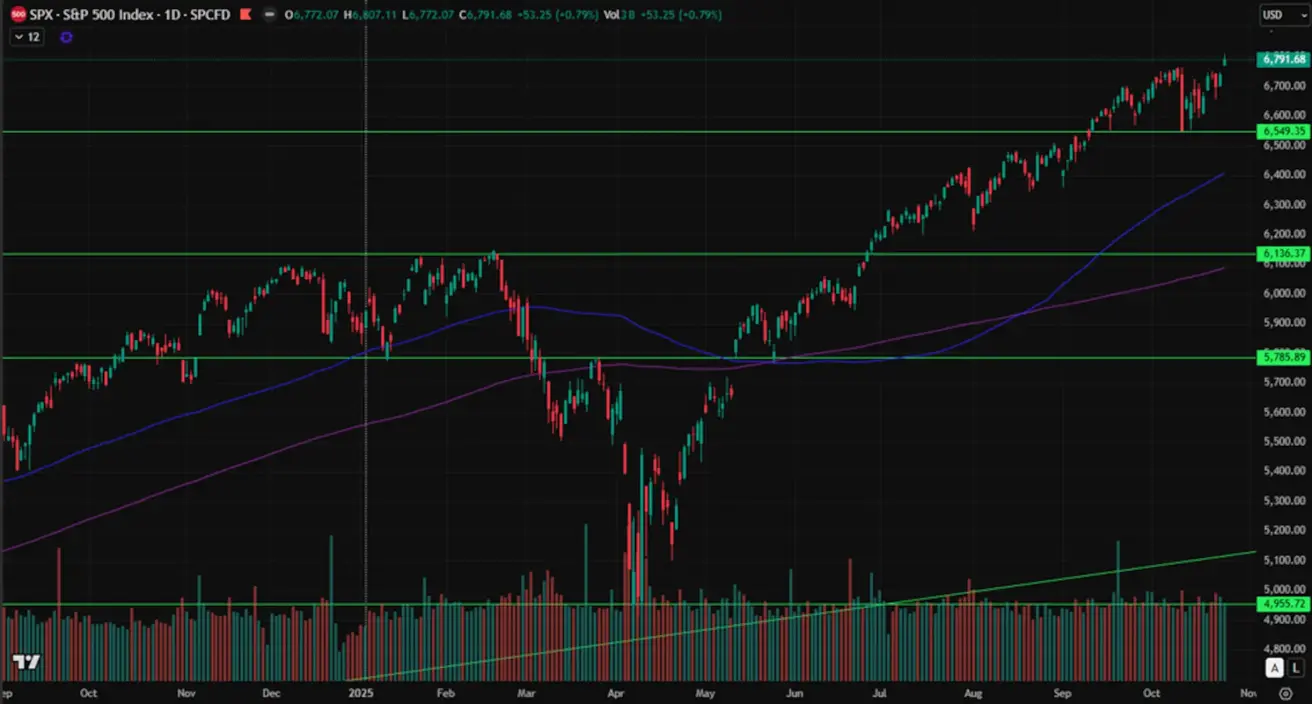
SP500
Growth for the week: +1.92% (week closed at 6,791.68). Year-to-date performance for 2025: +15.05%.
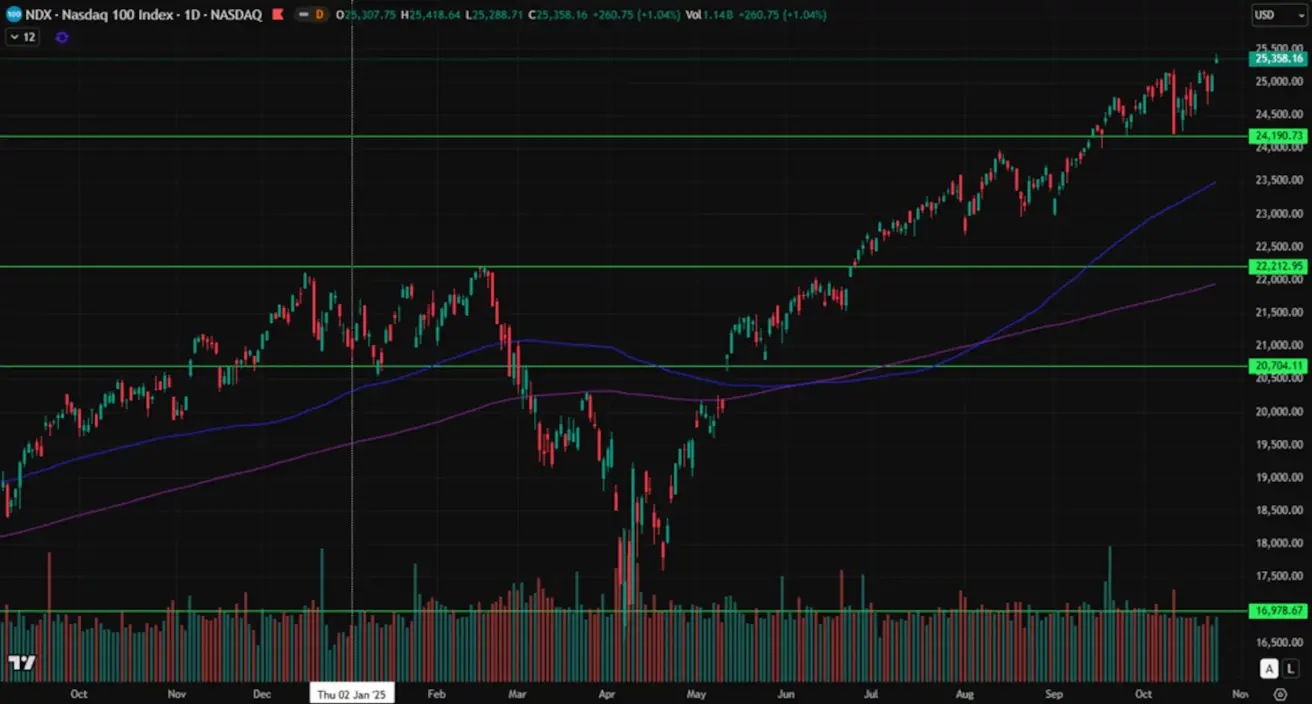
NASDAQ100
Weekly performance: +2.18% (week closed at 25,358.16). Year-to-date performance: +20.07%.
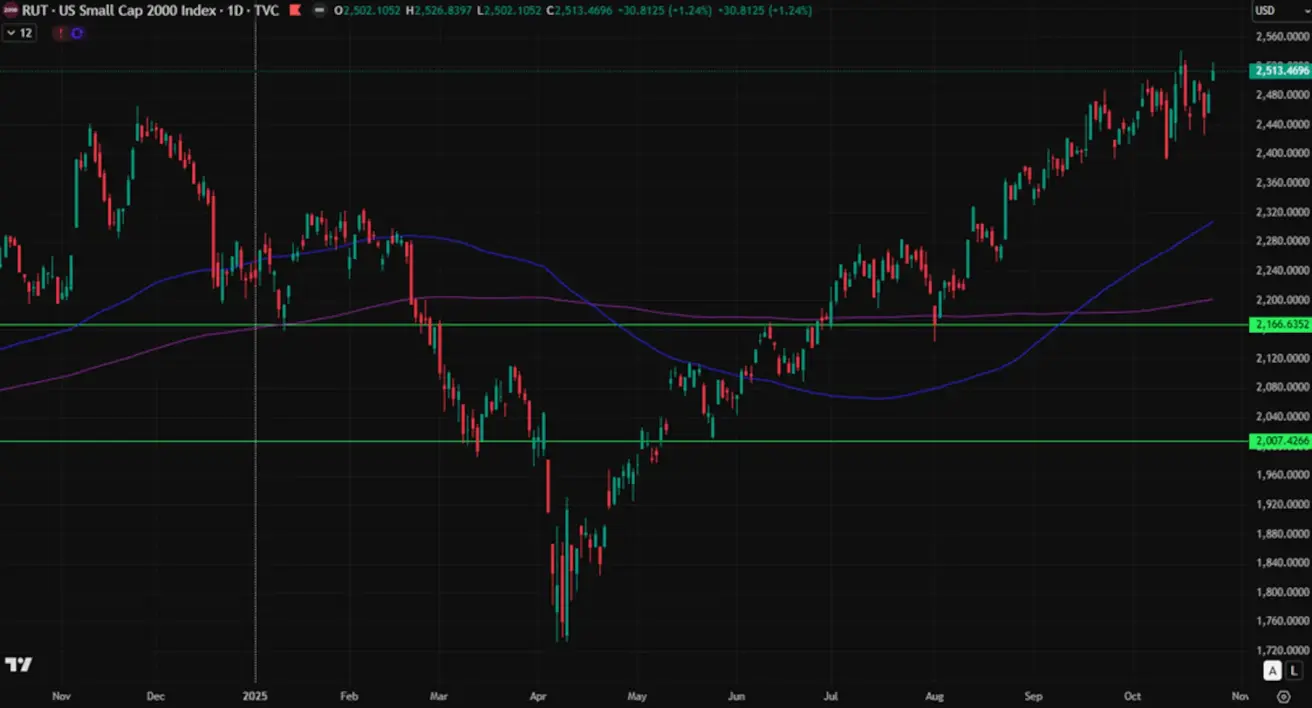
Russel 2000
Weekly performance: +2.50% (week closed at 2,452.17). Year-to-date performance: +12.15%.
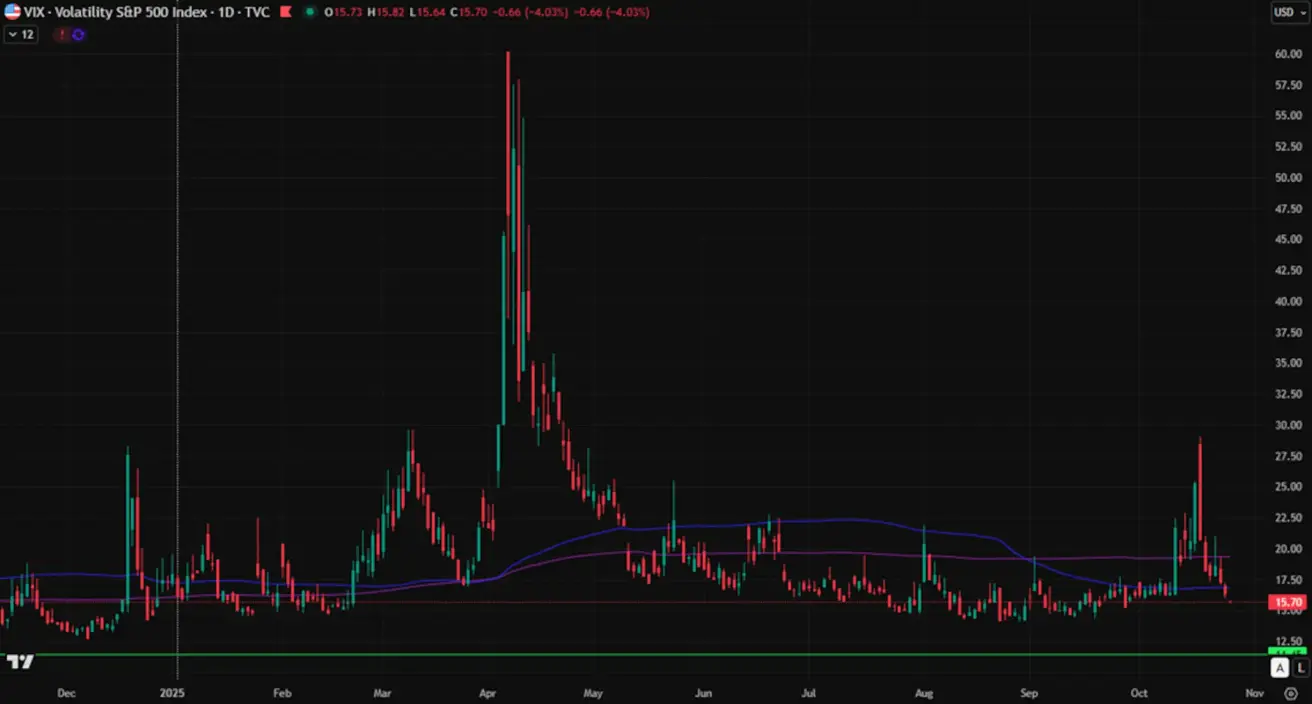
VIX
Week closed at: 13.36:
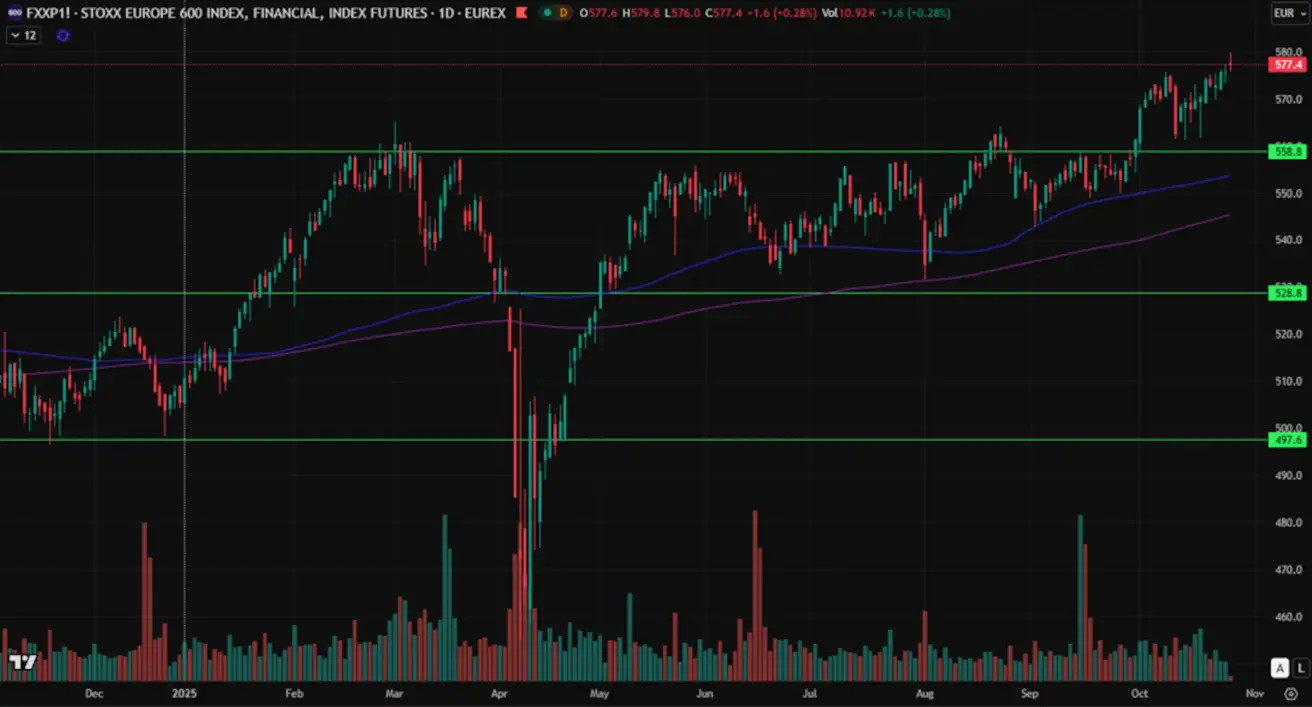
Euro Stoxx 600
Weekly performance: +0.93% (week closed at 575.8). Year-to-date growth: +13.88%.
China
The People’s Bank of China (PBoC) left rates unchanged: the one-year loan prime rate remains at 3.0%, and the five-year benchmark rate stays at 3.50%. Fixed asset investment continues to decline for the fifth consecutive month, with the latest reading at -0.5%.
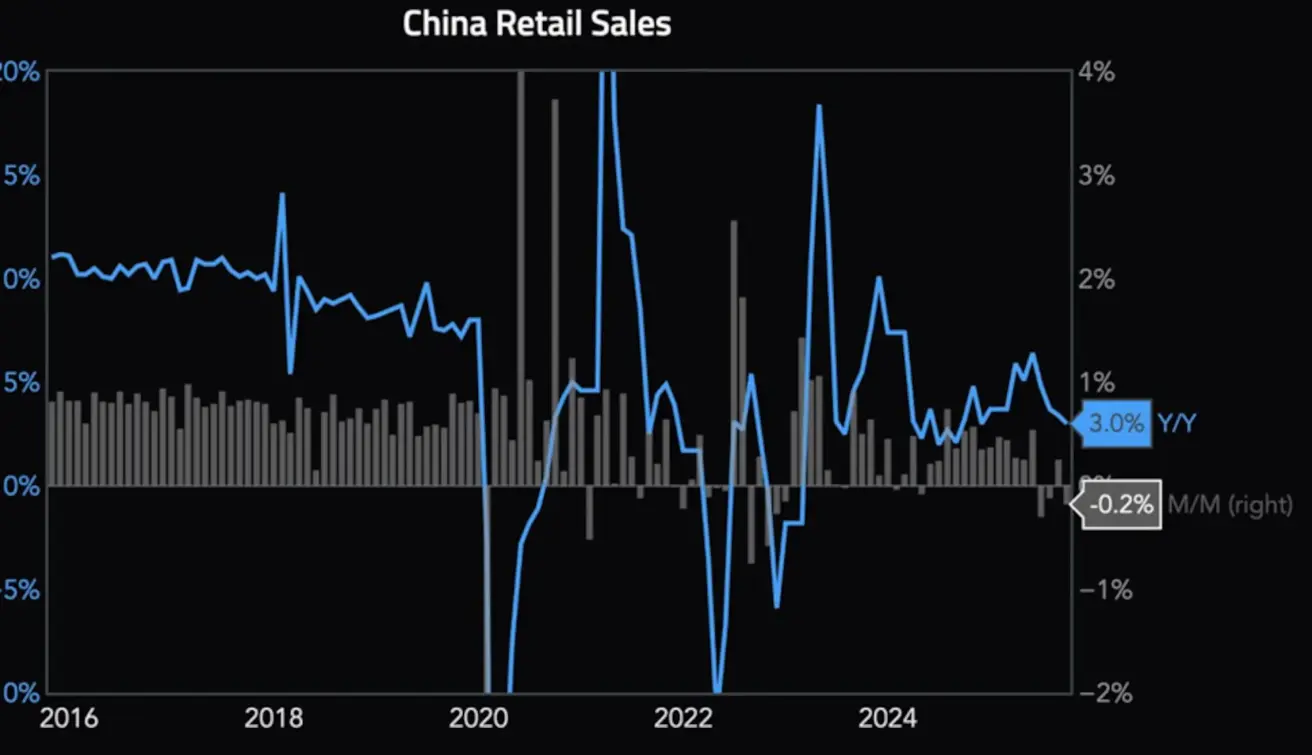
At the same time, industrial output remains stable at a long-term level of 6.5% year-on-year. The main drivers are mining, manufacturing, computers, and telecommunications. GDP growth slowed to 4.8% year-on-year in Q3 (vs. 5.2% previously) due to weak domestic consumer demand, as retail sales fell to 3.0% year-on-year (vs. 3.4%). China’s unemployment rate in September: 5.2% (vs 5.3%).
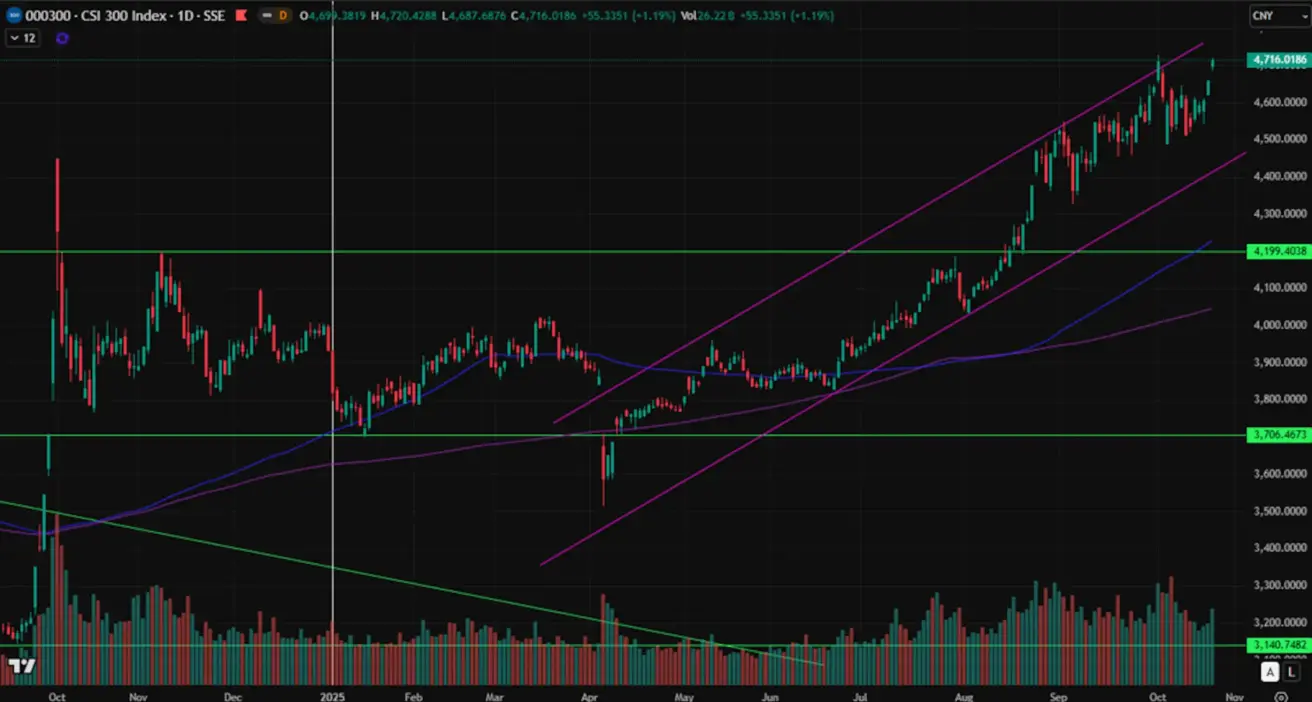
CSI 300 Index
Weekly performance: +3.24% (week closed at 4,660.6835). Year-to-date growth: +18.56%.
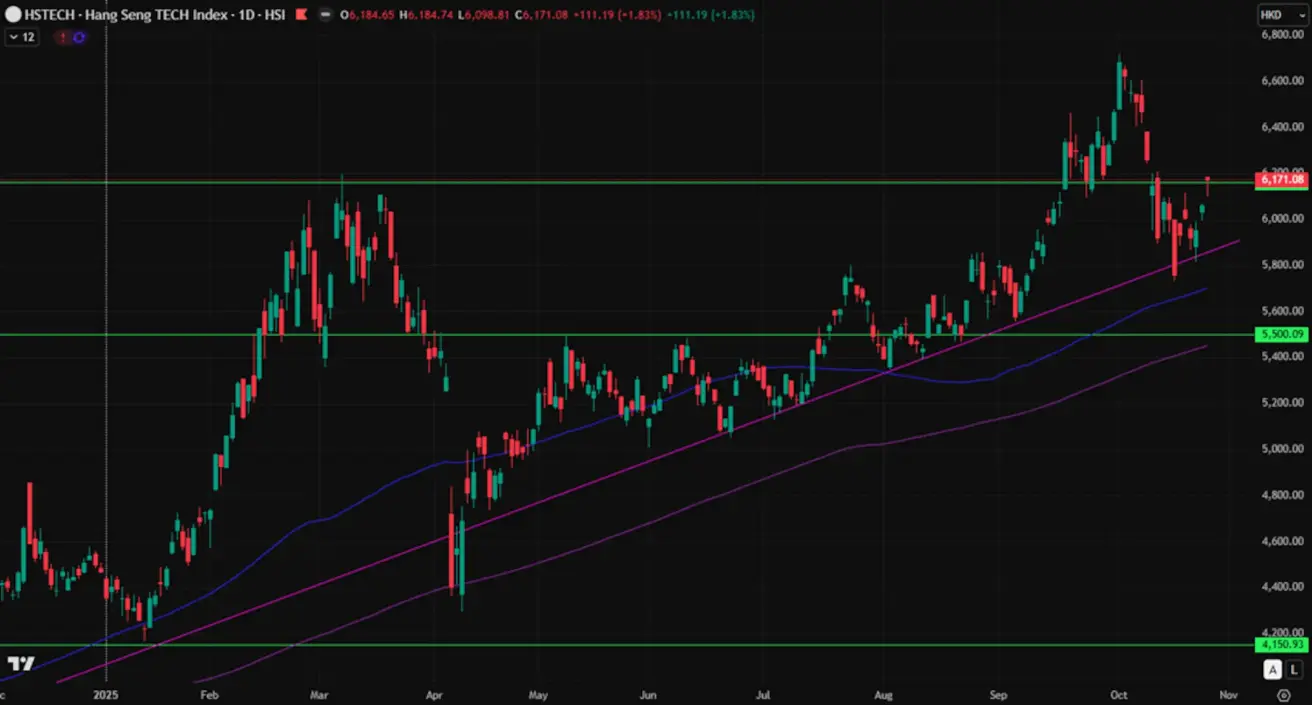
Hang Seng TECH Index (HSTECH.HK)
Weekly performance: +5.20% (week closed at 6,059.89). Year-to-date growth: +36.58%.
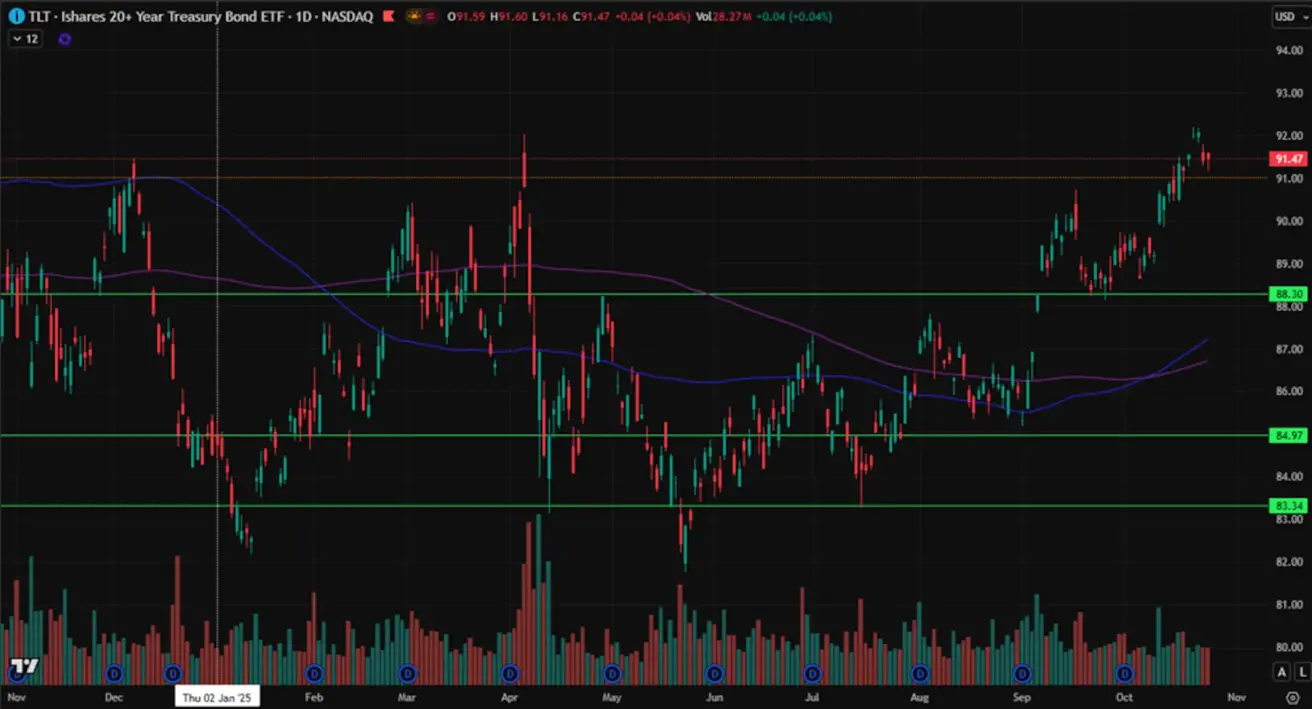
BOND MARKET
Yields showed an almost neutral dynamic. U.S. Treasury Bonds 20+ (ETF TLT): weekly performance: +0.30% (week closed at 91.47). Year-to-date performance: +4.18%.
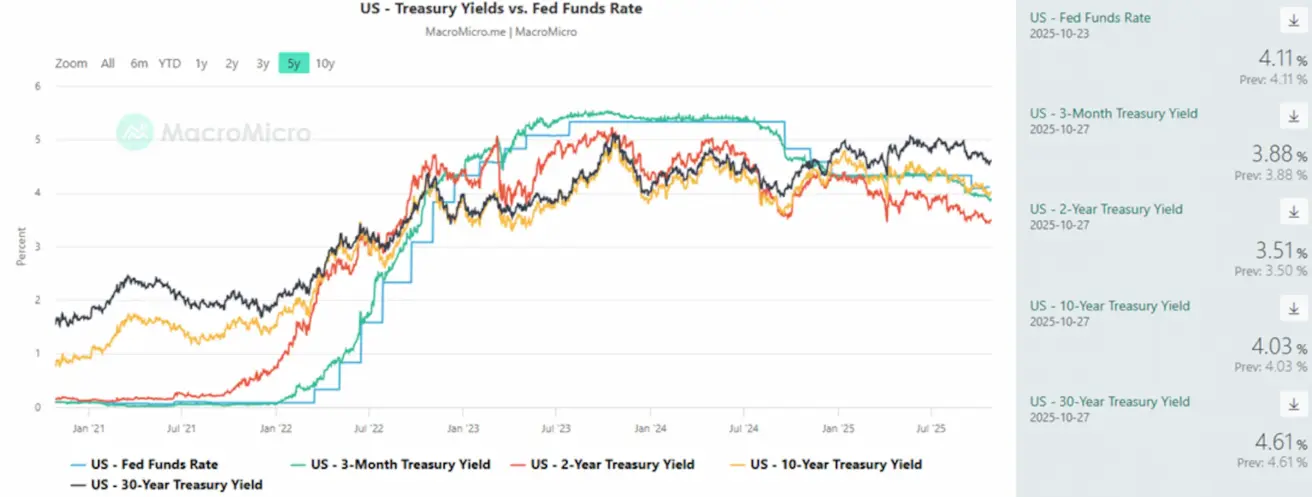
YIELDS AND SPREADS
- Market Yield on U.S. Treasury Securities at 10-Year Constant Maturity: 4.03% (vs 4.02%). 2-Year Treasury Yield: 3.51% (vs 3.52%)
- ICE BofA BBB U.S. Corporate Index Effective Yield: 4.90% (vs 4.88%)
The 5-year U.S. Credit Default Swap (CDS) — a measure of the cost of insuring against default — stands at 36.85 bps (vs 36.84 bps last week).
- The yield spread between 10-year and 2-year U.S. Treasuries is 52.0 bps (vs 55.0 bps),
- While the spread between 10-year and 3-month Treasuries is 15.0 bps (vs 8.0 bps).
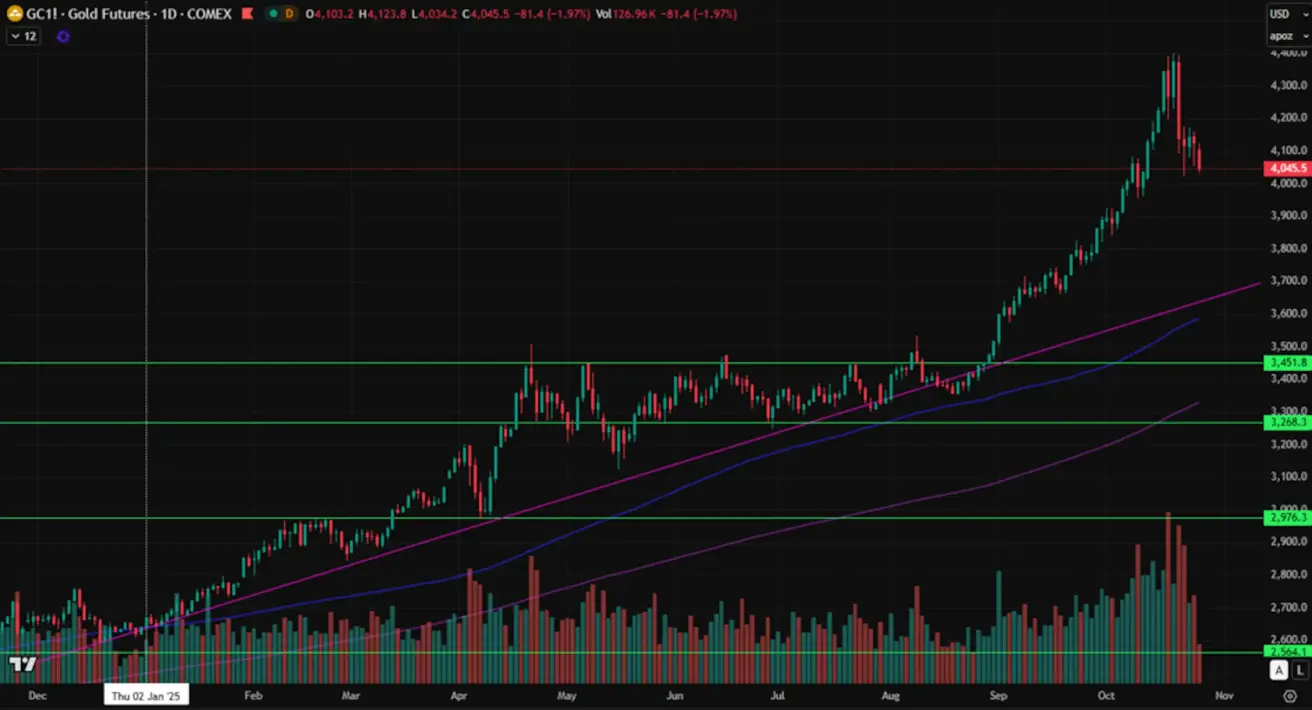
GOLD FUTURES (GC)
Weekly performance: +3.30% (week closed at $4,126.90 per troy ounce). Year-to-date growth: +56.26%. The price was influenced by the strengthening of the U.S. dollar, positive developments in the U.S.– China trade talks, and technical overbought conditions in the market.
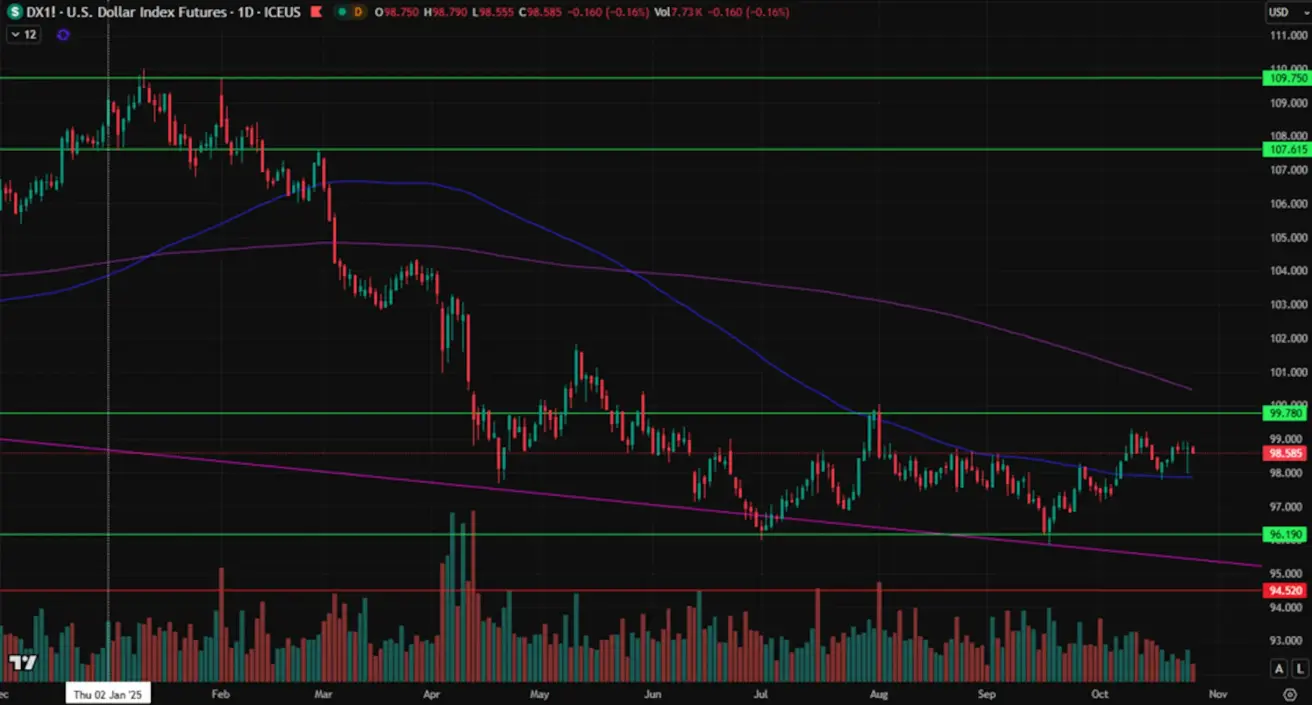
DOLLAR INDEX FUTURES (DX)
Weekly performance: +0.44% (week closed at 98.745).Year-to-date performance: –8.85%. Political uncertainty risks remain elevated.
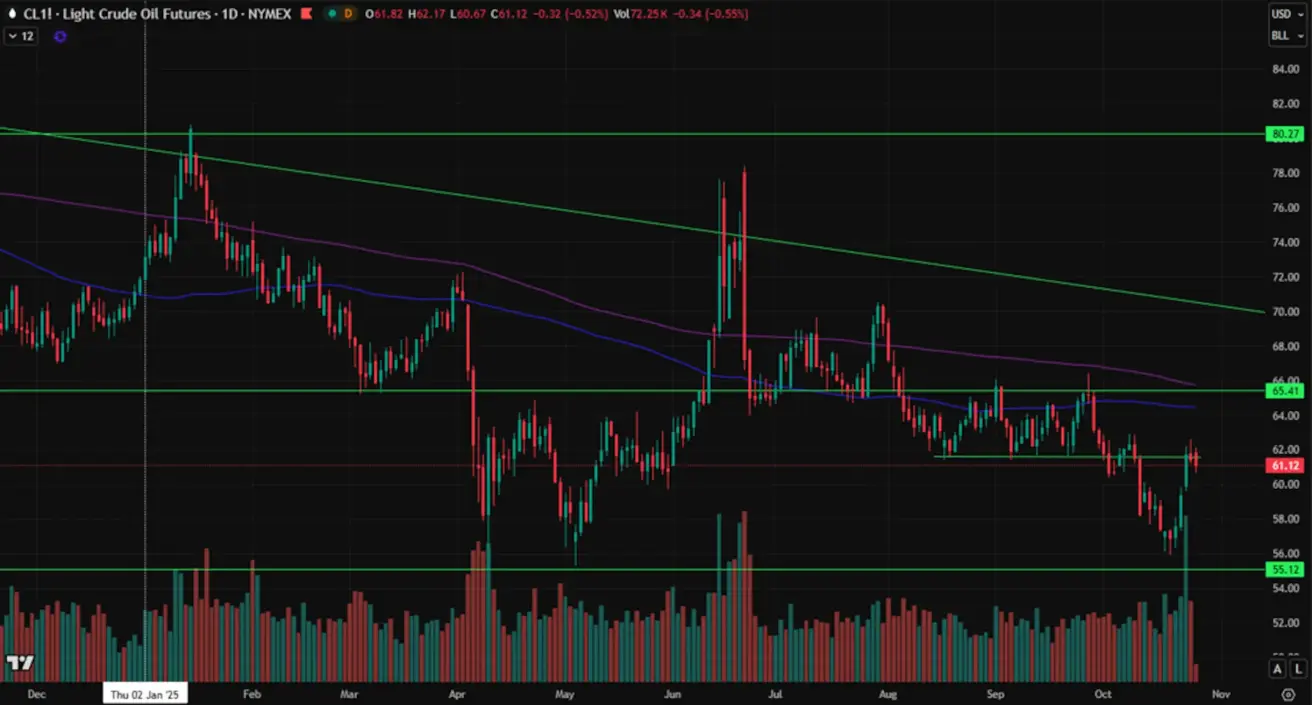
OIL FUTURES
Weekly performance: +7.32% (week closed at $61.44 per barrel).Year-to-date performance: –14.49%.
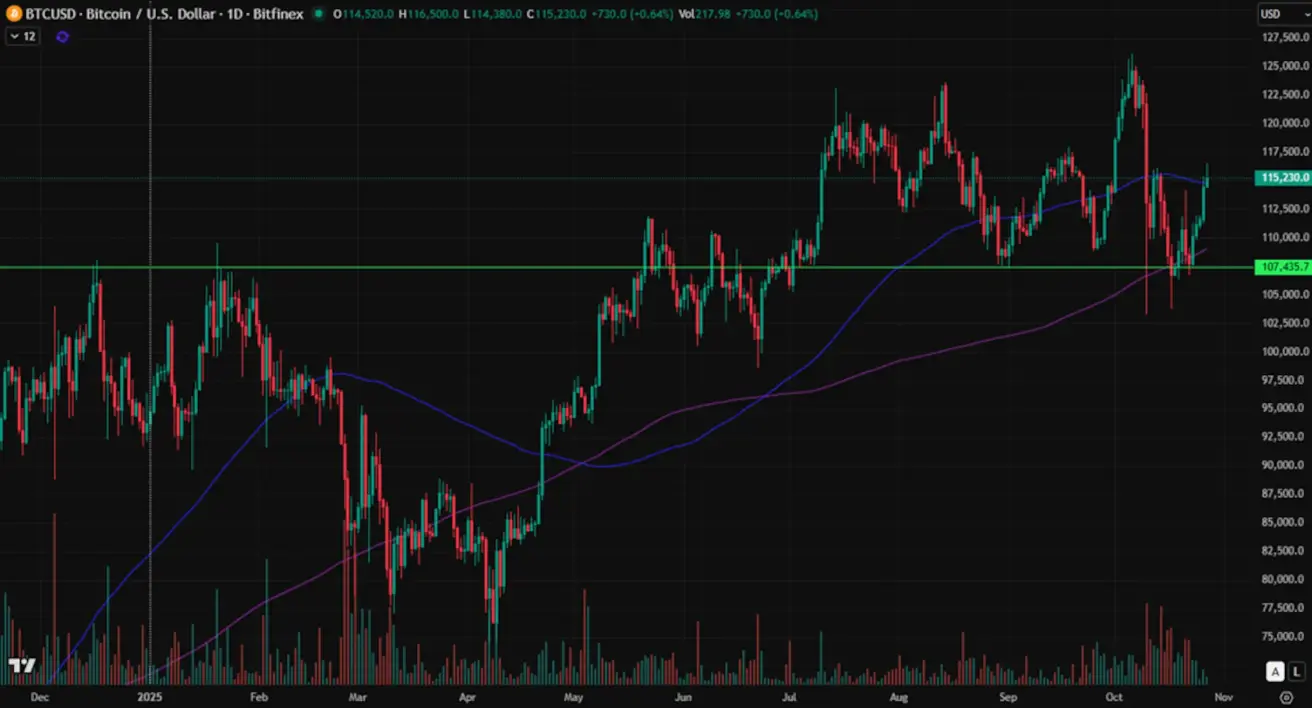
BTC FUTURES
Weekly performance: +5.20% (week closed at $114,500). Year-to-date return: +22.12%.
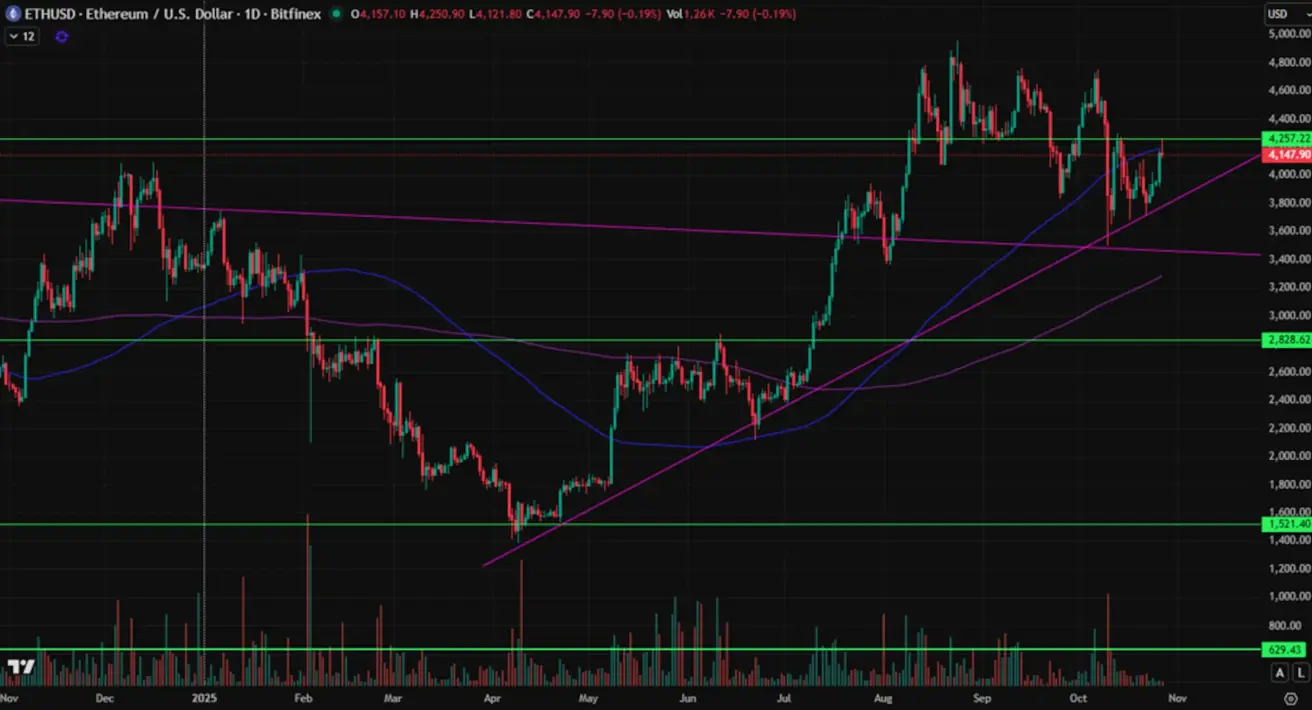
ETH FUTURES
Weekly performance: +4.17% (week closed at $4,155.8). Year-to-date performance: +24.27%.
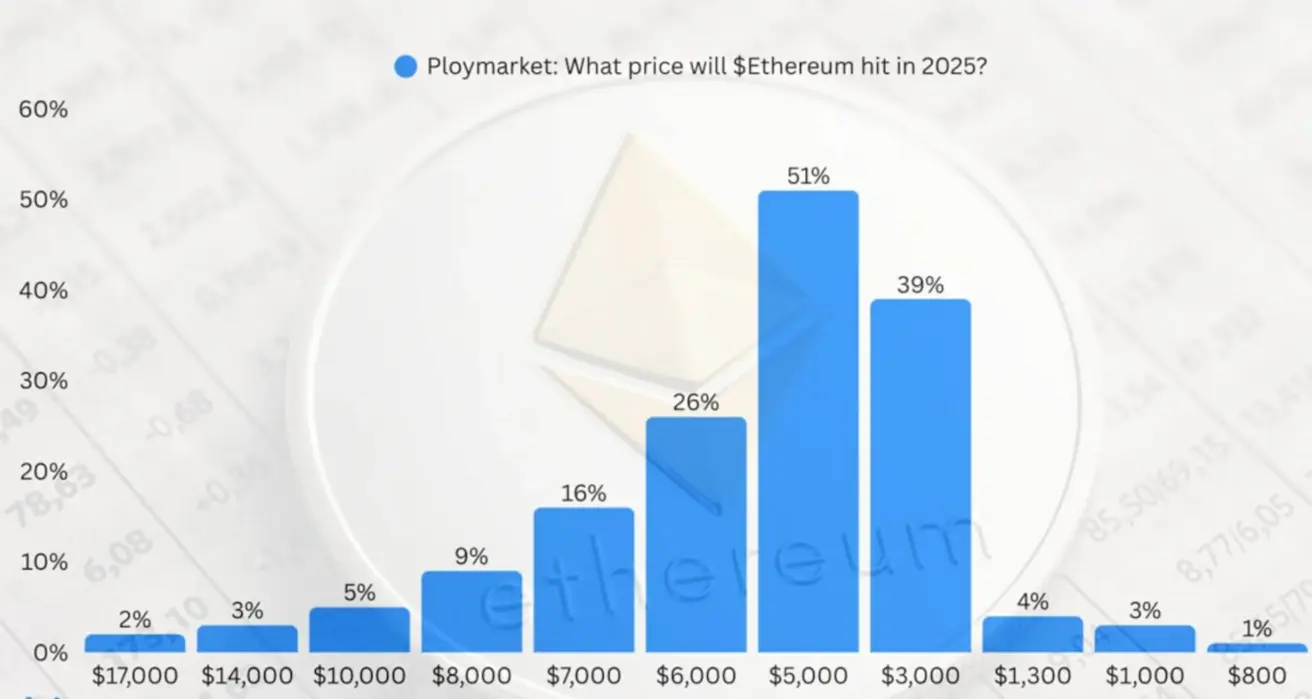
Traders’ expectations for Ethereum’s price by the end of 2025, according to Polymarket:
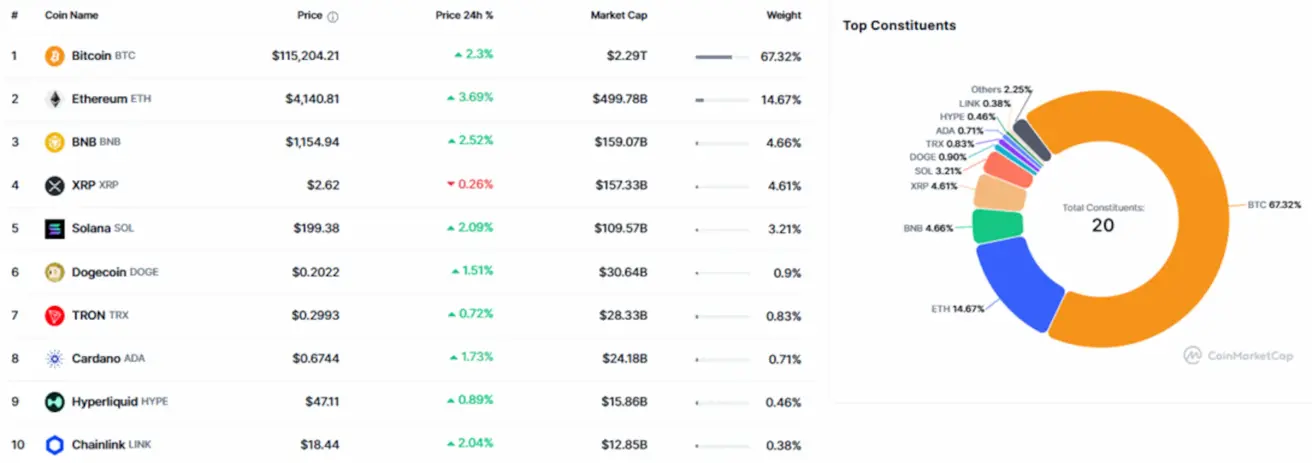
Total cryptocurrency market capitalization: $3.89 trillion (vs $3.77 trillion a week earlier) — source: coinmarketcap.com.
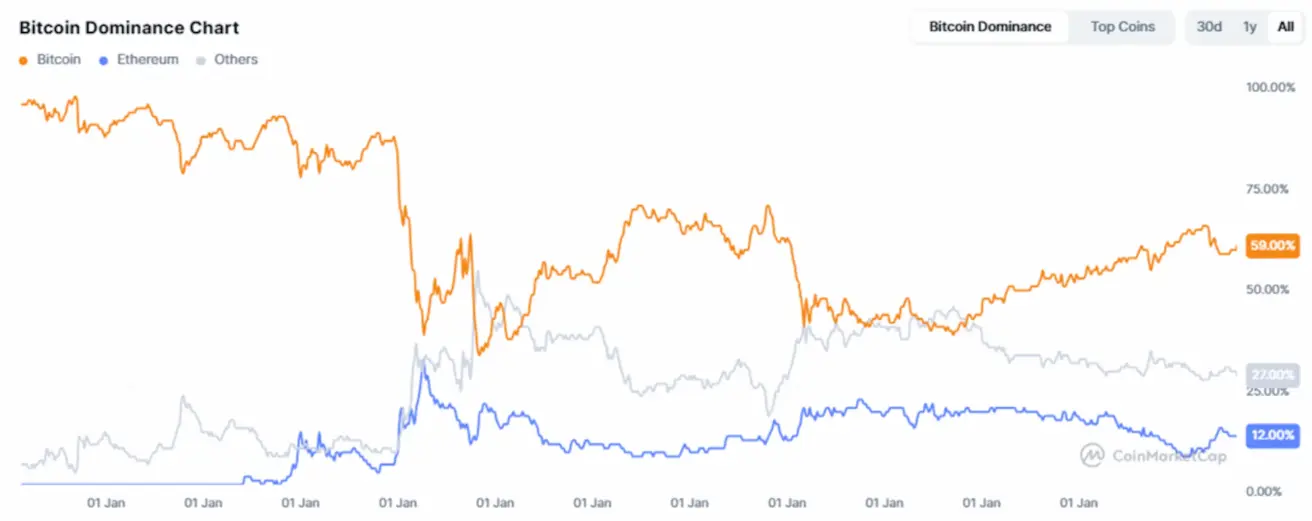
Market share by asset:
- Bitcoin: 59.2% (vs 58.8%),
- Ethereum: 12.9% (vs 13.0%),
- others: 27.9% (vs 28.2%).
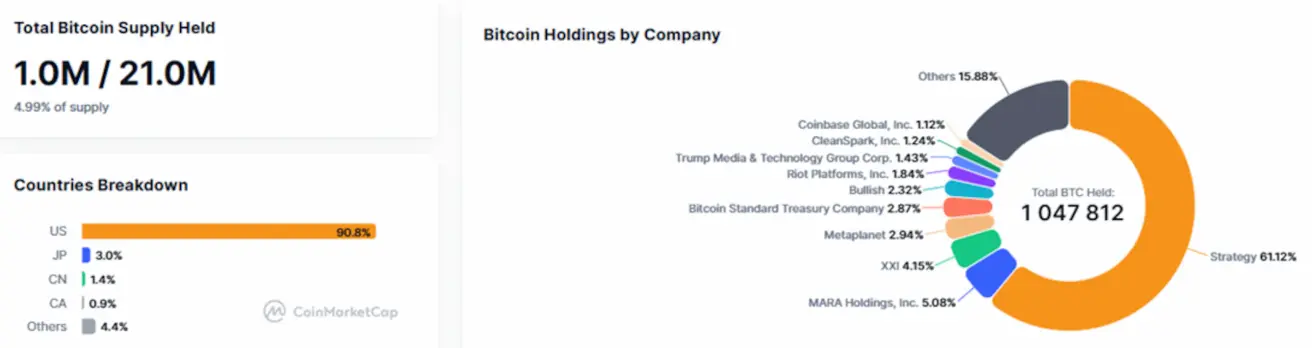
Public companies with Bitcoin Treasury strategies: the share of bitcoins held on corporate balance sheets remained unchanged from the previous week, standing at 4.99% (vs 4.92%) of the total bitcoin supply.