 Lietuvių
 Русский
 Қазақша
 Eesti
EestiAugust 18–22, 2025: Weekly economic update
Key market updates

Macroeconomic Statistics
Inflation (CPI):
- Core Consumer Price Index (CPI) (m/m) (June): 0.3% (prev: 0.2%)
- Consumer Price Index (CPI) (m/m) (June): 0.2% (prev: 0.3%)
- Core Consumer Price Index (CPI) (y/y) (June): 3.1% (prev: 2.9%)
- Consumer Price Index (CPI) (y/y) (June): 2.7% (prev: 2.7%)
Inflation Expectations (Michigan):
- 12-month expected inflation (Aug): 4.9% (prev: 4.5%)
- 5-year expected inflation (Aug): 3.9% (prev: 3.4%)
Producer Price Index (PPI):
-
PPI (m/m) (Aug): 0.9% (prev: 0.0%)
-
Core PPI (m/m) (Aug): 0.9% (prev: 0.0%)
-
GDP (U.S. Bureau of Economic Analysis, BEA) (2Q25 annualized, preliminary): 3.0% (1Q24: -0.5%)
-
GDPNow (Atlanta Fed, 2Q): 2.3% (vs 2.5%) (GDPNow is a “real-time” estimate of GDP growth, using a methodology similar to the BEA’s.)
Business Activity (PMI) (50+ = expansion, below 50 = contraction):
- Services (July): 55.4 (prev: 55.7)
- Manufacturing (July): 53.3 (prev: 49.8)
- S&P Global Composite (July): 55.4 (prev: 55.1)
Labor Market:
- Unemployment rate (June): 4.2% (prev: 4.1%)
- Non-farm payrolls (June): +73K (prev. revised: +144K)
- U.S. private non-farm payrolls (June): +83K (prev: +137K)
- Avg. hourly earnings (June, y/y): 3.9% (prev: 3.8%)
- JOLTS job openings (May): 7.769M (vs 7.395M)
Monetary Policy
- Federal Funds Rate (EFFR): 4.25–4.50%
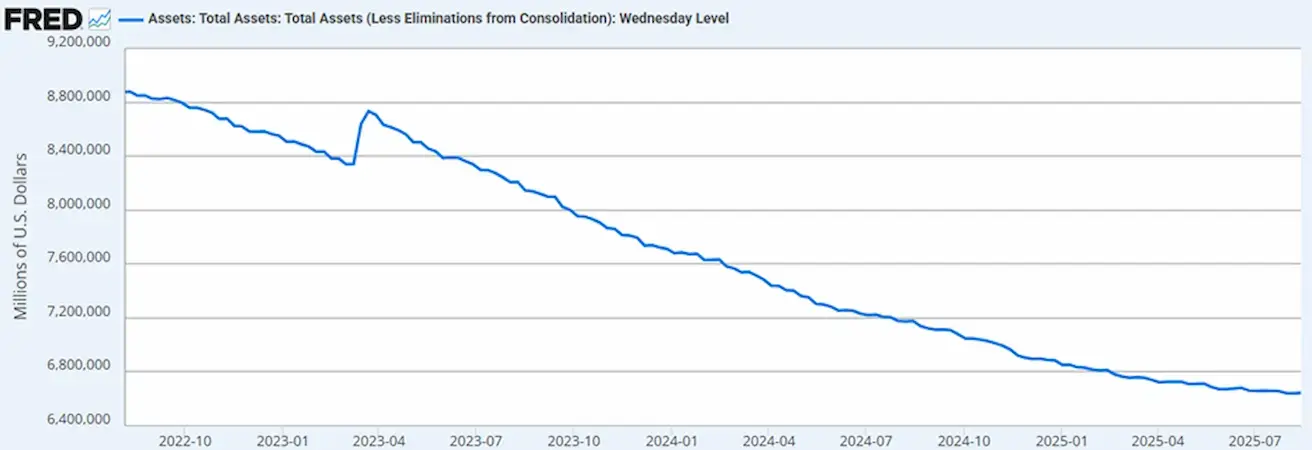
- Fed Balance Sheet: $6.618T (vs last week: $6.43T)
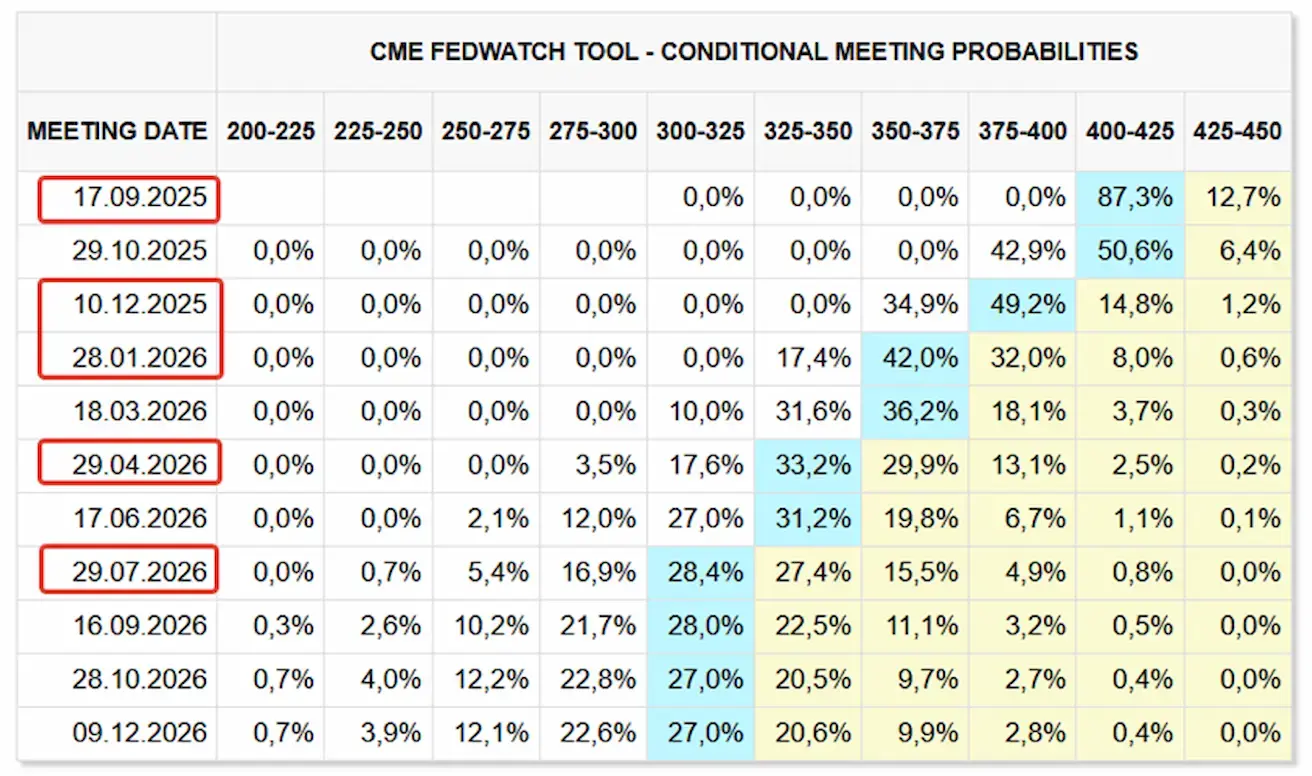
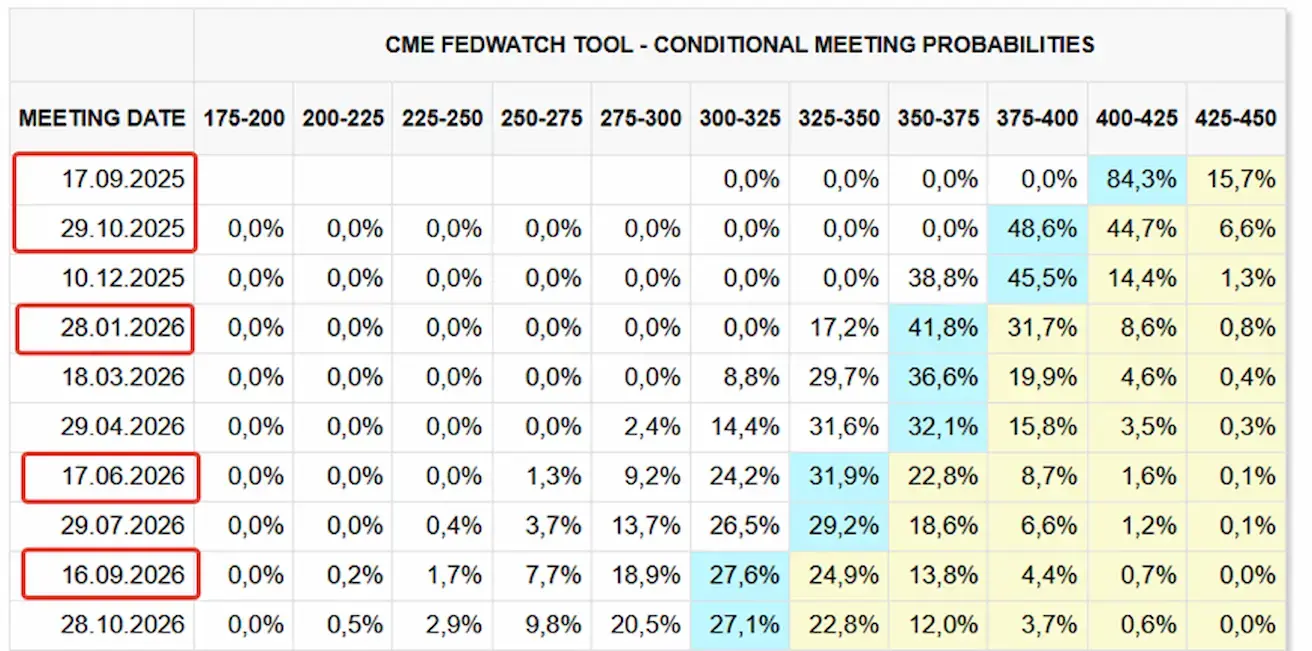
Market expectations (FedWatch):
Today:
One week ago:
Commentary
Last week markets stayed risk-on. U.S. equities rose Friday after Fed Chair Powell at Jackson Hole signaled a possible September rate cut. Powell highlighted shifting economic risks that “may require policy adjustment,” but also warned inflationary pressures persist.
Two key points stood out:
- Fed guidance may rely more on soft data (expectations) than hard data (published macro releases). Inflation expectations now exceed the target more than 2×.
- Within monetary policy, inflation risks now dominate. This implies tighter inflation targeting, even at the cost of cooling the labor market.
Conclusion: The rate-cut path may be slower than markets expect, given 4.2% unemployment and lagged effects of prior hikes.
Trade Wars
U.S. & EU preliminary deal:
- U.S. keeps 15% tariffs on most EU goods
- EU to buy $750B U.S. energy + $40B U.S. chips
- U.S. tariffs on EU cars may be reduced within weeks
Stock Market
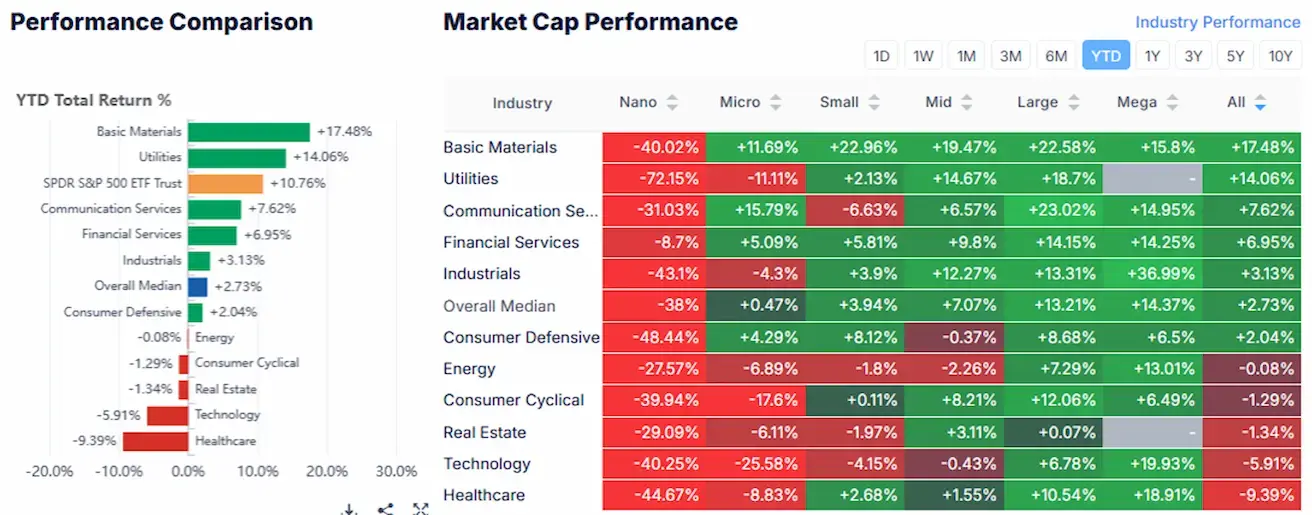
- Weekly median gain: +2.21%. Leaders: Real estate, energy, industry.
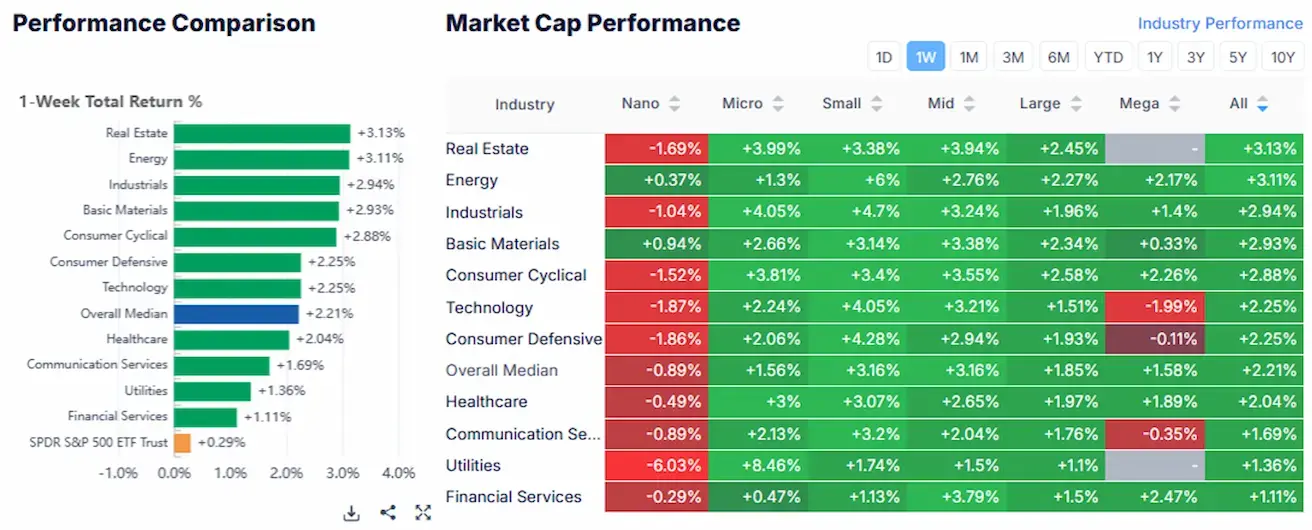
- YTD: +2.73%. Leaders: utilities, basic materials, communication services. Laggards: tech (-5.91%), healthcare (-9.39%).
Indices:
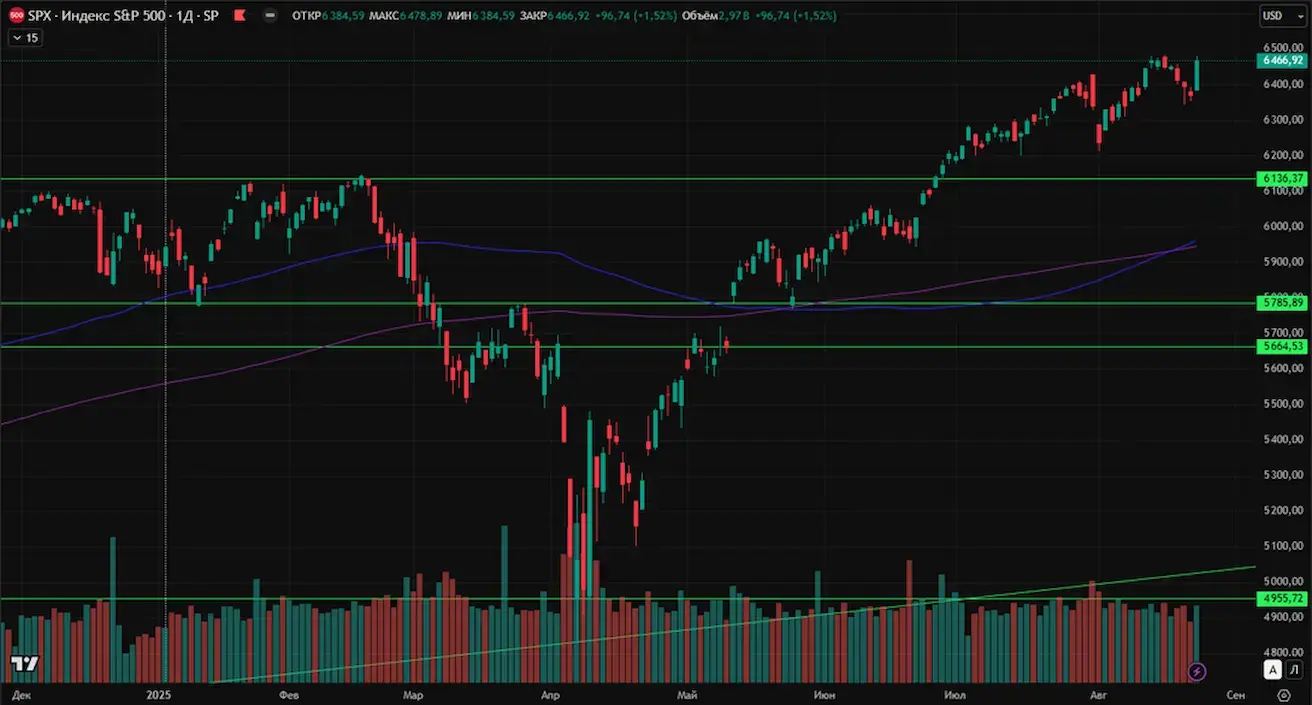
- S&P 500: near record high; weekly +0.27% (close 6466.92). YTD: +9.55%.
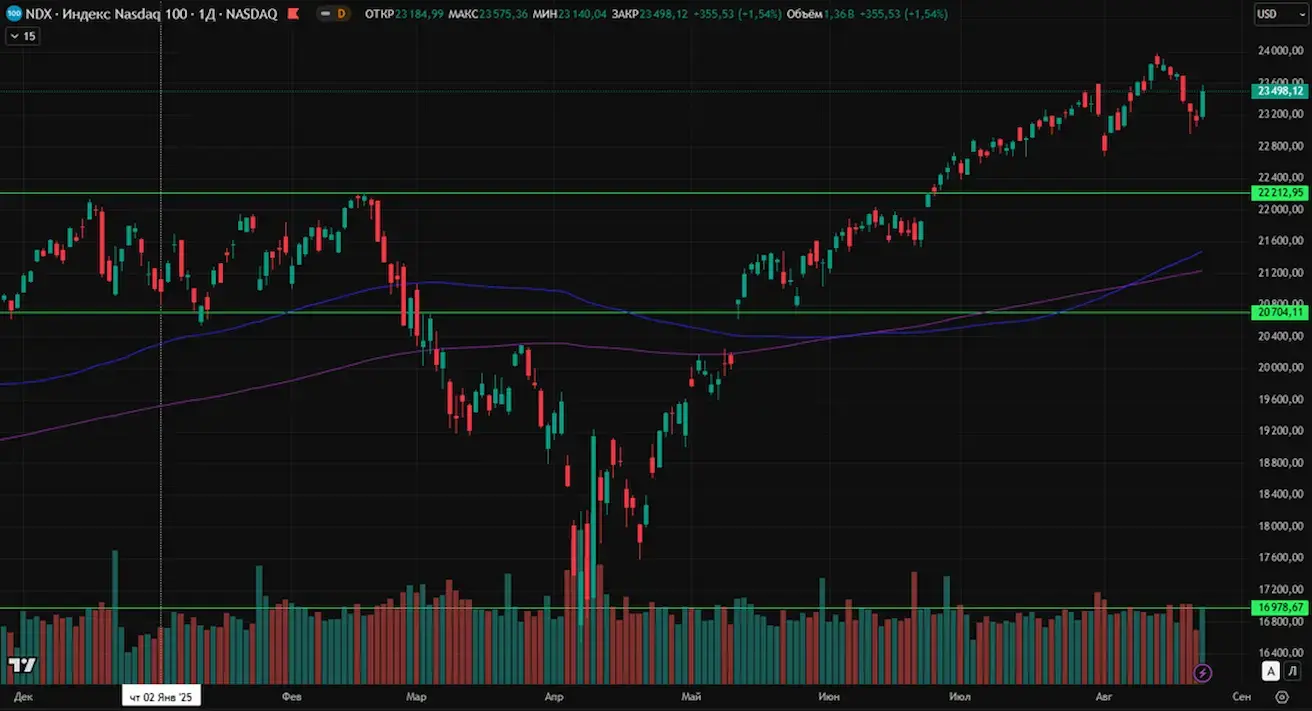
- Nasdaq 100: weaker, -0.90% weekly (close 23498.12). YTD: +11.26%.
- S&P affirmed the U.S. sovereign rating at AA+ with a stable outlook, noting a resilient but high deficit.
- U.S. net government debt is expected to approach 100% of GDP due to rising non-discretionary interest and aging-related spending.
- S&P forecasts U.S. economic growth to be around 2% after slowing in 2025 and 2026.
- The report says budget deficits will not improve significantly, but no sustained deterioration is expected over the next few years.
- Average annual real GDP growth is expected to slow to 1.7% in 2025 and 1.6% in 2026.
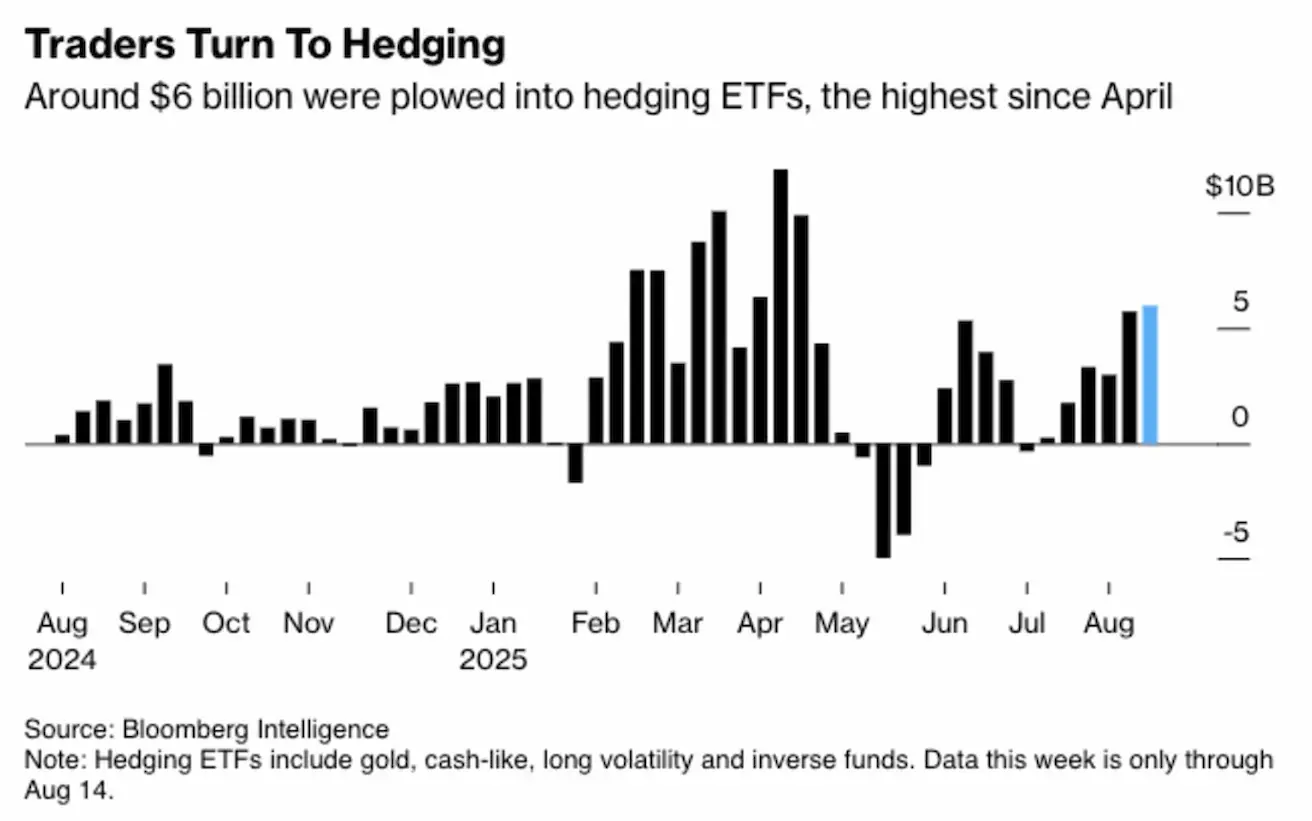
Last week, investors invested $6 billion in hedging ETFs (instruments for reducing risk, for example, smoothing out exchange rate fluctuations, insuring against rising rates, these instruments also earn when the underlying asset falls, etc.) - on the chart we see the maximum value since May of this year. This is certainly far from panic, but it can be argued that the growth of market risks is still ongoing.
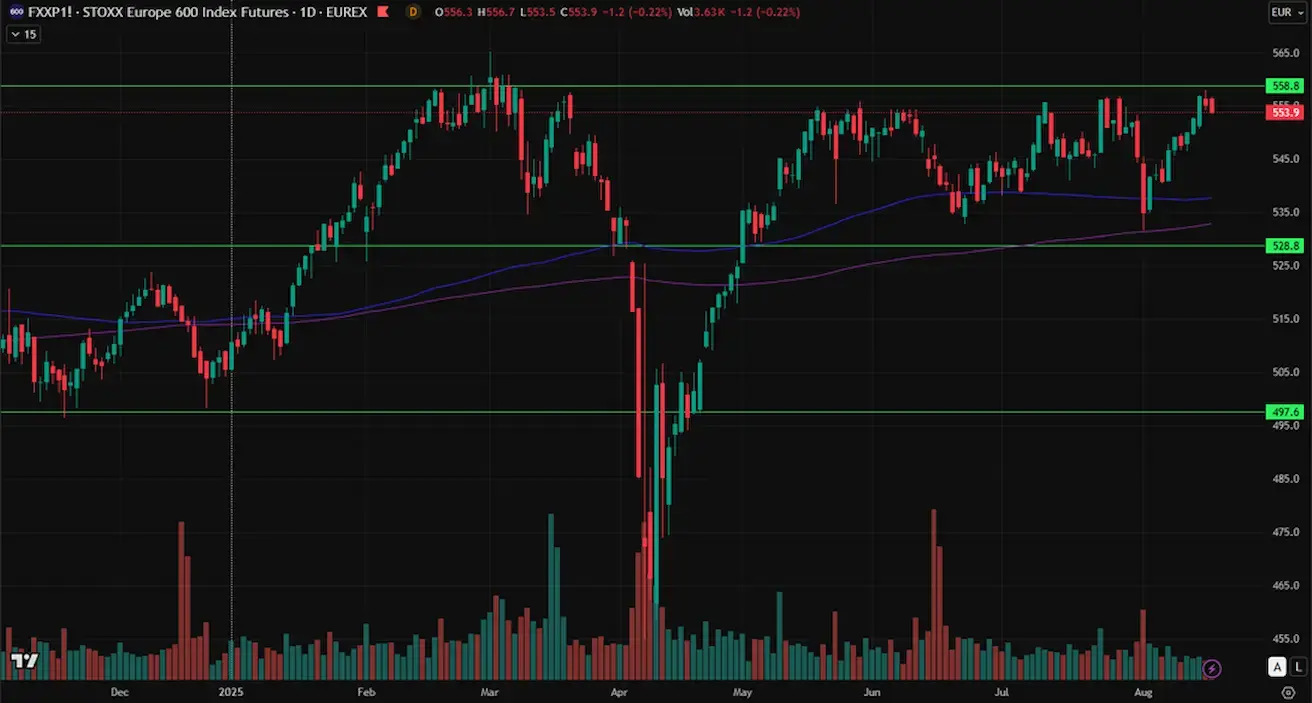
- Euro Stoxx 600: +1.33% weekly (562.5). YTD: +11.25%.
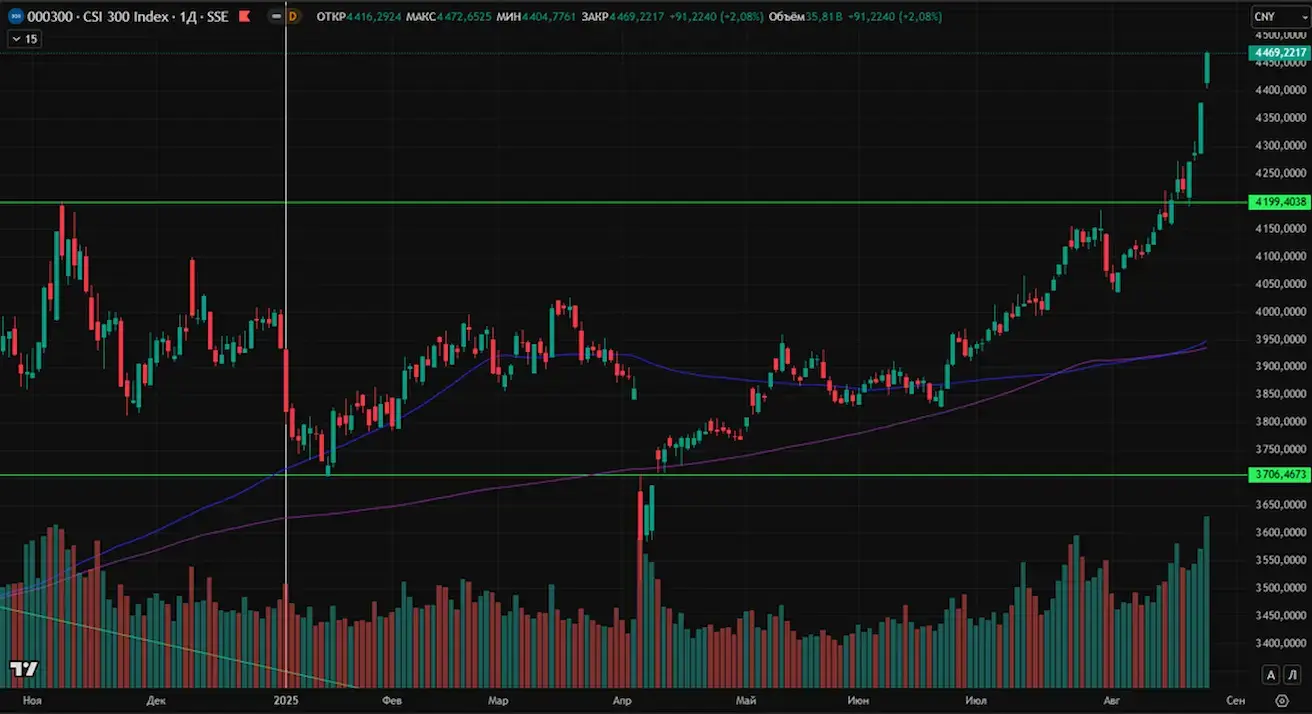
- CSI Index (China): +6.35% (4469.22). YTD: +13.69%.
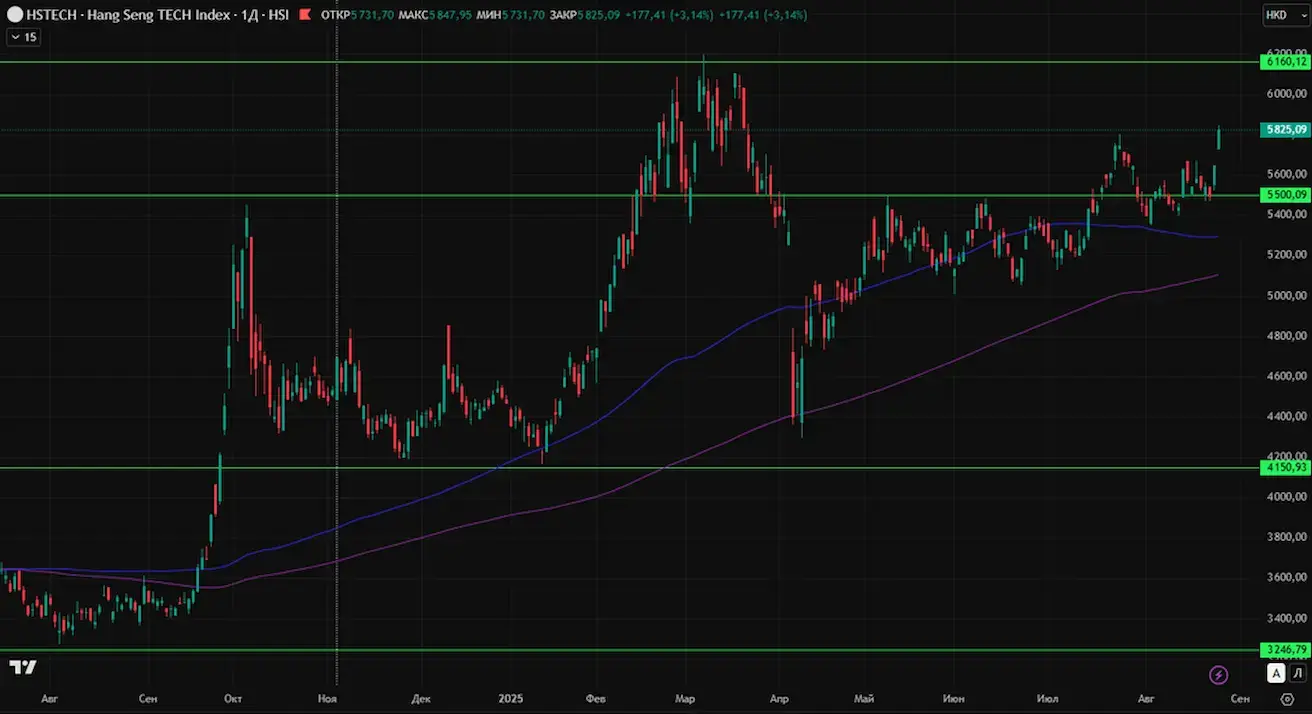
- Hang Seng Tech Index: +5.09% (5825.09). YTD: +31.29%.
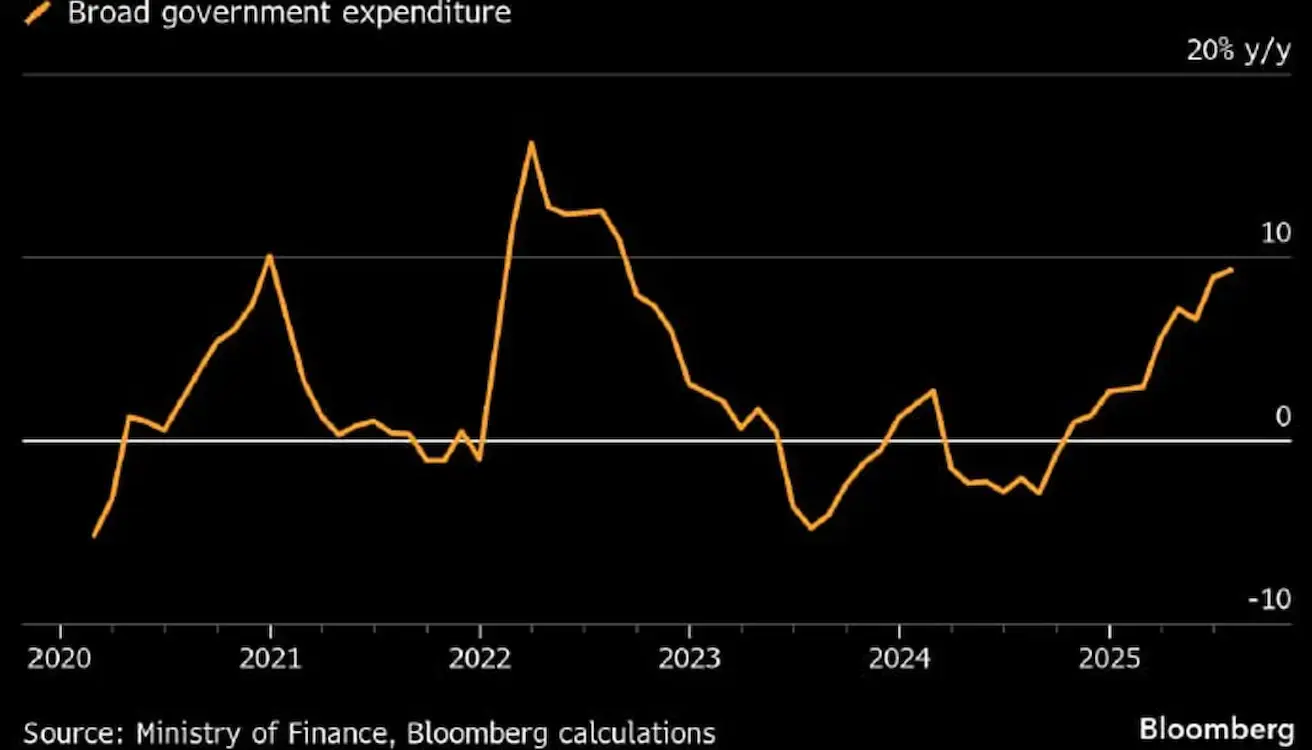
China has been actively increasing fiscal stimulus for the economy since mid-2024:
Bond Market
- Weekly: near-neutral
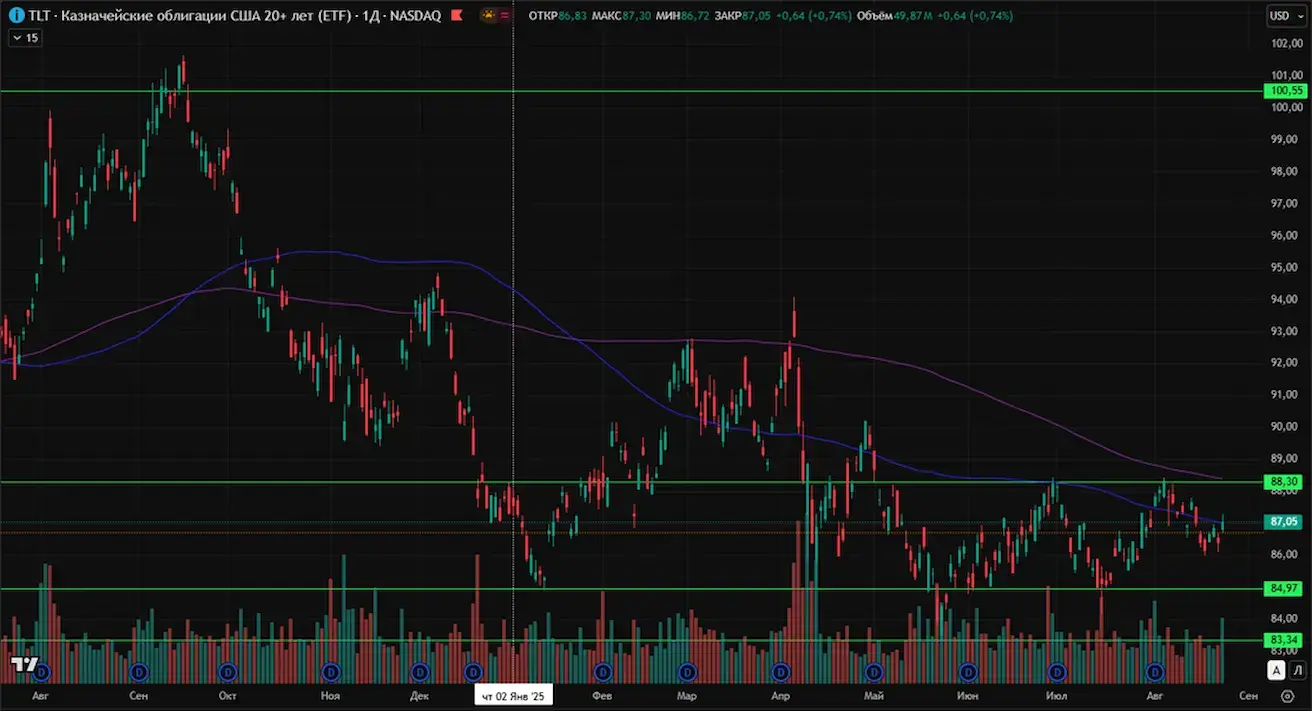
- U.S. Treasury ETF (TLT 20+): +0.75% (87.05). YTD: -0.85%
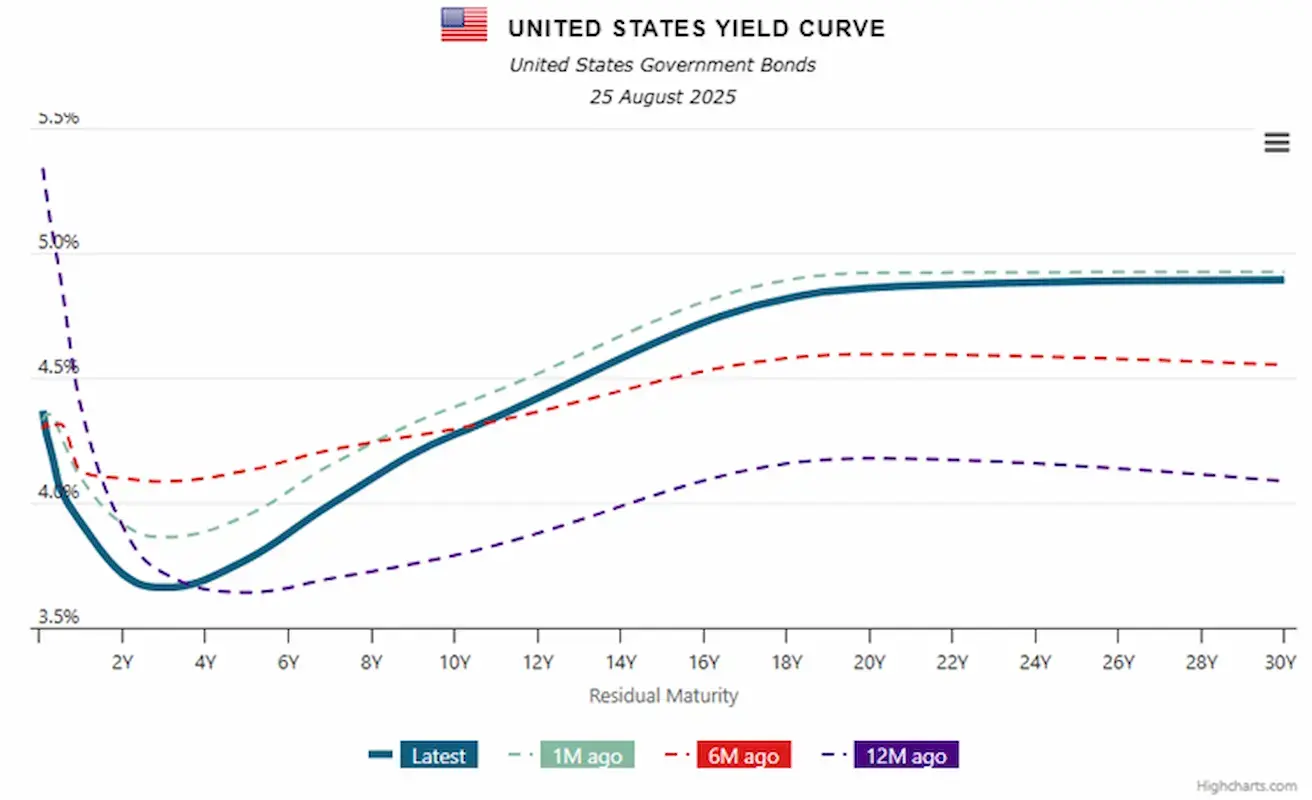
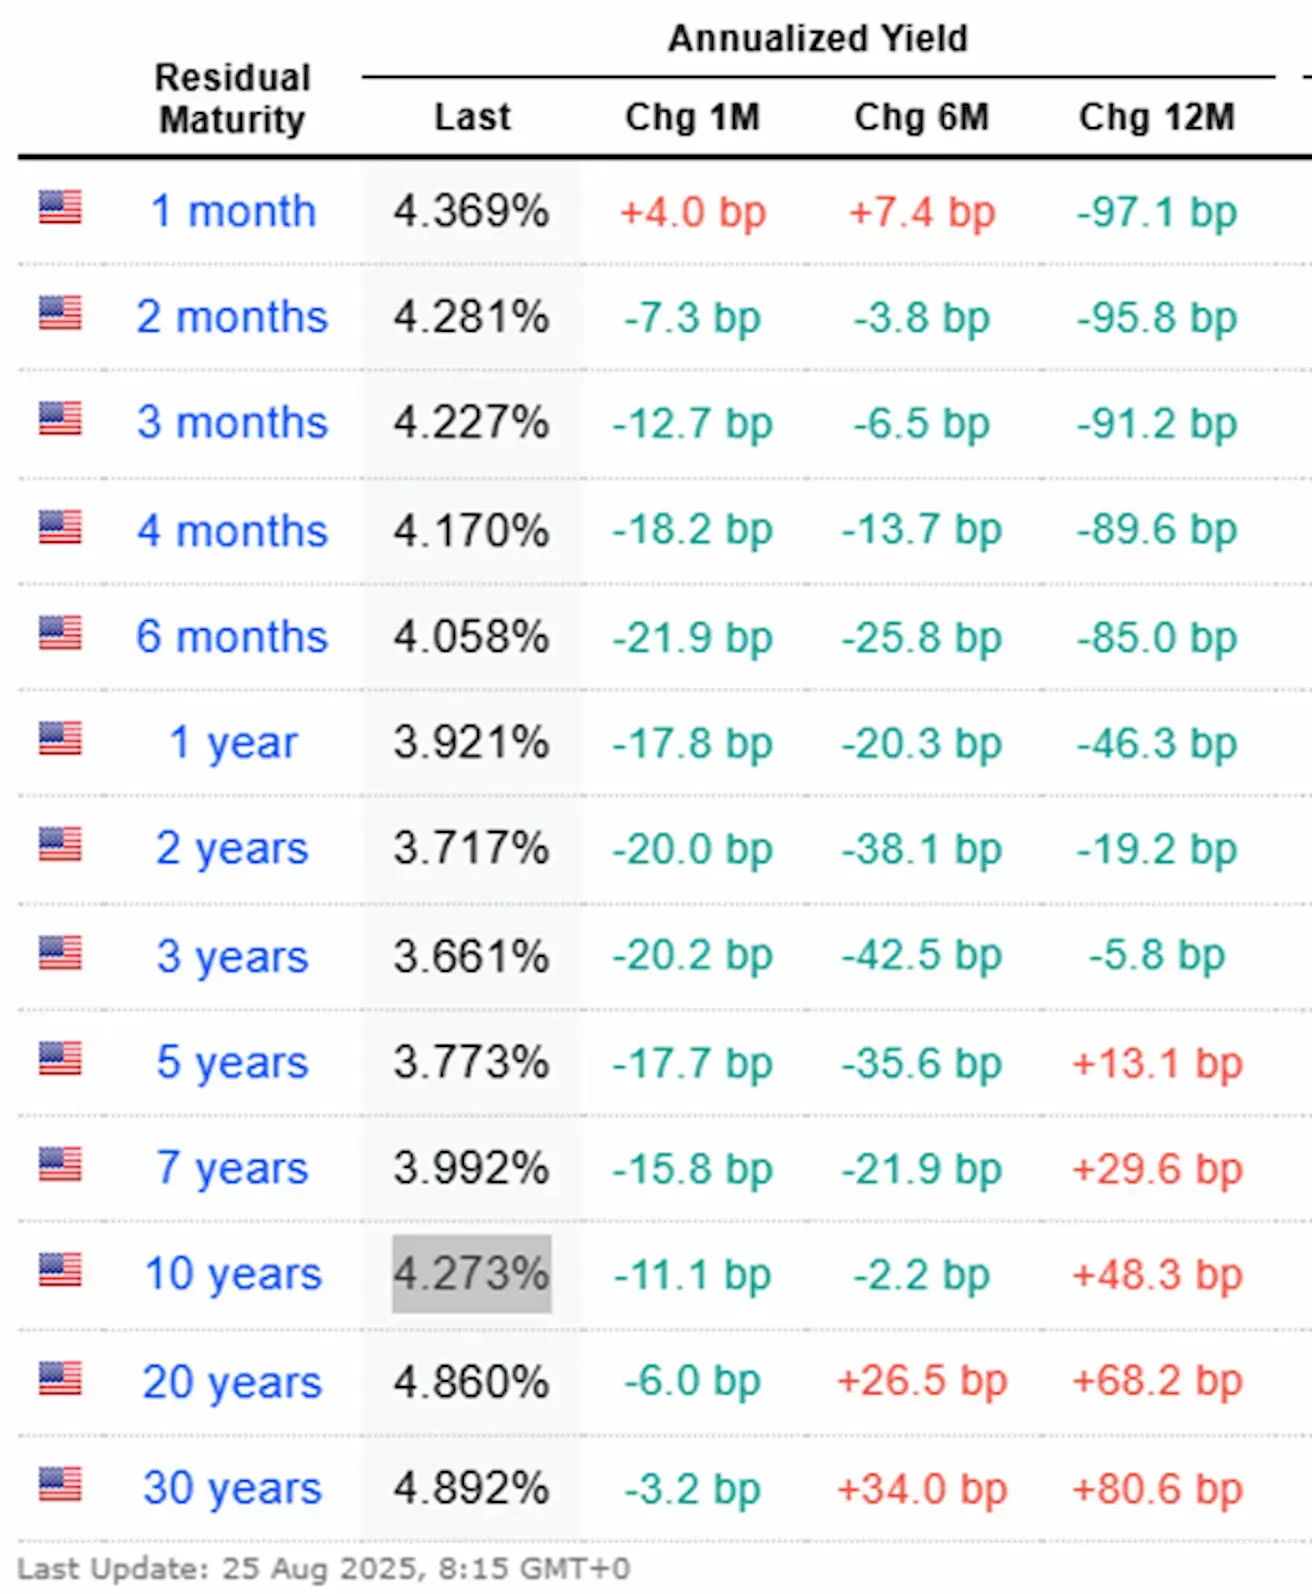
Yields & Spreads:
- 10Y U.S. Treasury: 4.273% (vs 4.31%)
- BBB corporate yield: 5.17% (vs 5.12%)
- 10Y–2Y spread: 55bps (vs 56bps)
- 10Y–3M spread: 4.6bps (vs 8bps)
Commodities & FX
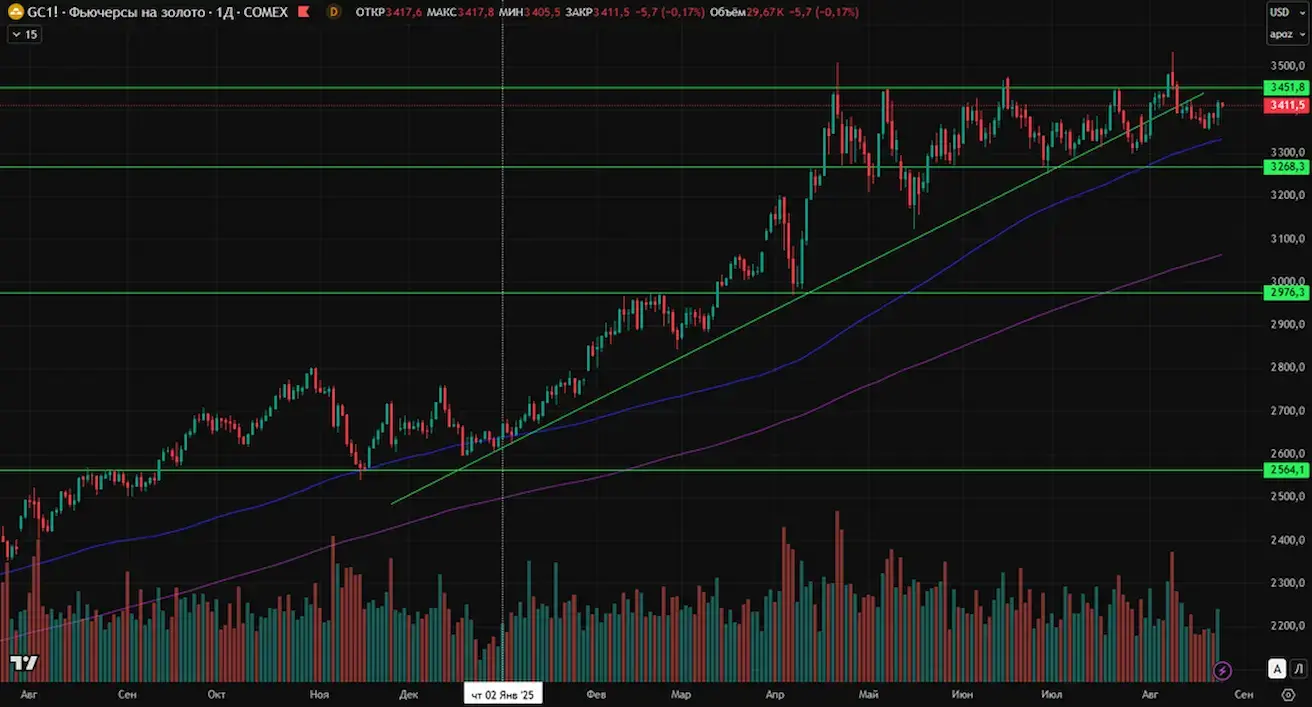
- Gold (futures): +1.05% weekly → $3417.2/oz. YTD: +29.39%
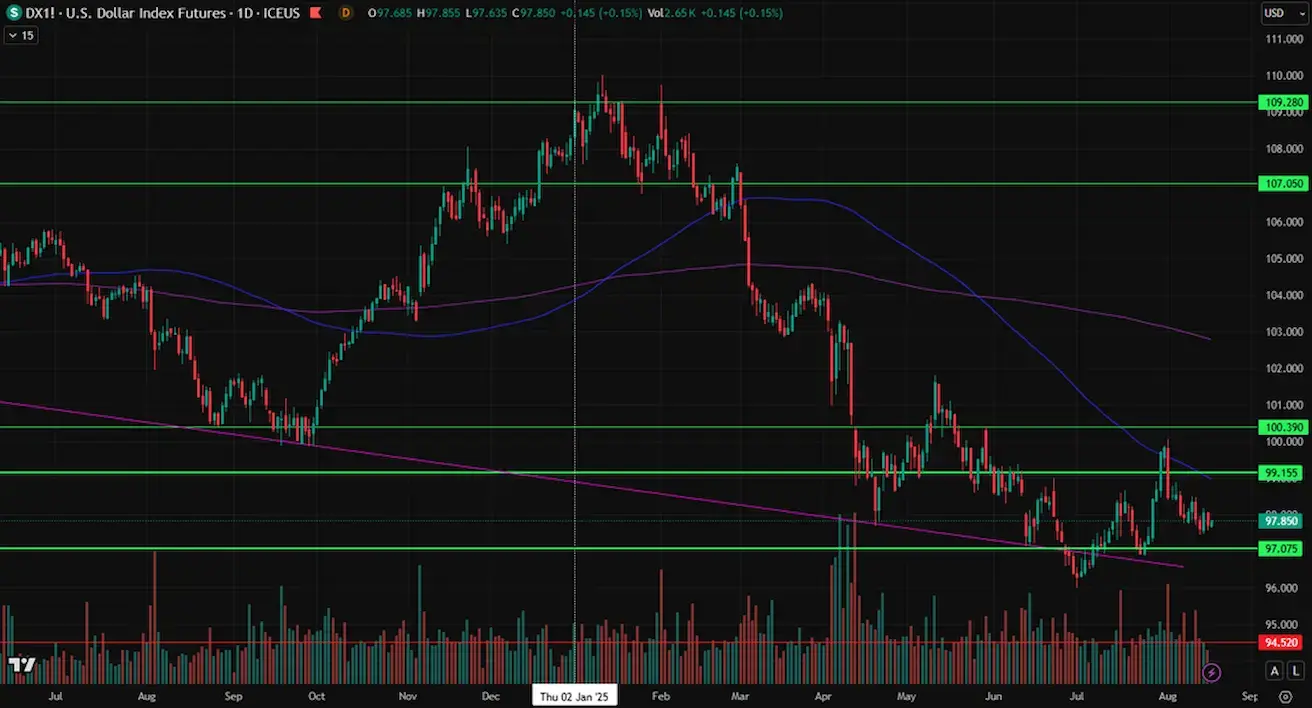
- Dollar Index (DX): -0.10% weekly → 97.605. YTD: -9.90%
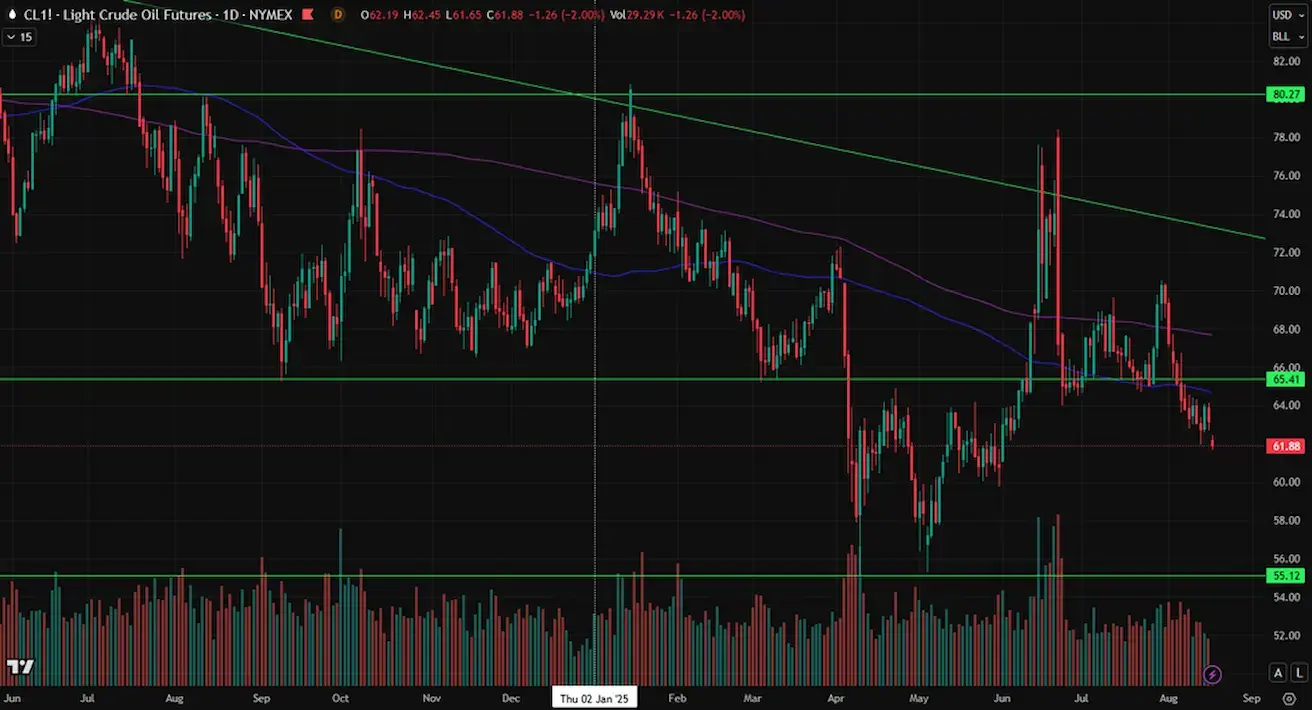
- Oil (WTI, CL): +1.00% weekly → $63.77/bbl. YTD: -11.25%
Crypto
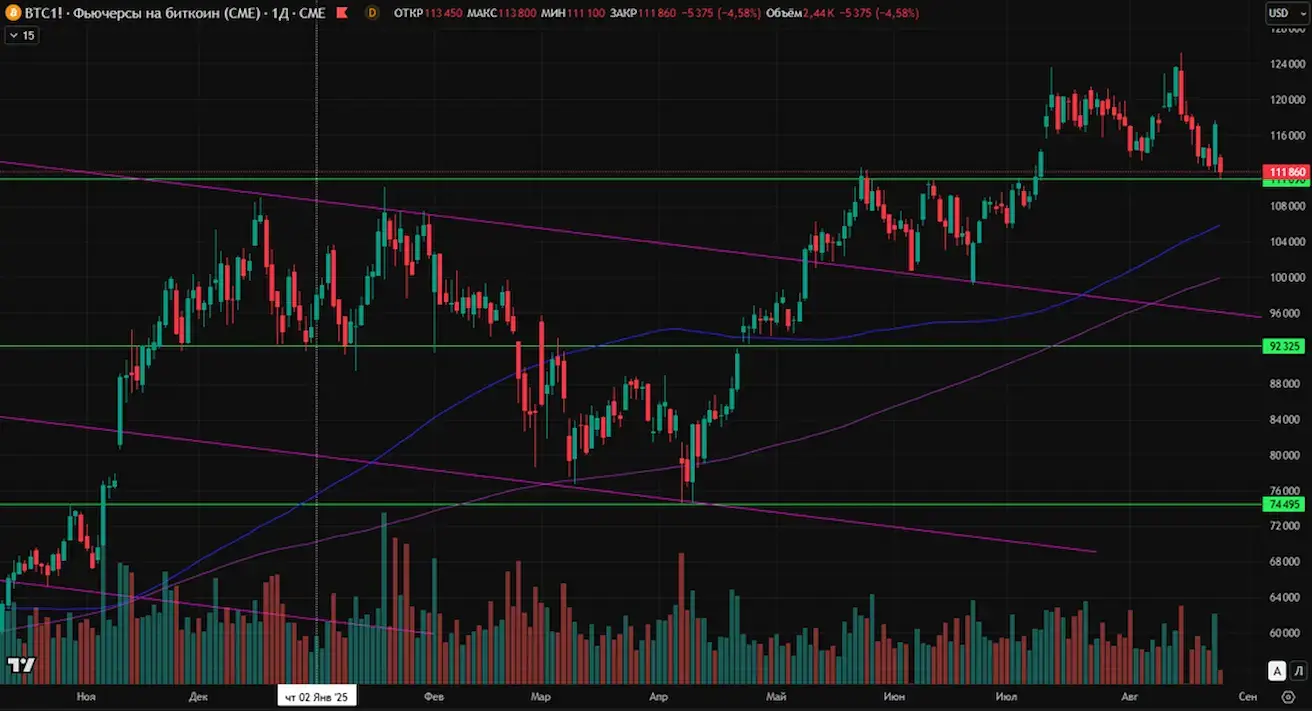
- Bitcoin (futures): -0.3% weekly → $117,235. YTD: +23.06%
- Ethereum (futures): +9.22% weekly → $4,858.5. YTD: +43.57% (new ATH $4880).

Market trends:
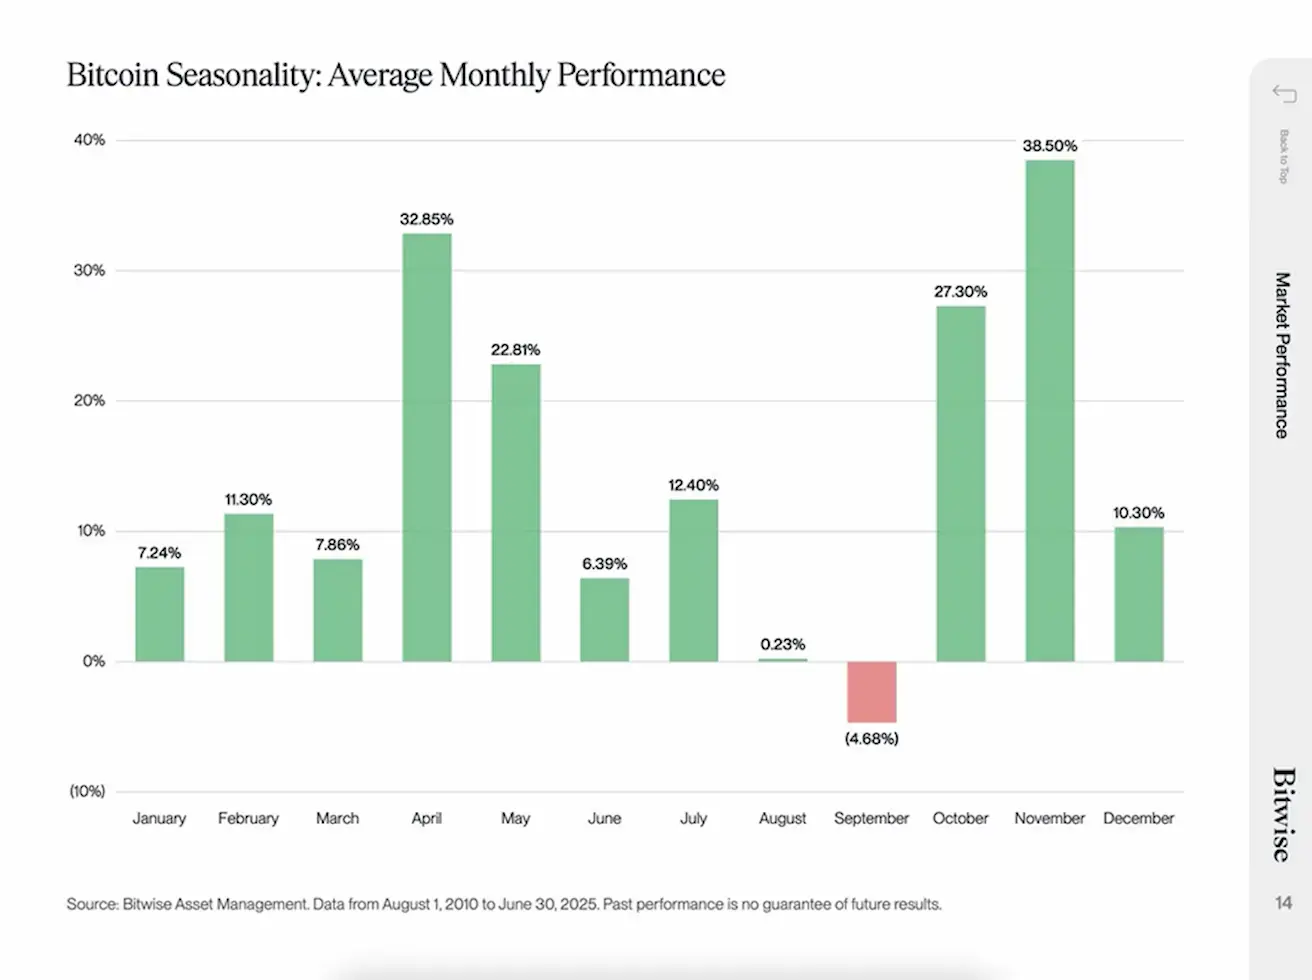
- August & September historically weak for BTC; Oct/Nov among strongest.
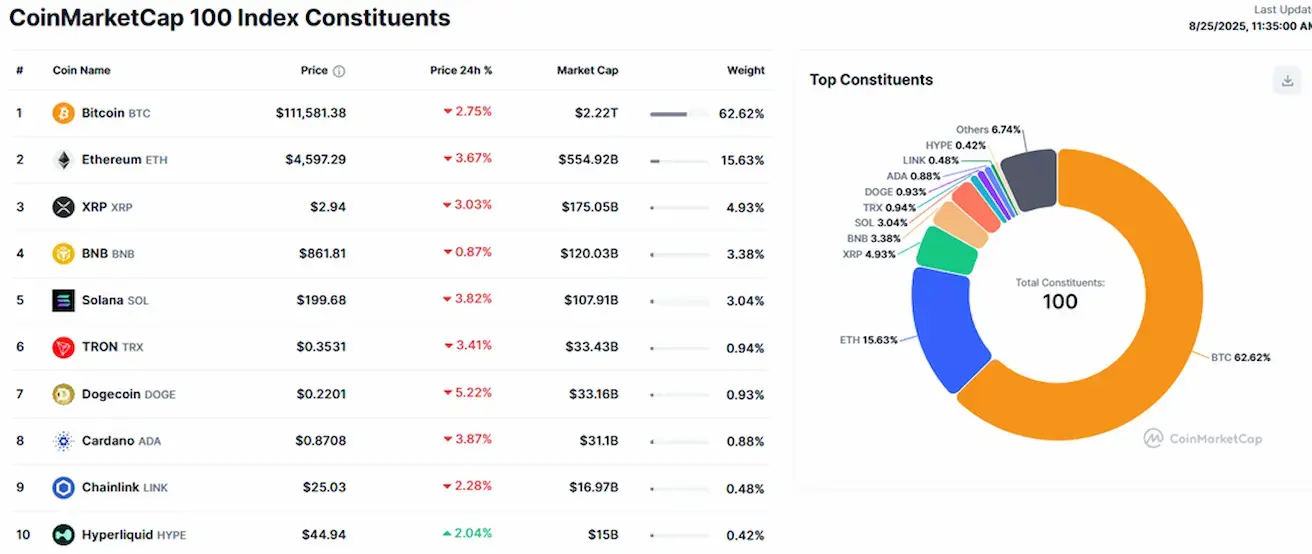
- Crypto market cap: $3.86T (vs $3.89T prior week) (coinmarketcap.com)
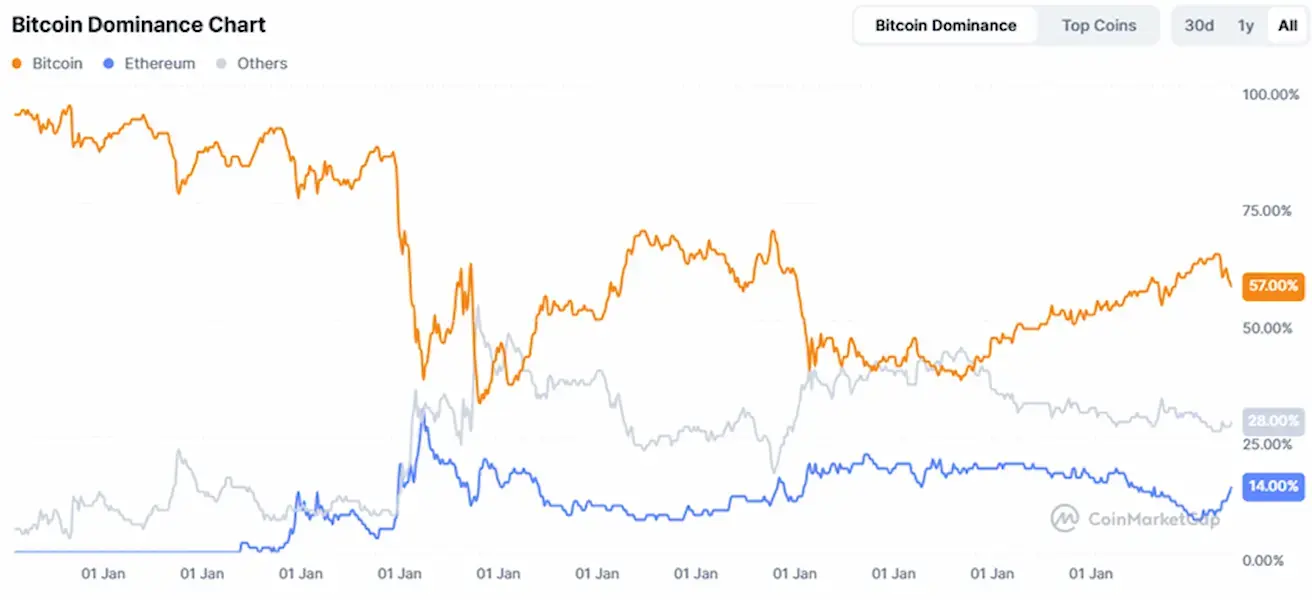
- Bitcoin dominance: 57.5% (down from 59%)
- Ethereum dominance: 14.3% (up from 13.3%)
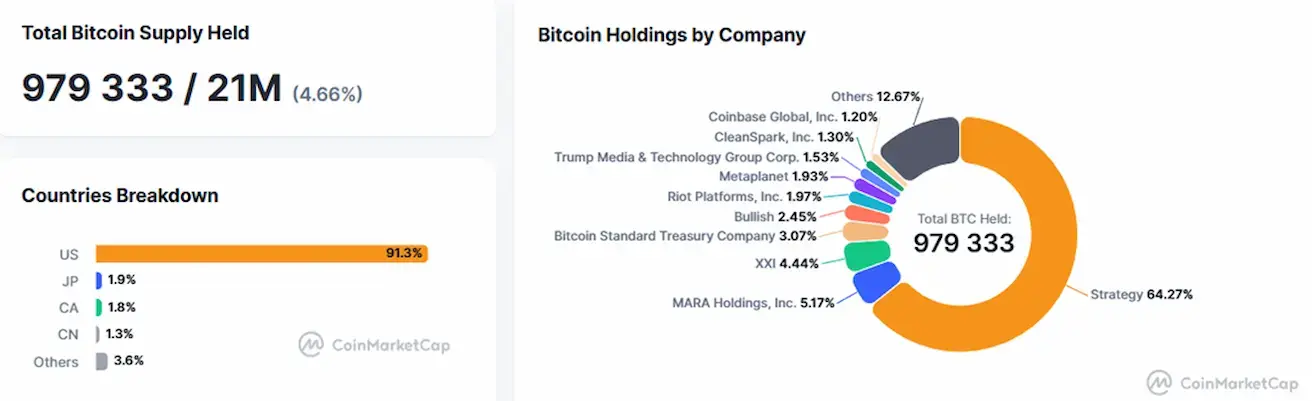
Public companies with a Bitcoin Treasuries strategy. The share of bitcoins on the balance sheets of companies is 4.66% (vs 4.65%) of the total bitcoin supply.
Adoption & Regulation:
- Wyoming launched FRNT stablecoin (USD + Treasuries-backed, not yet public).
- Fed Vice Chair Bowman urged integration of blockchain & digital assets in banks.
- Pennsylvania lawmakers proposed banning state officials from owning crypto.
- China mulls yuan-backed stablecoins as part of RMB internationalization roadmap (centers: Hong Kong & Shanghai).
Currently 99%+ of global stablecoins are USD-pegged. China views digital currencies as a tool to compete with the U.S. dollar amid tensions.