 Lietuvių
 Русский
 Қазақша
 Eesti
EestiAugust 26 — August 30: Weekly economic update
Key market insights

In our weekly column, we share with you the main macroeconomic indicators for the market.
MACROECONOMIC STATISTICS
INFLATION
- Core Consumer Price Index (CPI) (YoY) (June): 3.2%, (pre: 3.3%);
- Consumer Price Index (CPI) (YoY) (June): 2.9%, (pre: 3.0%);
THE FED'S INFLATION TARGET
- Core price index of personal consumption expenditure PCE (YoY) (July): 2.6% (pre: 2.6%);
- The price index of personal consumption expenditures (YoY) (July): 2.5%, (pre: 2.5%)
INFLATION EXPECTATIONS
- 12-month expected inflation (August): 2.8%, (pre: 2.9%);
- 5-year expected inflation (August): 3.0% (pre: 3.0%).
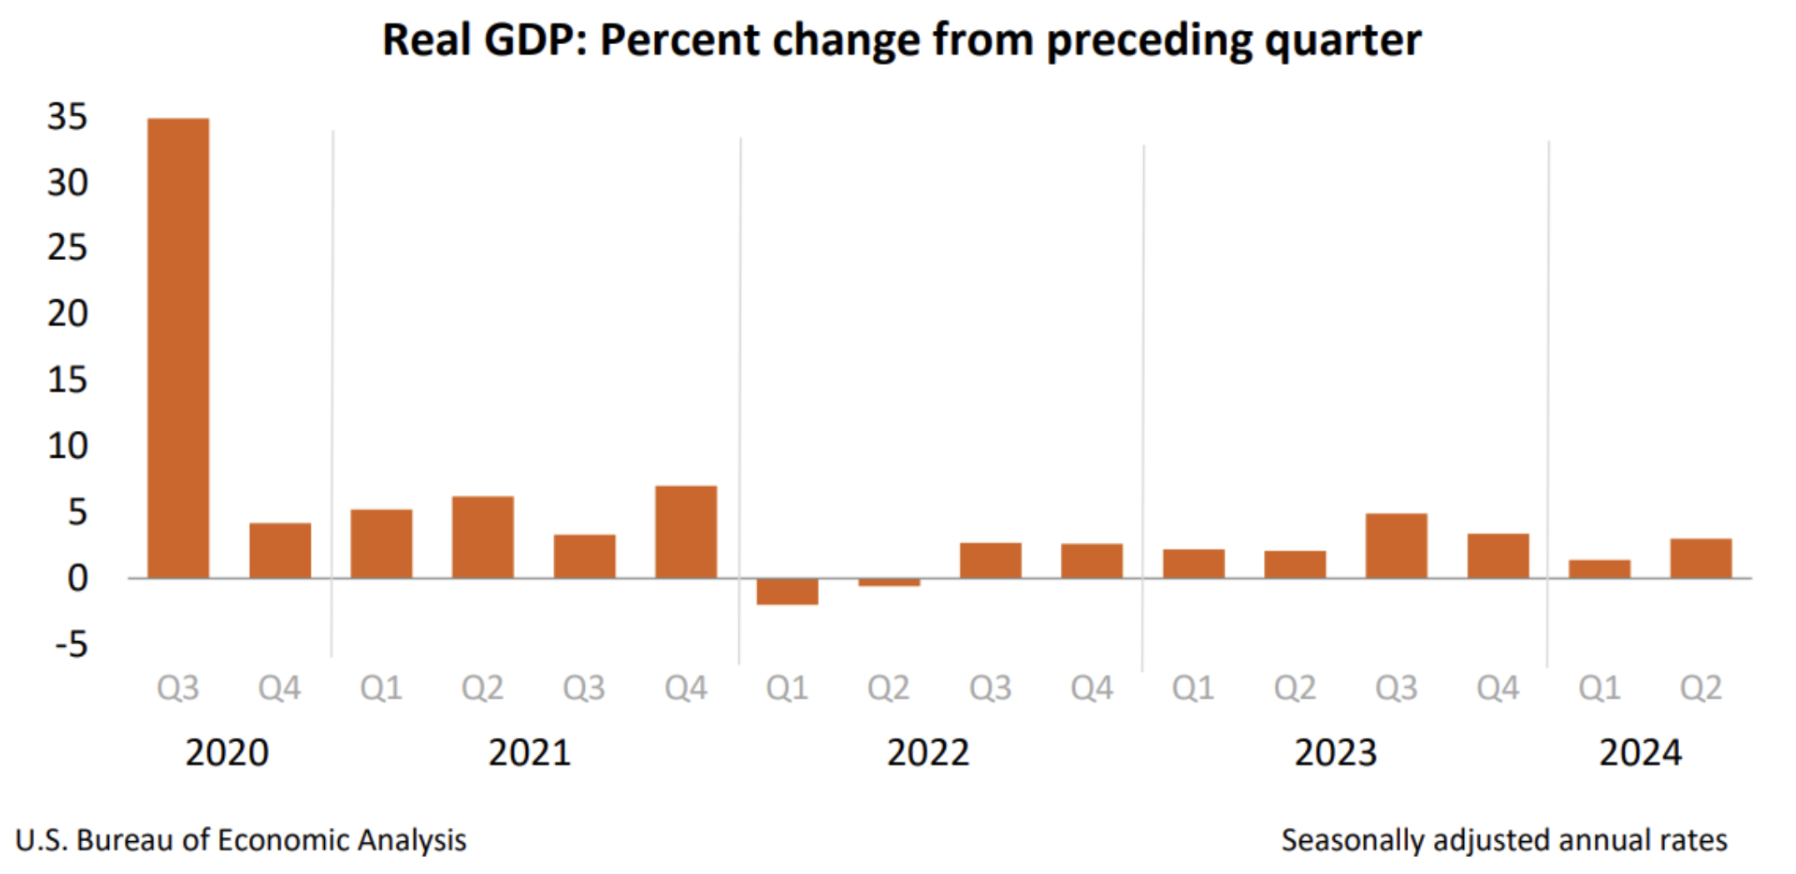
GDP (q/q) (2Q.) (preliminary estimate): 3.0% (first: 2.8%, pre: 1.4%), GDP deflator (q/q) (2 Q.): 2.5% (pre: 3.1%).
BUSINESS ACTIVITY INDEX (PMI)
- Services sector (June): 55.2 (pre: 55.0);
- Manufacturing sector (August): 48.0 (pre: 49.6, review).
- S&P Global Composite (June): 54.1 (pre: 54.3, review).
LABOR MARKET
- Unemployment rate (July): 4.3% (pre: 4.1%);
- Change in non-farm private sector employment (June): 97K, (pre: 136K);
- Average hourly earnings (June, YoY): 3.6%, (pre: 3.8%);
- Number of initial applications for unemployment benefits: 231K, (pre: 233K)
MONETARY POLICY
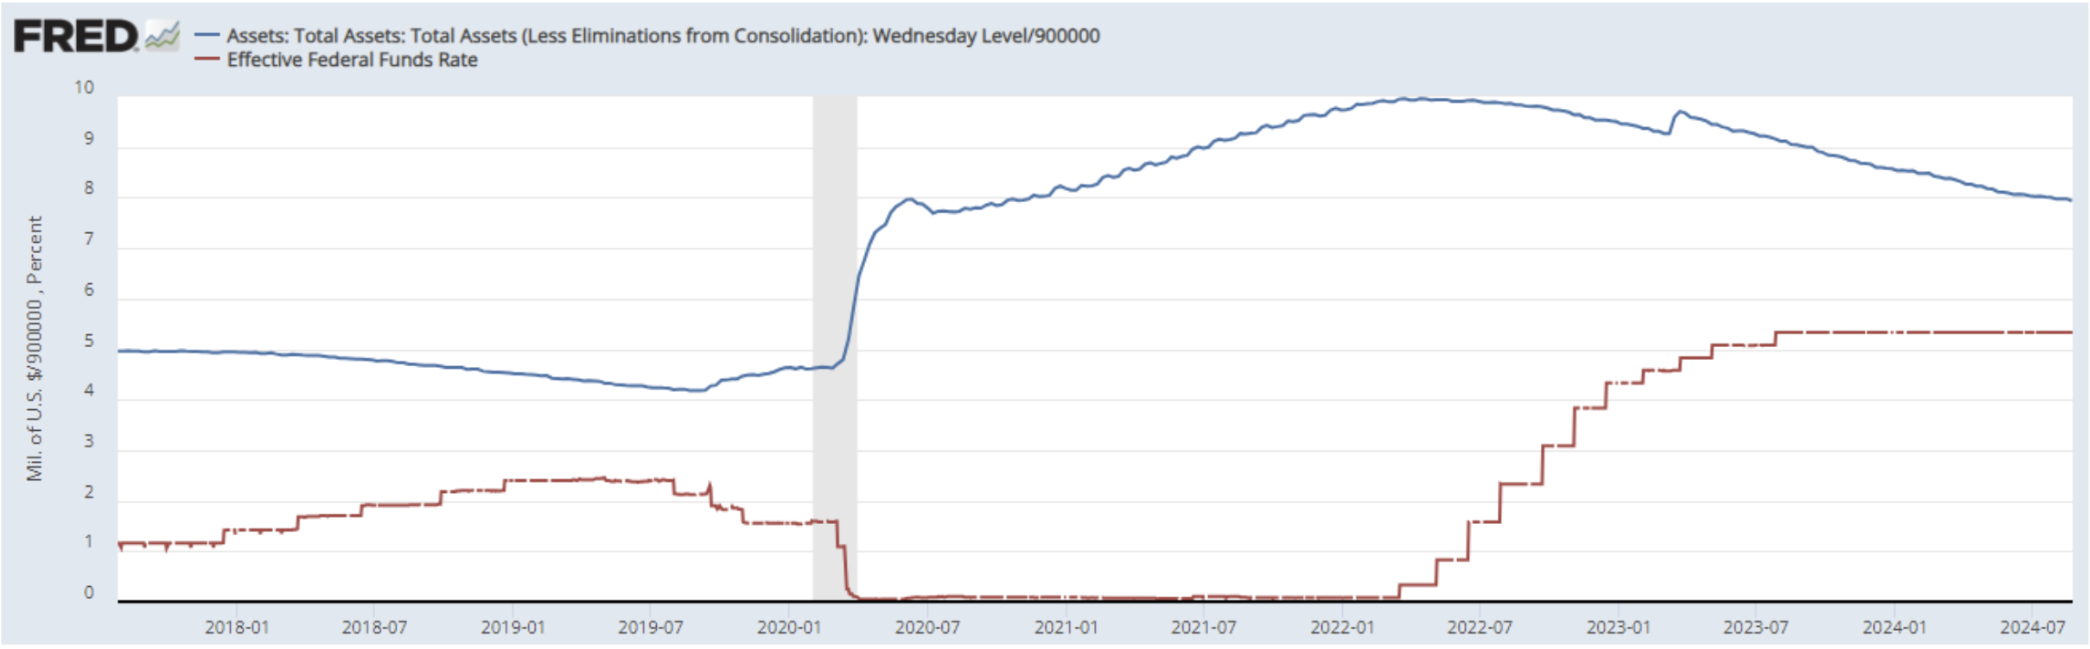
- Federal Funds Rate (EFFR) — 5.50% (in red line)
- Federal Reserve balance sheet continues to decline at a slower pace: $7.12 trillion, (pre: $7.139 trillion)
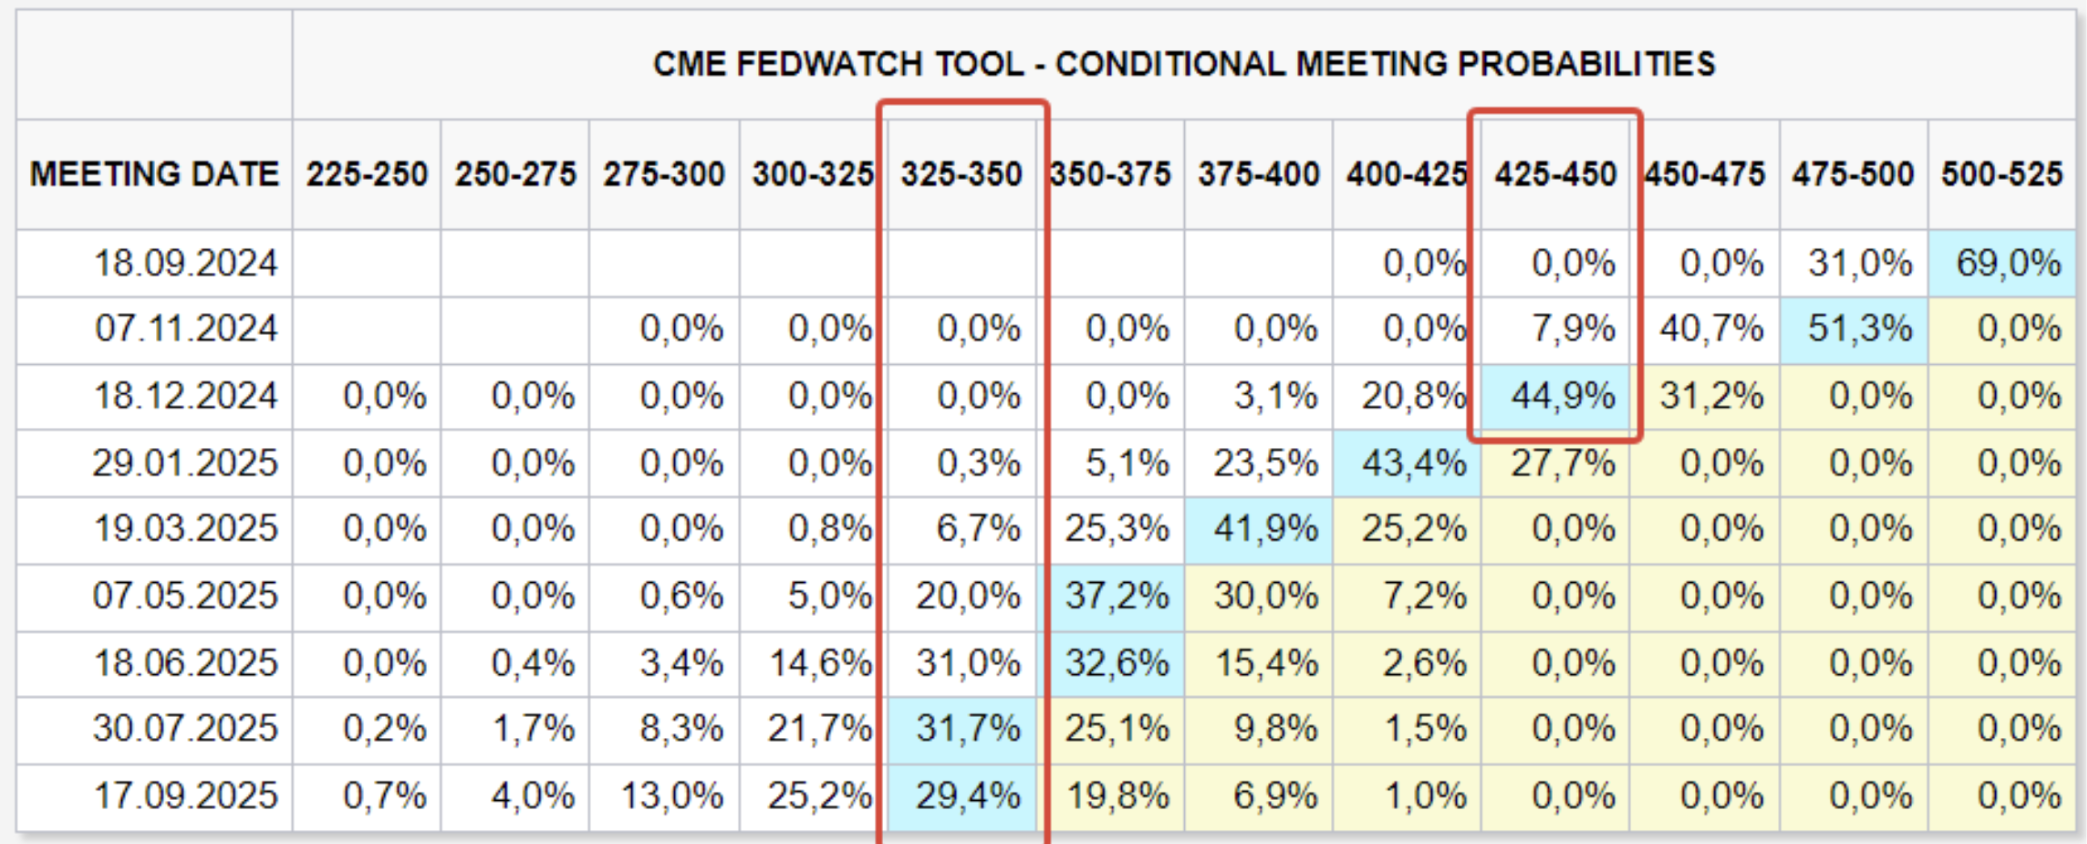
MARKET FORECAST RATE (FEDWATCH)
Today:
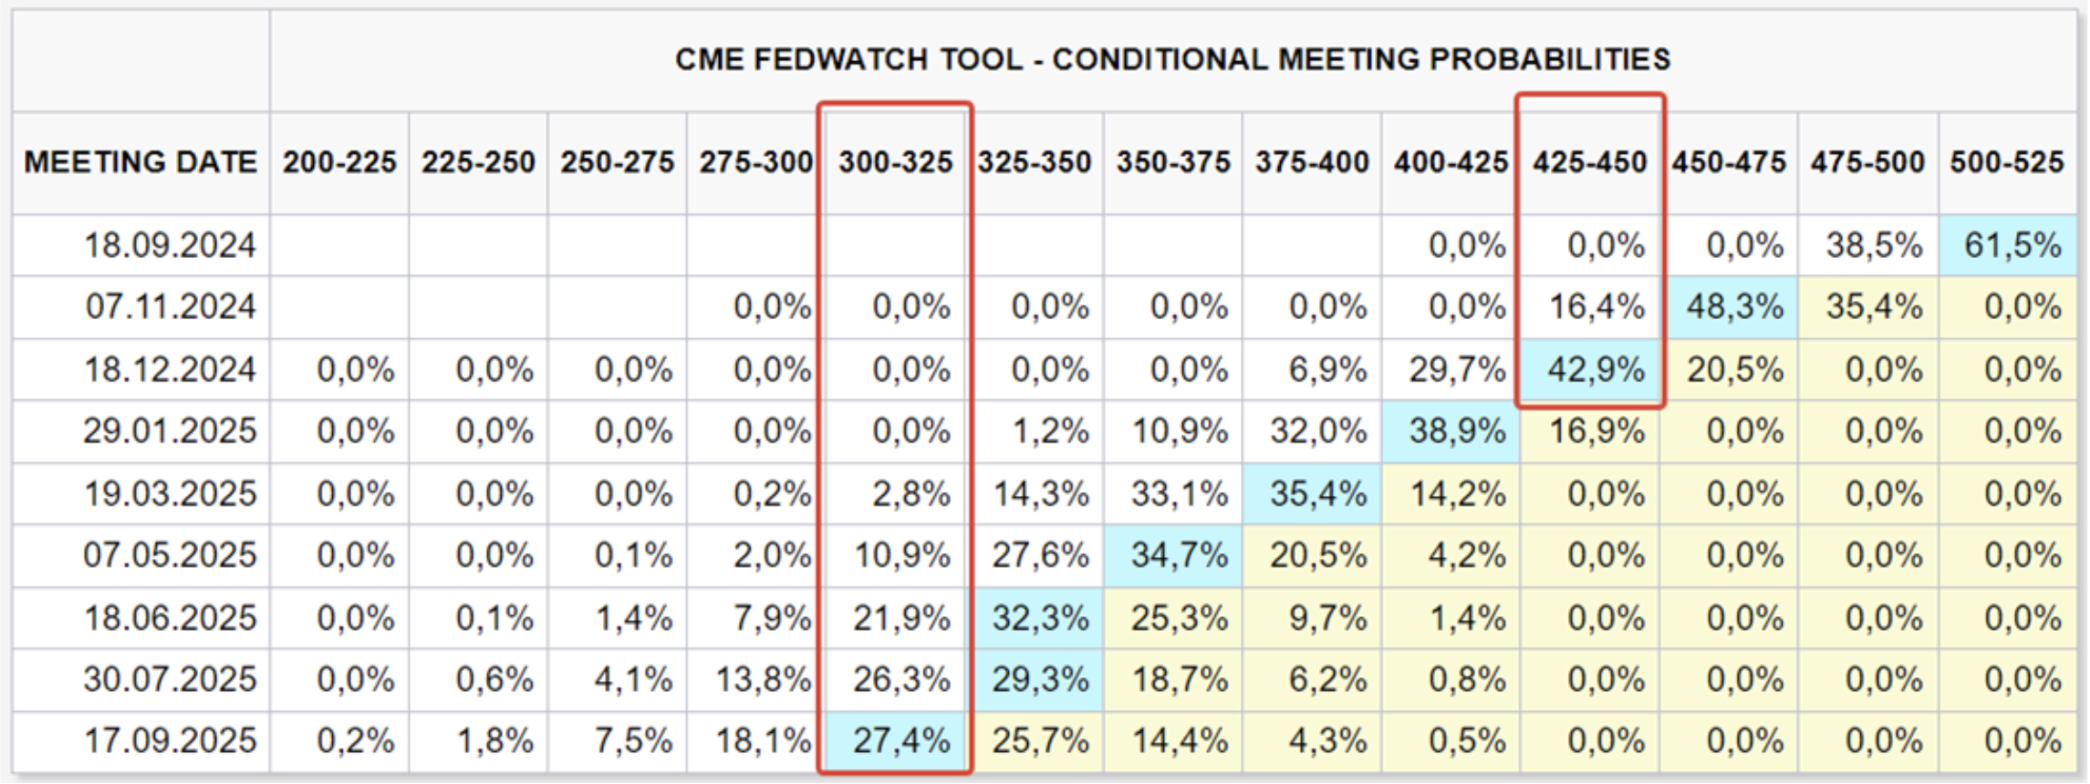
A week ago:
COMMENTARY
Fed Rhetoric: San Francisco Fed President Mary Daly agrees with Powell’s view that it’s time to lower rates and believes it’s appropriate for the US central bank to start reducing interest rates. Commentary
- The Federal Reserve does not focus on the Consumer Price Index (CPI) but rather on the Personal Consumption Expenditures (PCE) price index.
- Statistics show that in July, the PCE increased by 0.16% month-over-month and 2.50% year-over-year, while the core index rose by 0.16% month-over-month and 2.6% year-over-year. These current levels allow the Fed to soften its rhetoric, but it's important to note that the decline halted in August, both on a monthly and yearly basis.
- The US real Gross Domestic Product (GDP) grew by 3.0% in annual terms in the second quarter of 2024, compared to the initial estimate of 2.8% and 1.4% in the first quarter.
- Growth in the second quarter was primarily driven by an increase in consumer spending, private inventory investments, and business investments.
- As a result, economic conditions in the U.S. remain resilient: consumer spending and retail sales are growing, the second GDP estimate was revised upwards, and forecasts for the third quarter are also being revised higher. Notably, inflation expectations continue to decline against this backdrop.
- Current Fed rhetoric is geared towards easing monetary policy in September. According to FedWatch, the expectation is for a 1% rate cut by the end of 2024 (target range 4.25-4.50%), and a 2.00% cut within the next 12 months (target range 3.25-3.50%). GDP Forecast from the International Monetary Fund (IMF):
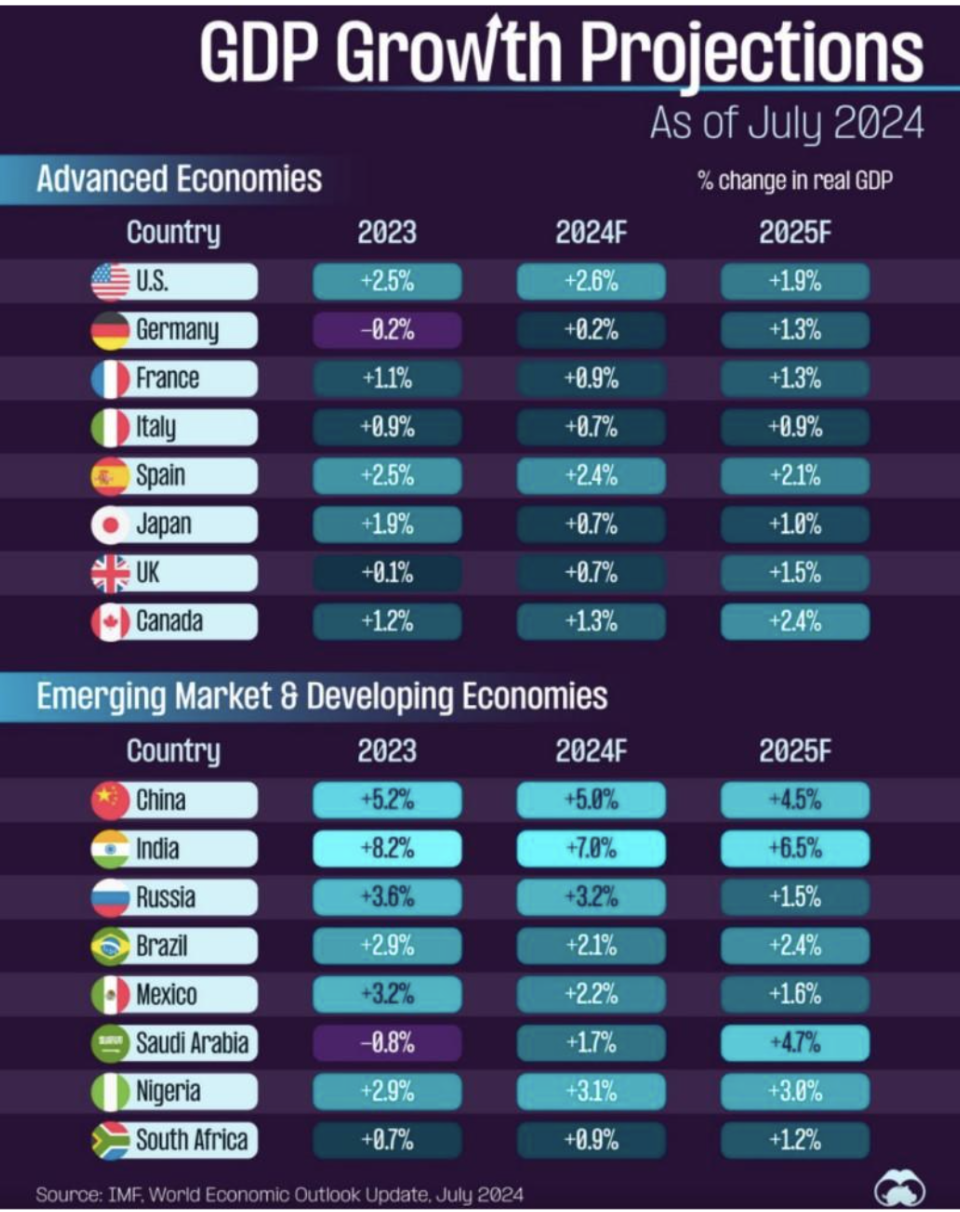
Leaders of Growth: India, China (second place). The GDP growth in the top four EU countries is averaging 1.4%. The GDP forecast for the United States in 2025 is 1.9%. Key takeaway from this infographic: There are no recession scenarios projected for 2024-2025, neither in developed economies nor in emerging markets.
MARKET
MARKET CAP PERFORMANCE
The stock market:
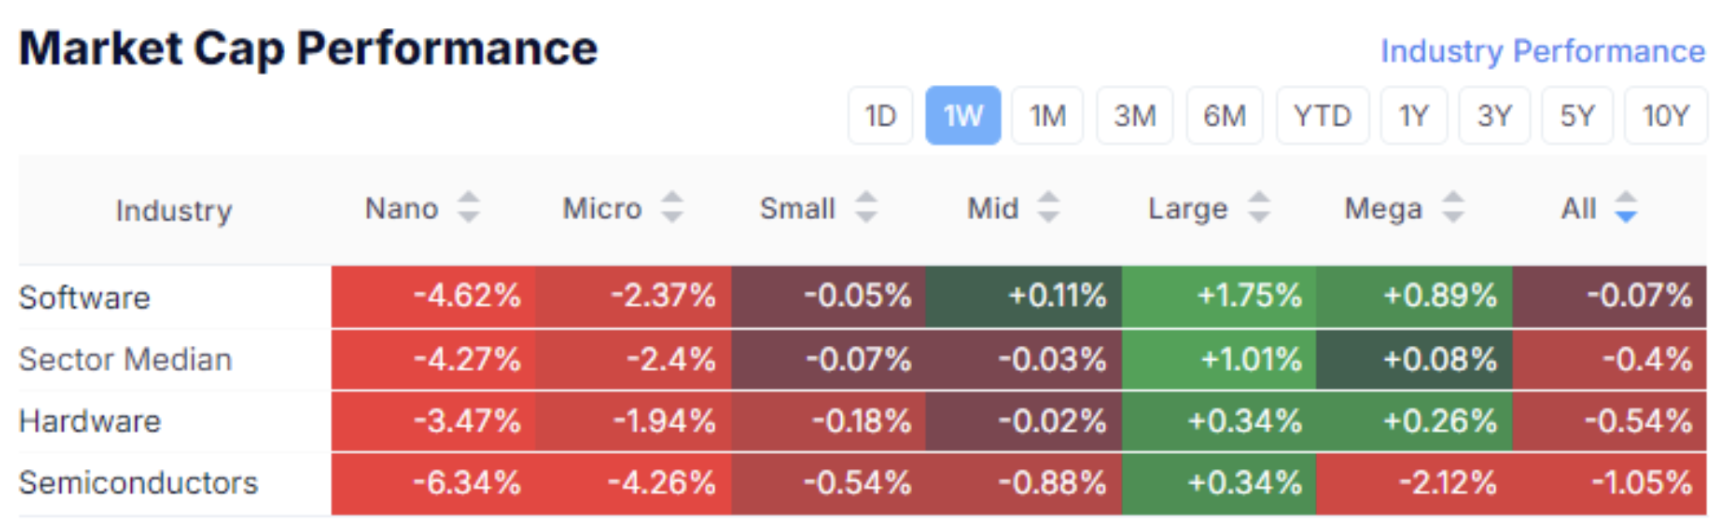
Technology sector:
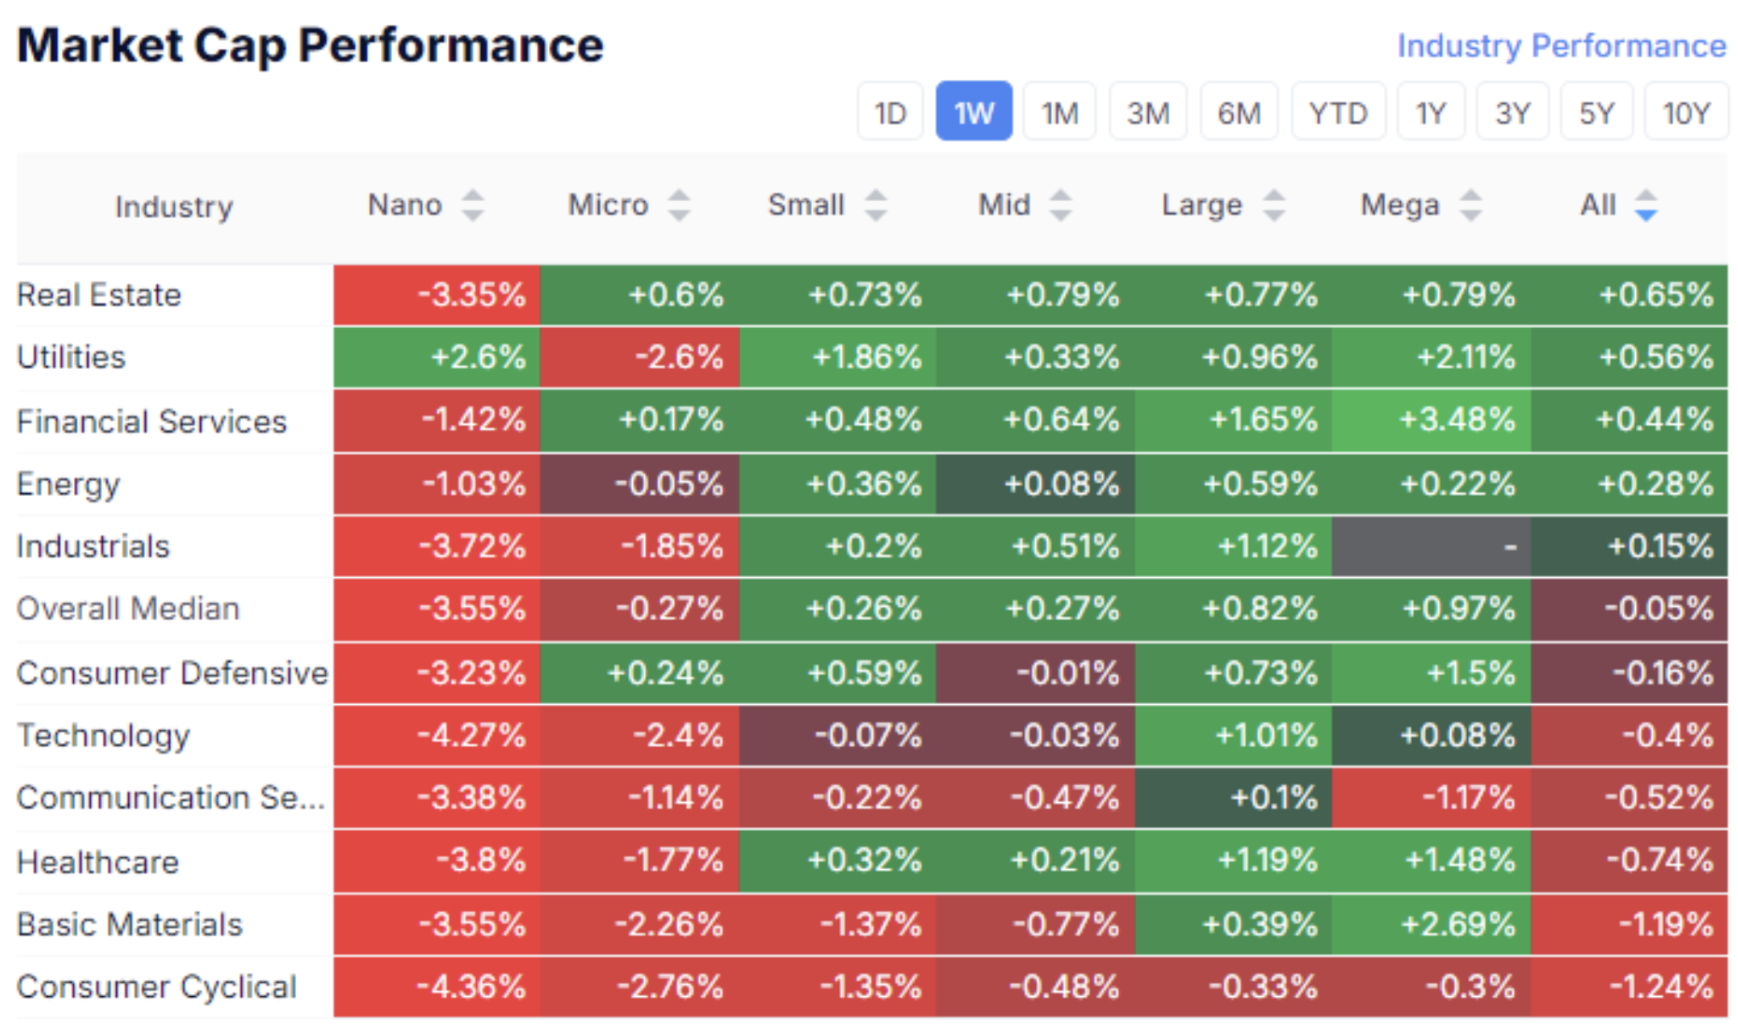
Last week, investment interest was primarily focused on large-cap stocks, with the median market growth at 0.15%.
The leaders were the real estate sector (0.65%) and the utilities sector (0.56%). The laggard was the consumer discretionary sector, where declines were observed across several capitalizations—this trend indicates a slight decrease in risk appetite.
SP500
Vix
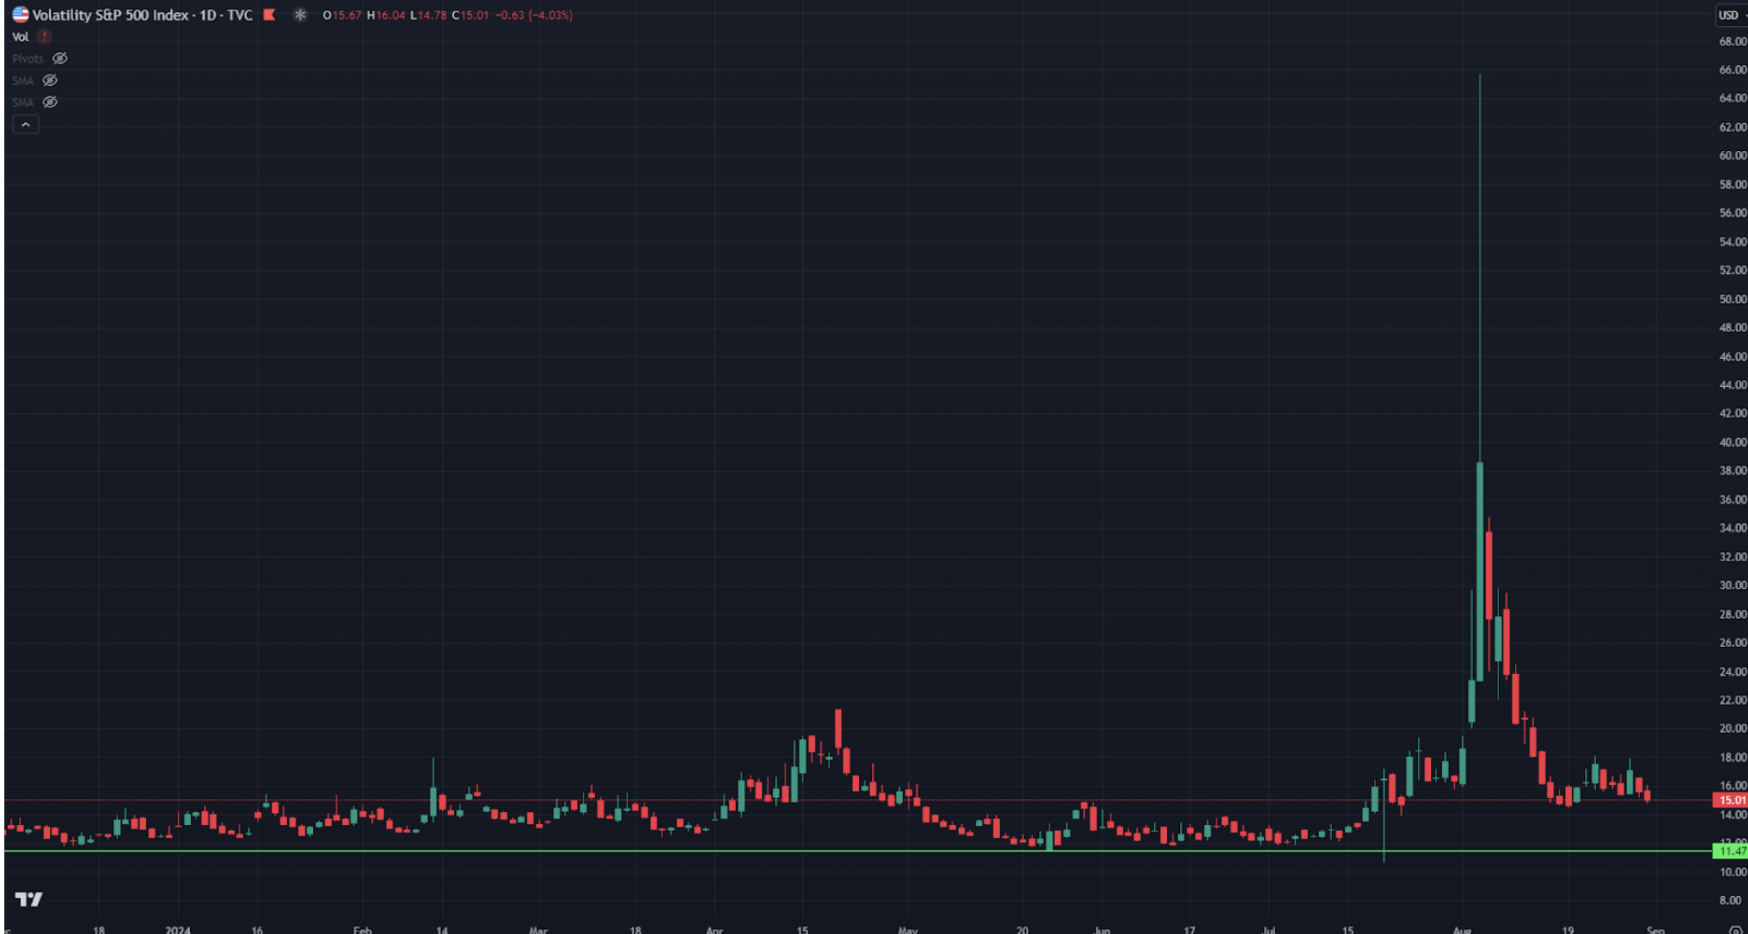
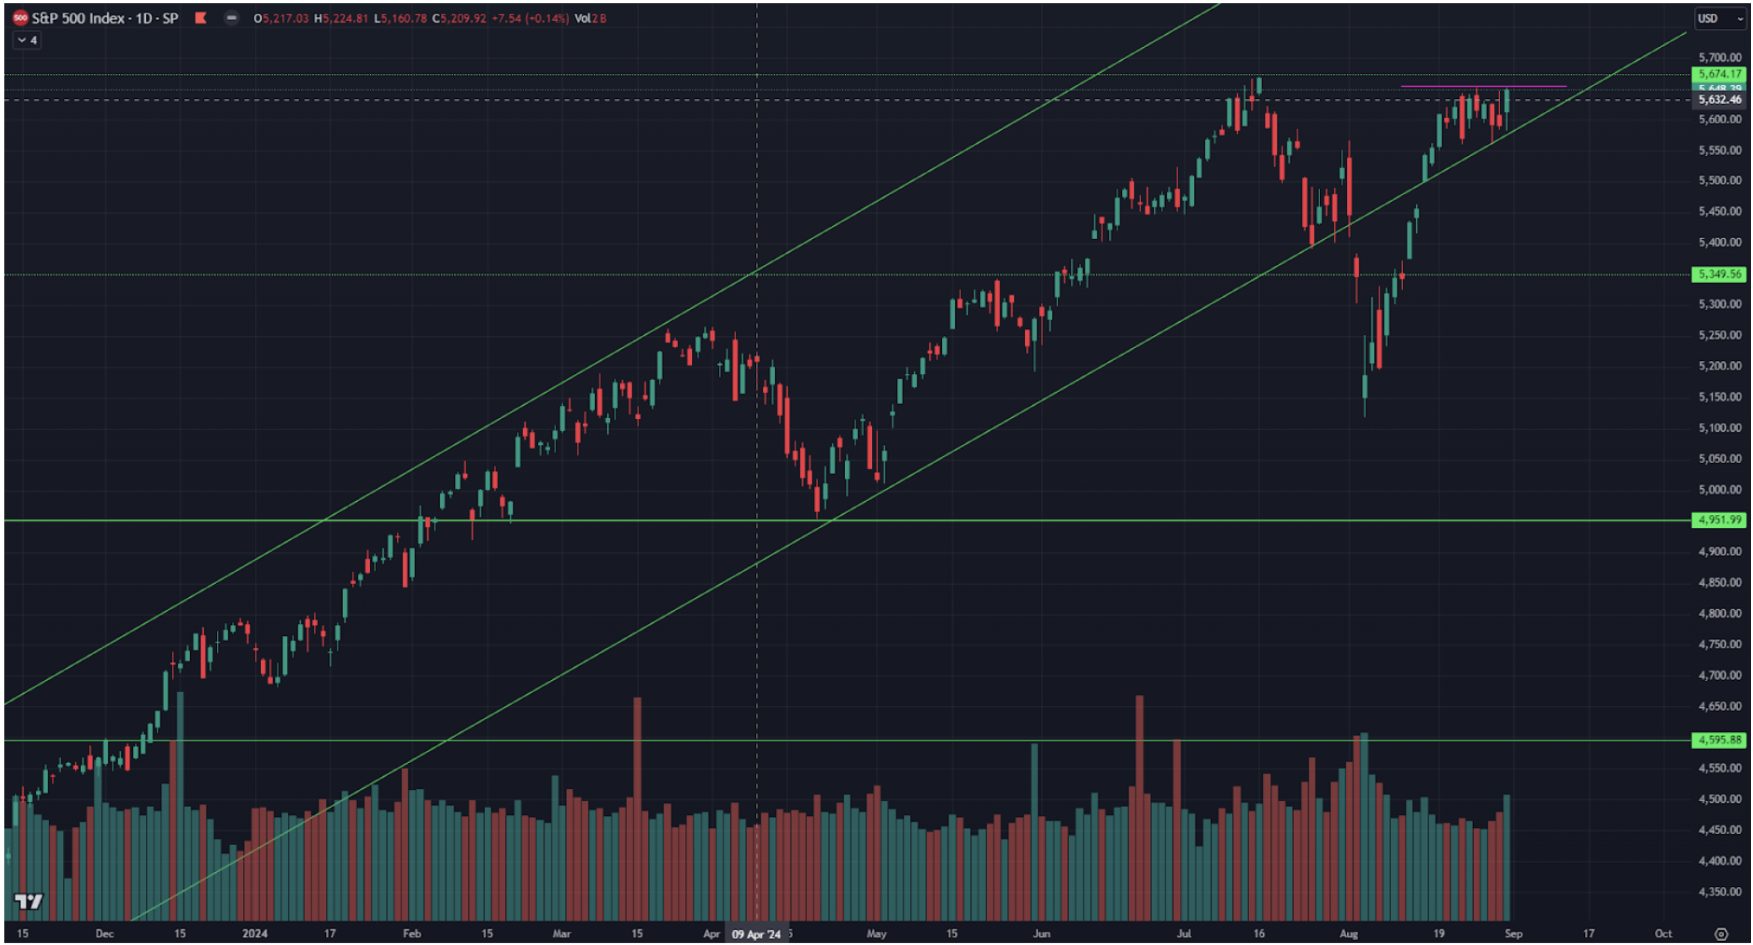
The S&P 500 index saw almost no growth over the week, with the price consolidating just below the resistance range of 5650-5680.
This range represents the historical maximum, and additional growth triggers are needed to break through it. The current positive macroeconomic statistics are insufficient for this, as the market was anticipating strong earnings from NVIDIA (NVDA).
NVDA:
Gross profit
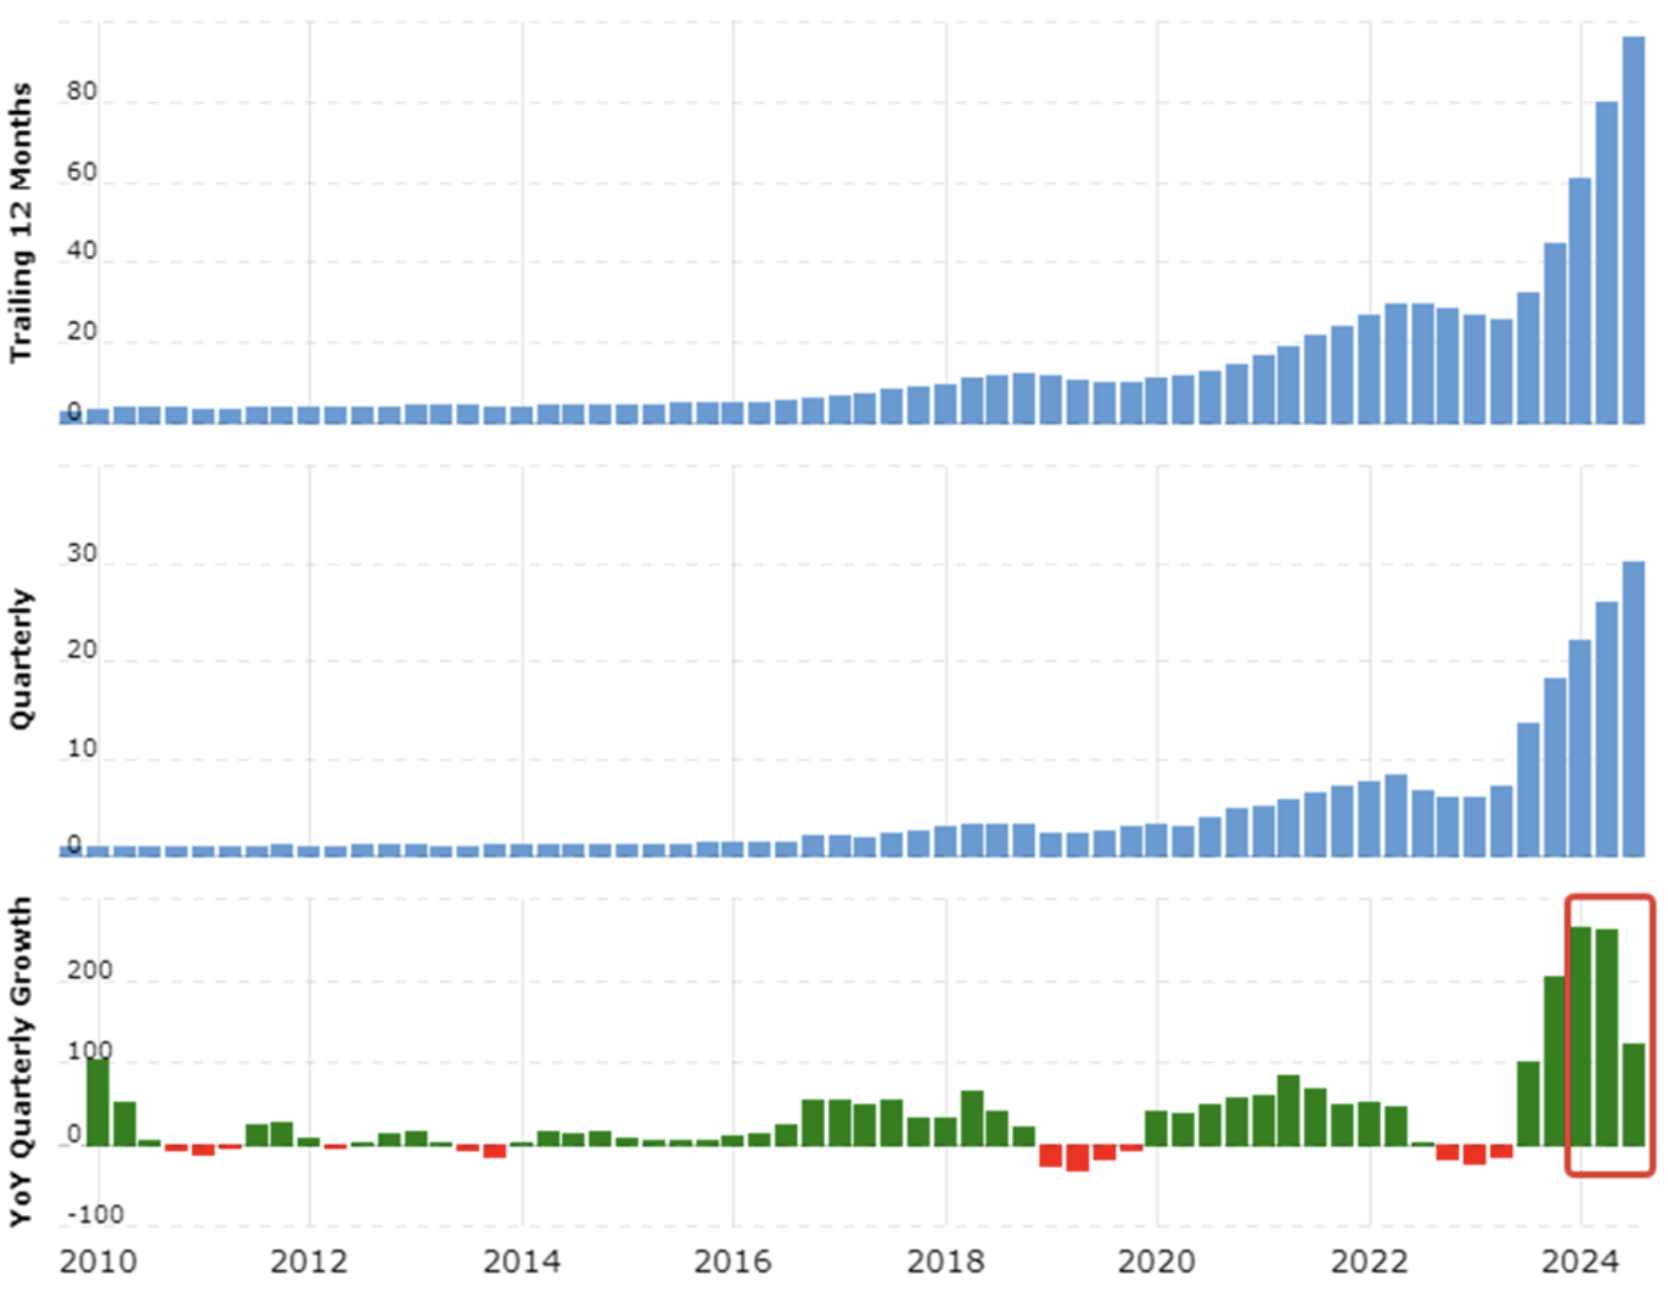
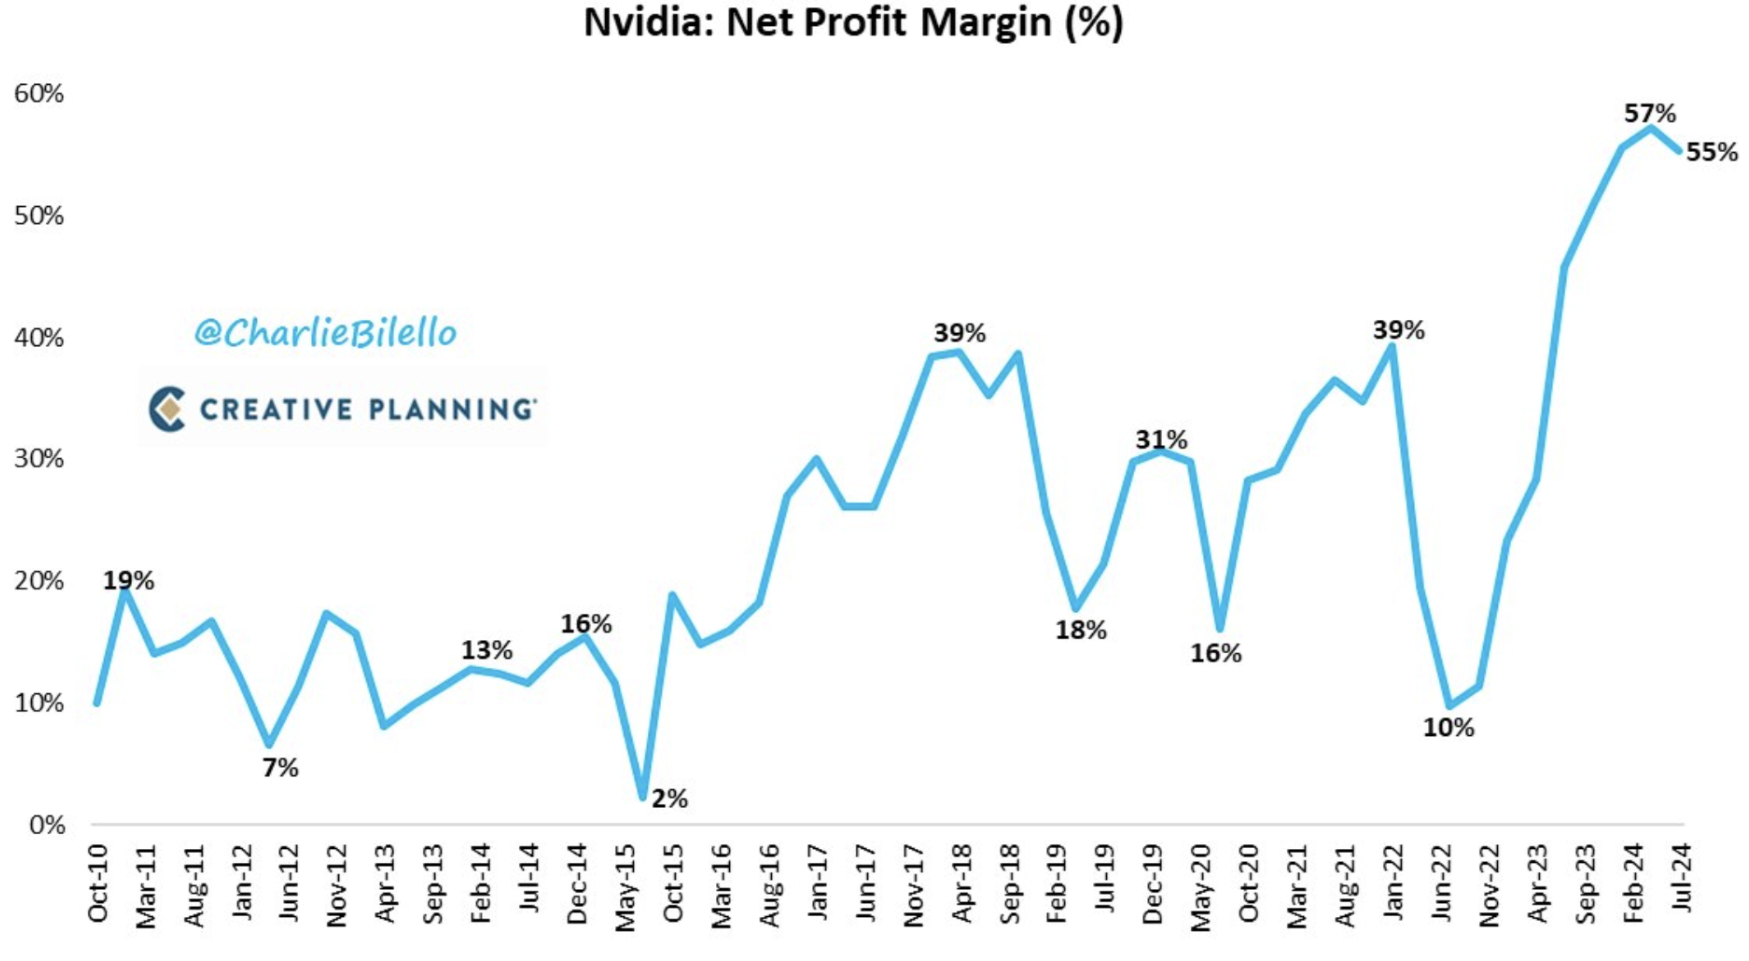
Nvidia reported solid profits for the second quarter, but growth has slowed compared to previous quarters. In the top chart, I've highlighted the slowing growth in gross revenue quarter-over-quarter in percentage terms. Below, the graph shows a decline in net profit margin from 57% to 55%. This marks the first decrease in profit margin since the second quarter of 2022.
Most notably, the management presented a revenue forecast that was below the optimistic market expectations, heightening concerns that the explosive growth of the company is tapering off.
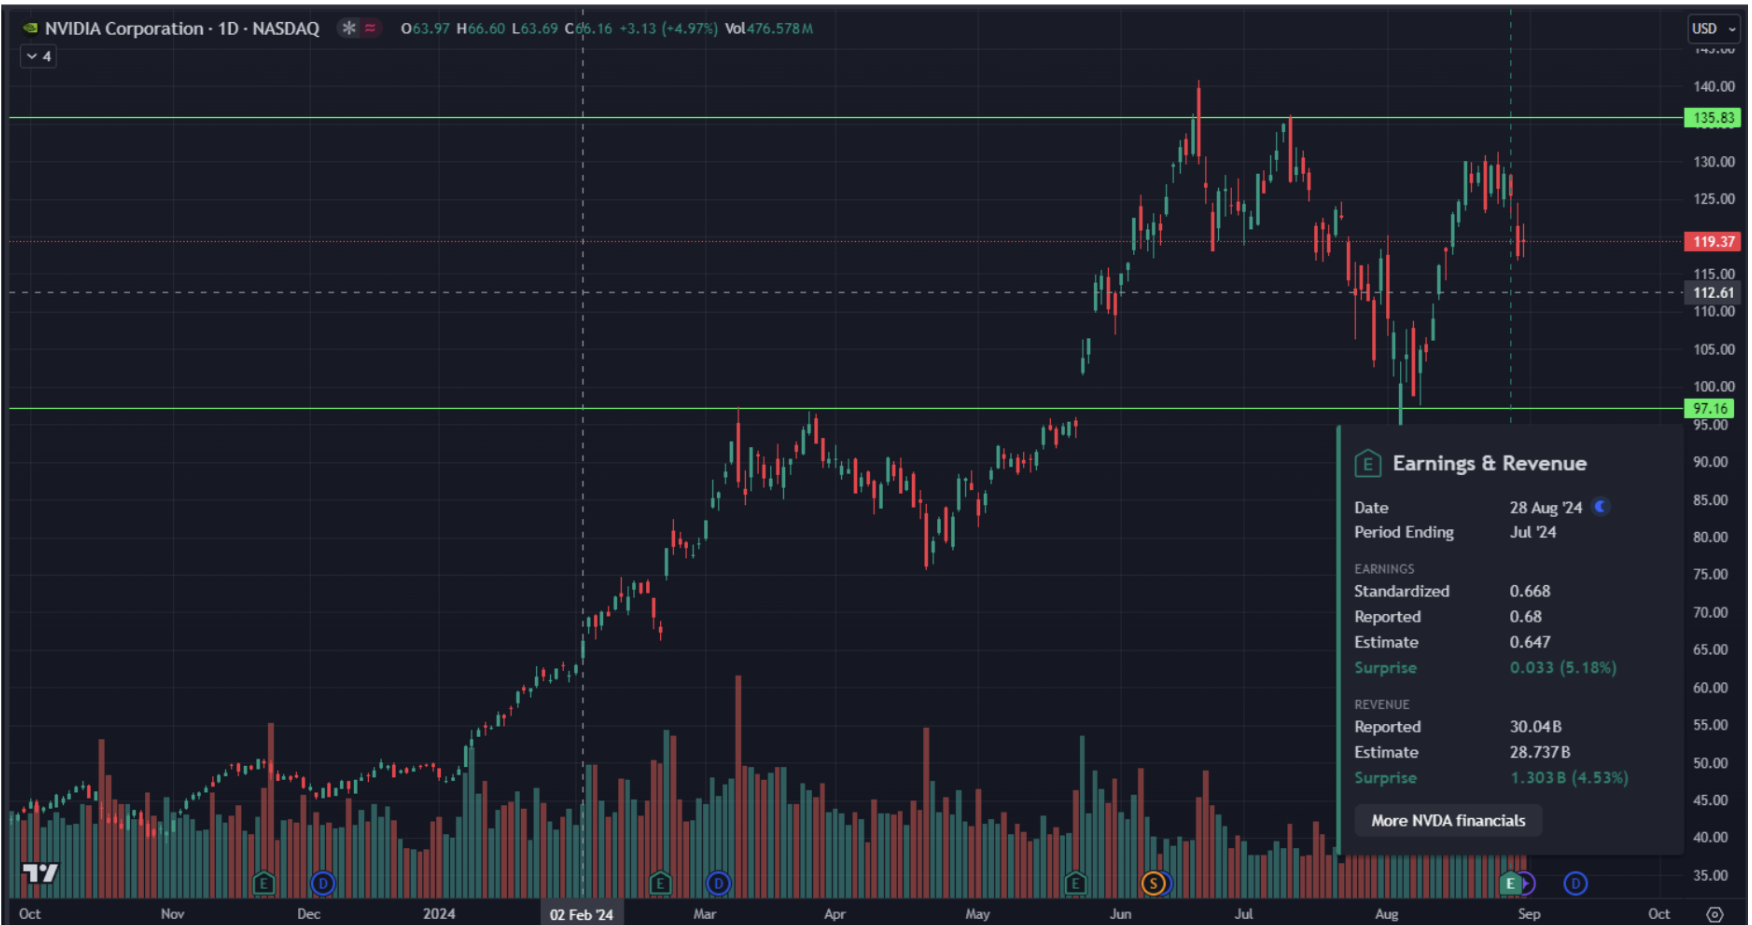
As a result, NVDA shares dropped by 5% following the report. From a technical standpoint, a horizontal channel might form in the $135-$100 per share range. However, final spikes above the peak are not ruled out, which often occurs with volatile stocks before corrections. Despite the lack of strong competitors and the stock's long-term growth potential, the likelihood of a correction in the short to medium term is increasing.
TREASURY MARKET
Treasury Bonds UST10:
YIELDS
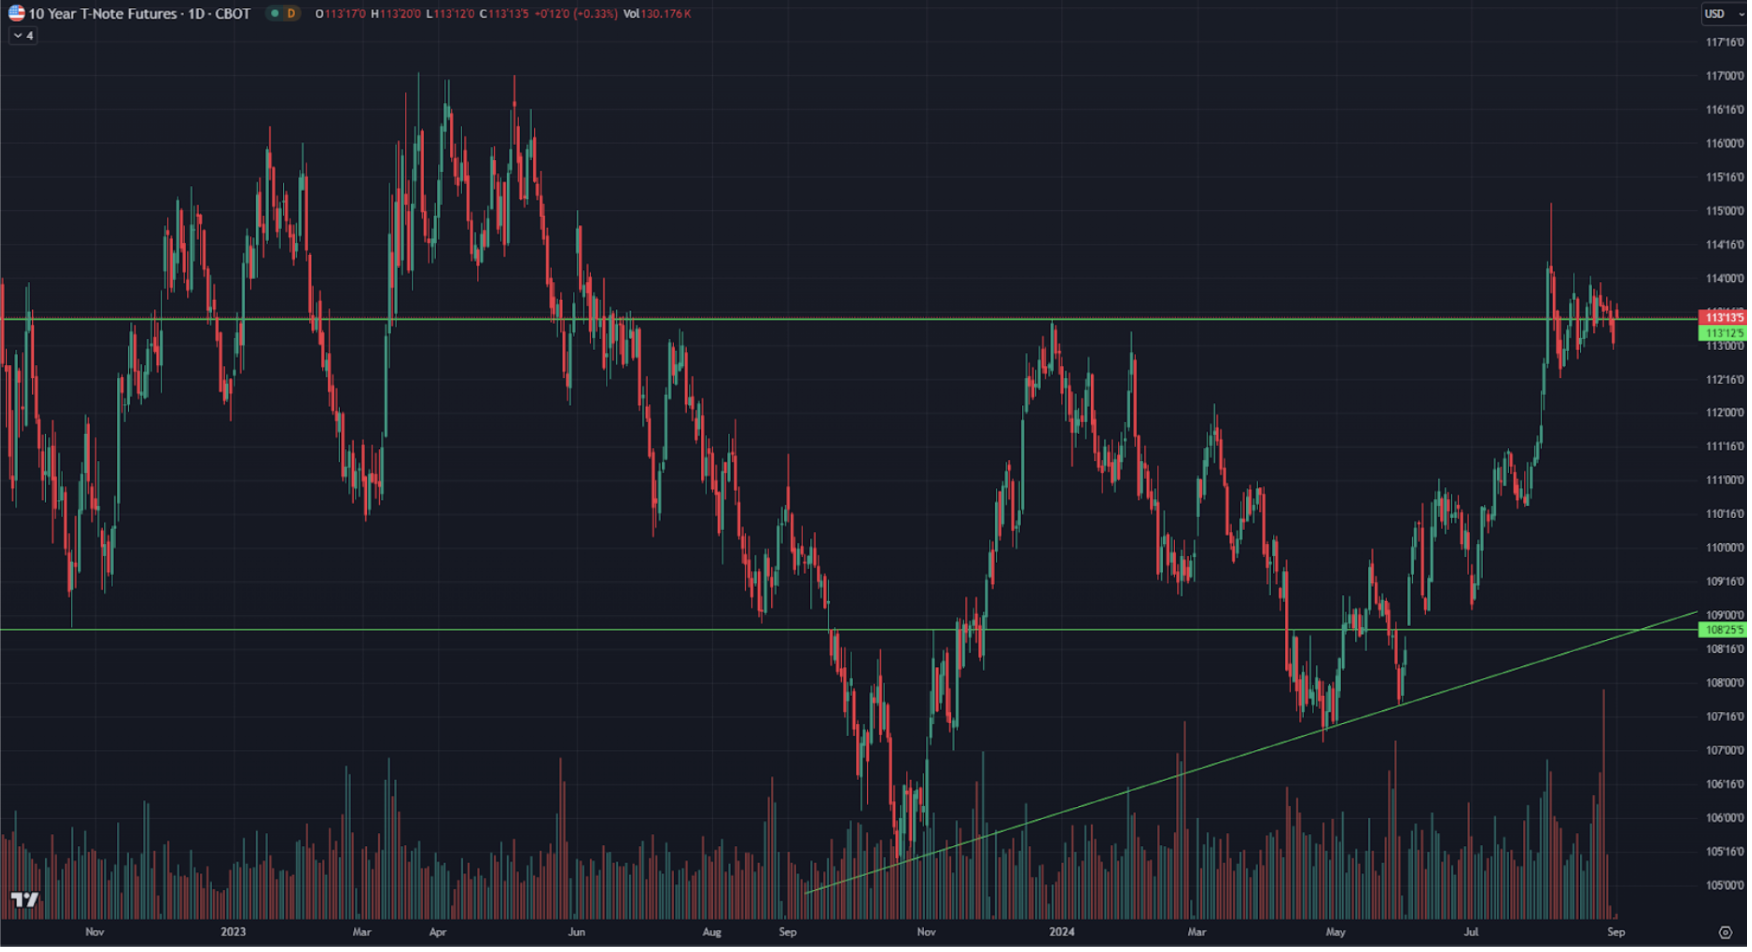
The Treasury bond market, like the stock market, showed little movement over the week.
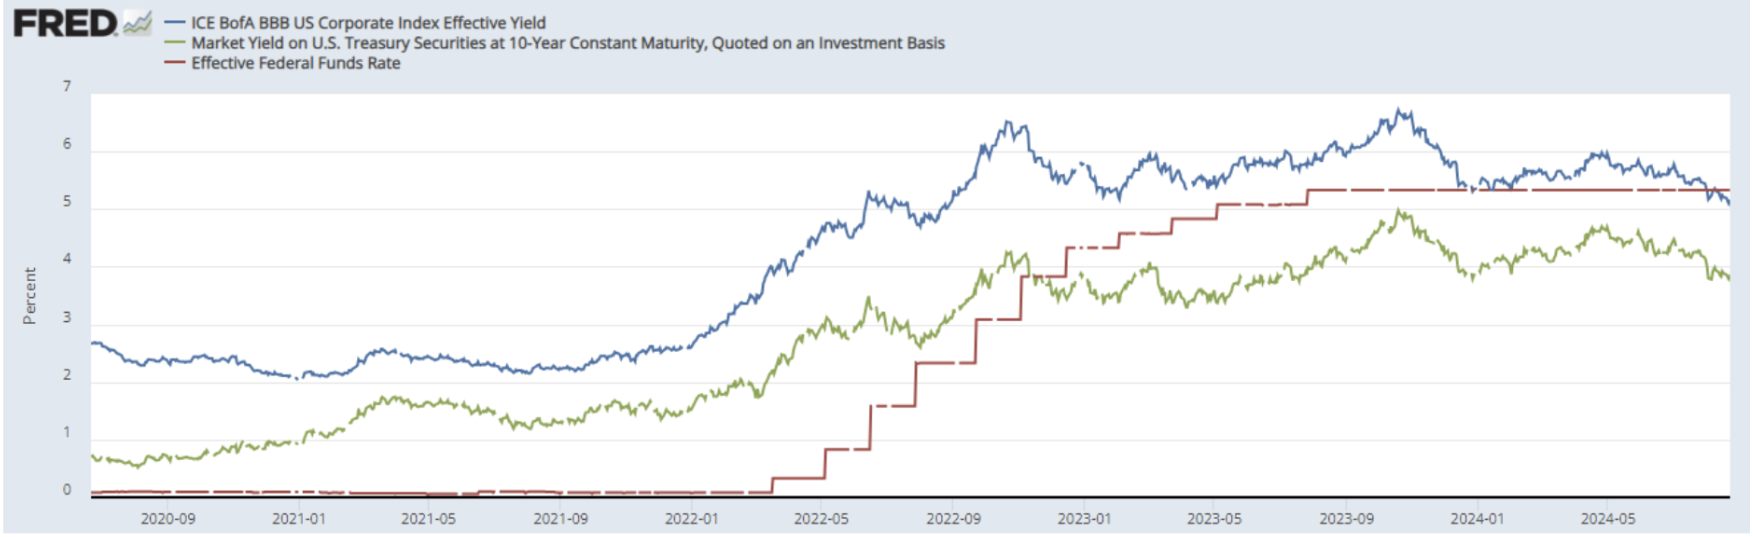
The price has been consolidating for two months at the upper boundary of a horizontal channel. In the lower chart, we see the spreads. The market yield on 10-year U.S. Treasury securities (green line) rose by 0.01% to 3.86%. The yield on the BBB-rated corporate index (blue line) decreased by 0.04% to 5.12%. The spread between them continued to narrow, now standing at 1.26% compared to 1.30% last week. The yields on both of these instruments are below the federal funds rate.
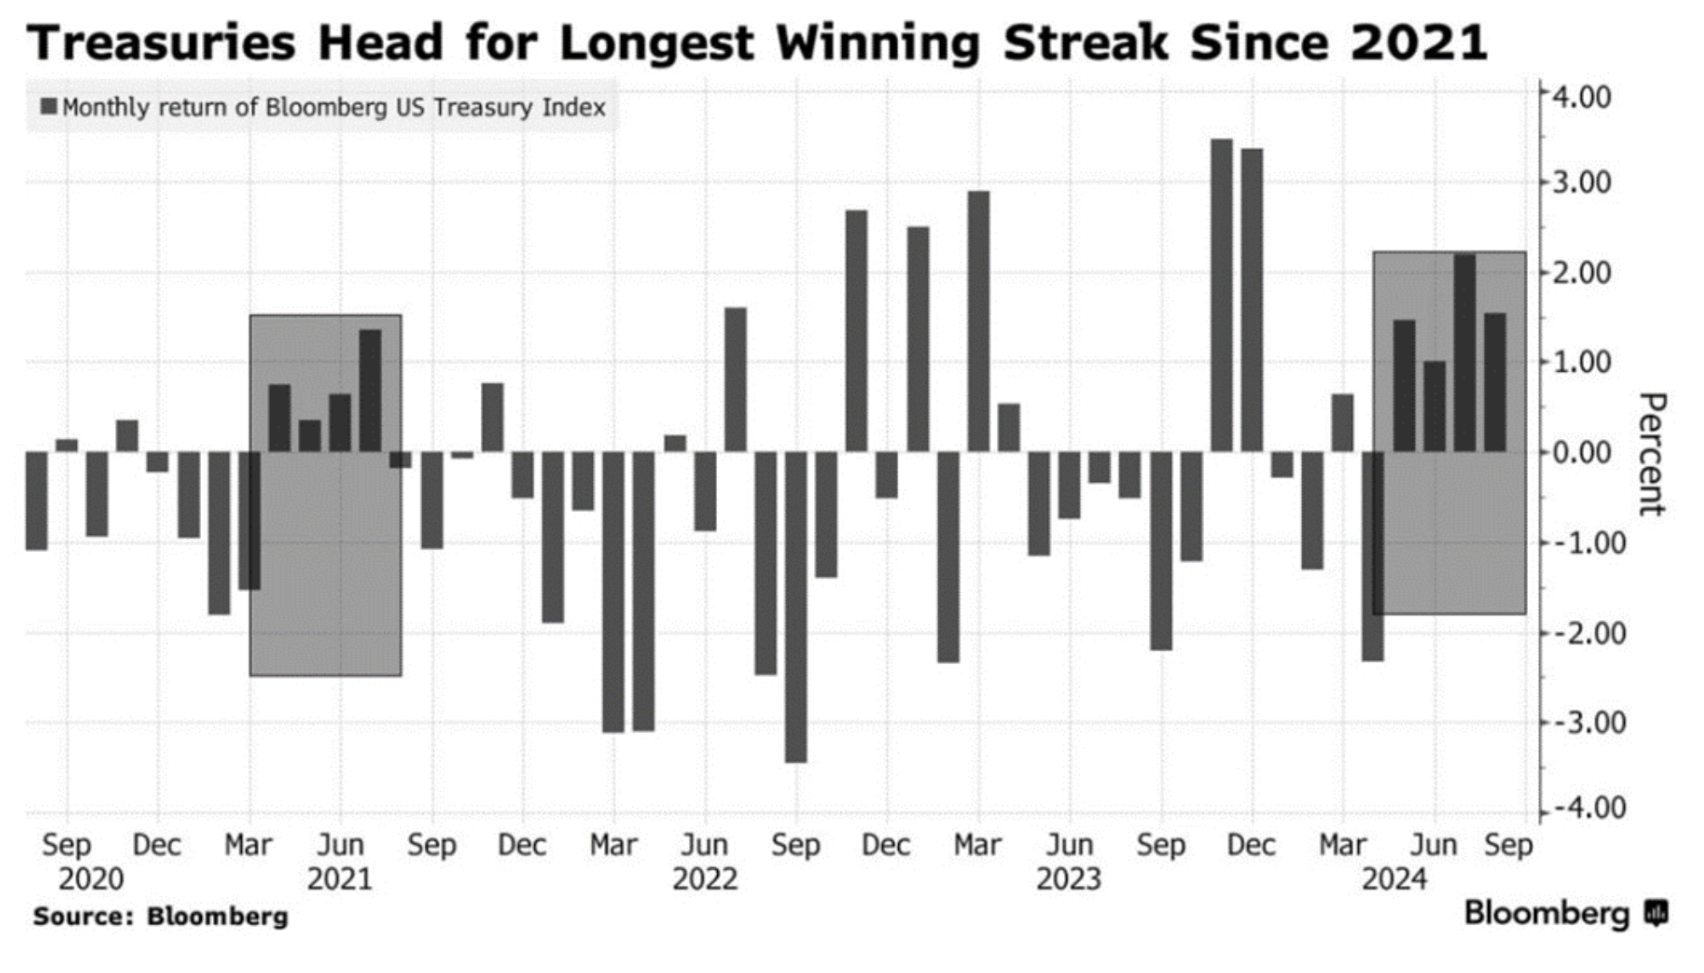
U.S. Treasury bonds have shown a fourth consecutive month of growth. This kind of trend hasn't been seen since the summer of 2021. The growth triggers, as a reminder, are the expectations of a rate cut.
GOLD
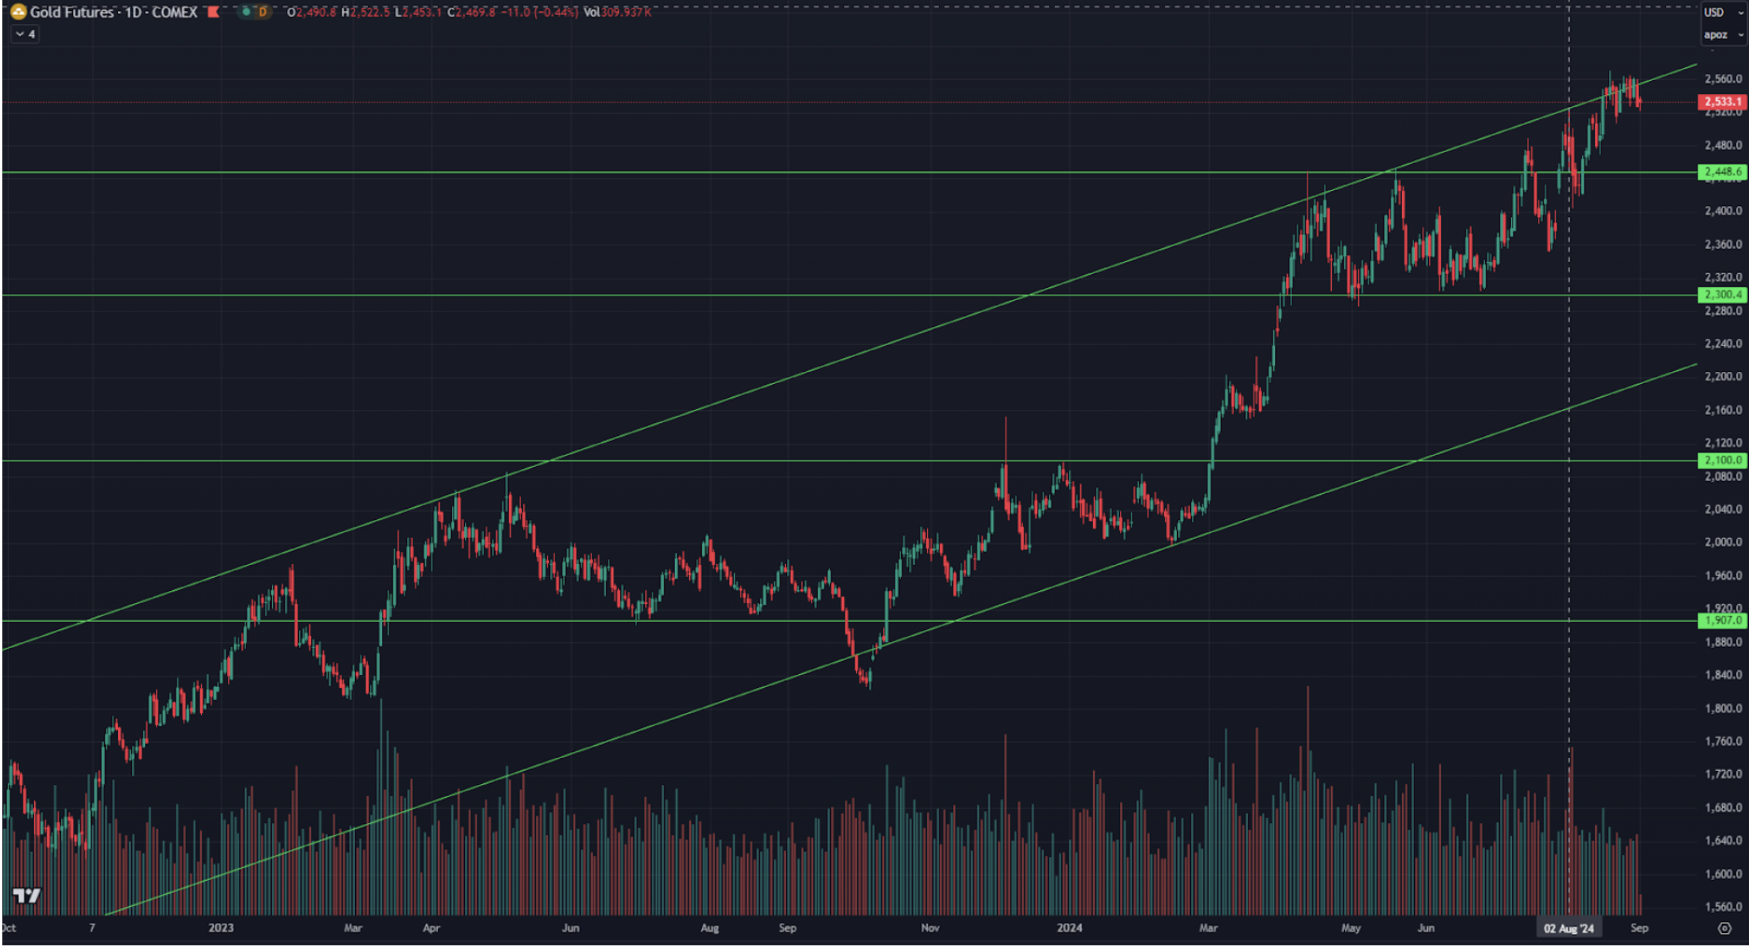
The gold futures market, like other markets, is also experiencing minimal movement, with the price consolidating within a narrow channel of $2560-$2530 per troy ounce.
BTC
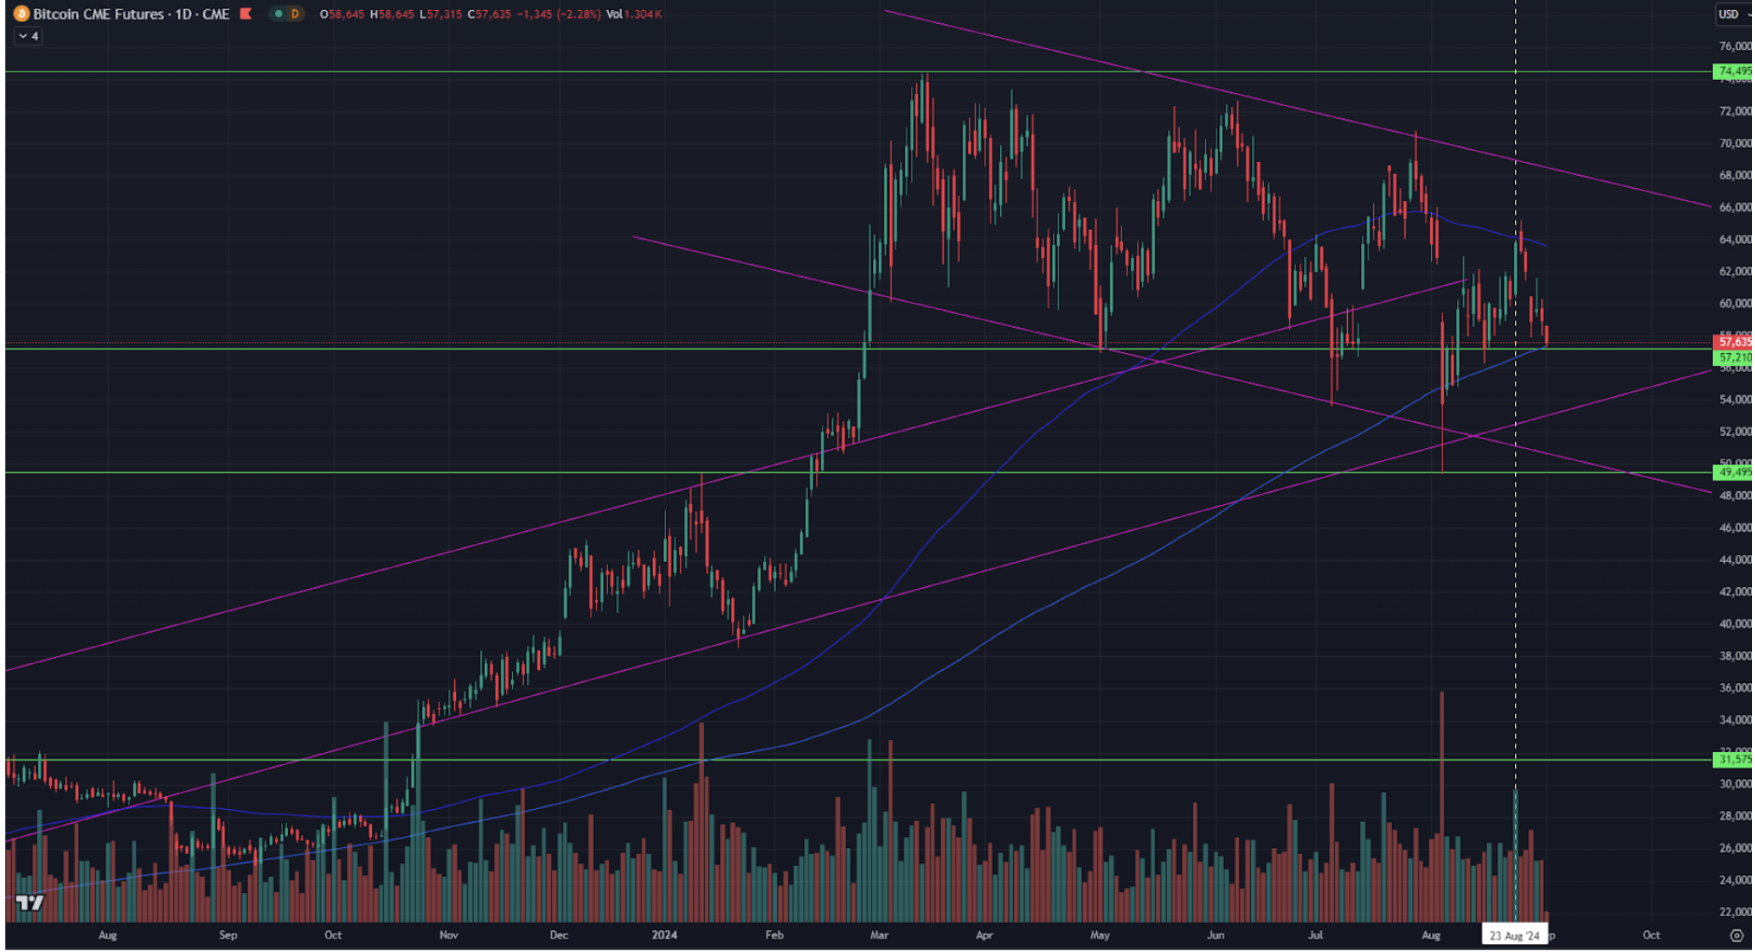
The current price of Bitcoin futures is $58,200.
The asset has been in a slightly downward channel since March of this year. The reaction of Bitcoin on August 23rd (marked by the white dotted line) was a 5% increase, driven by Jerome Powell's speech at the Jackson Hole symposium, where he discussed lowering borrowing costs. This indicates Bitcoin's sensitivity to interest rate reductions.
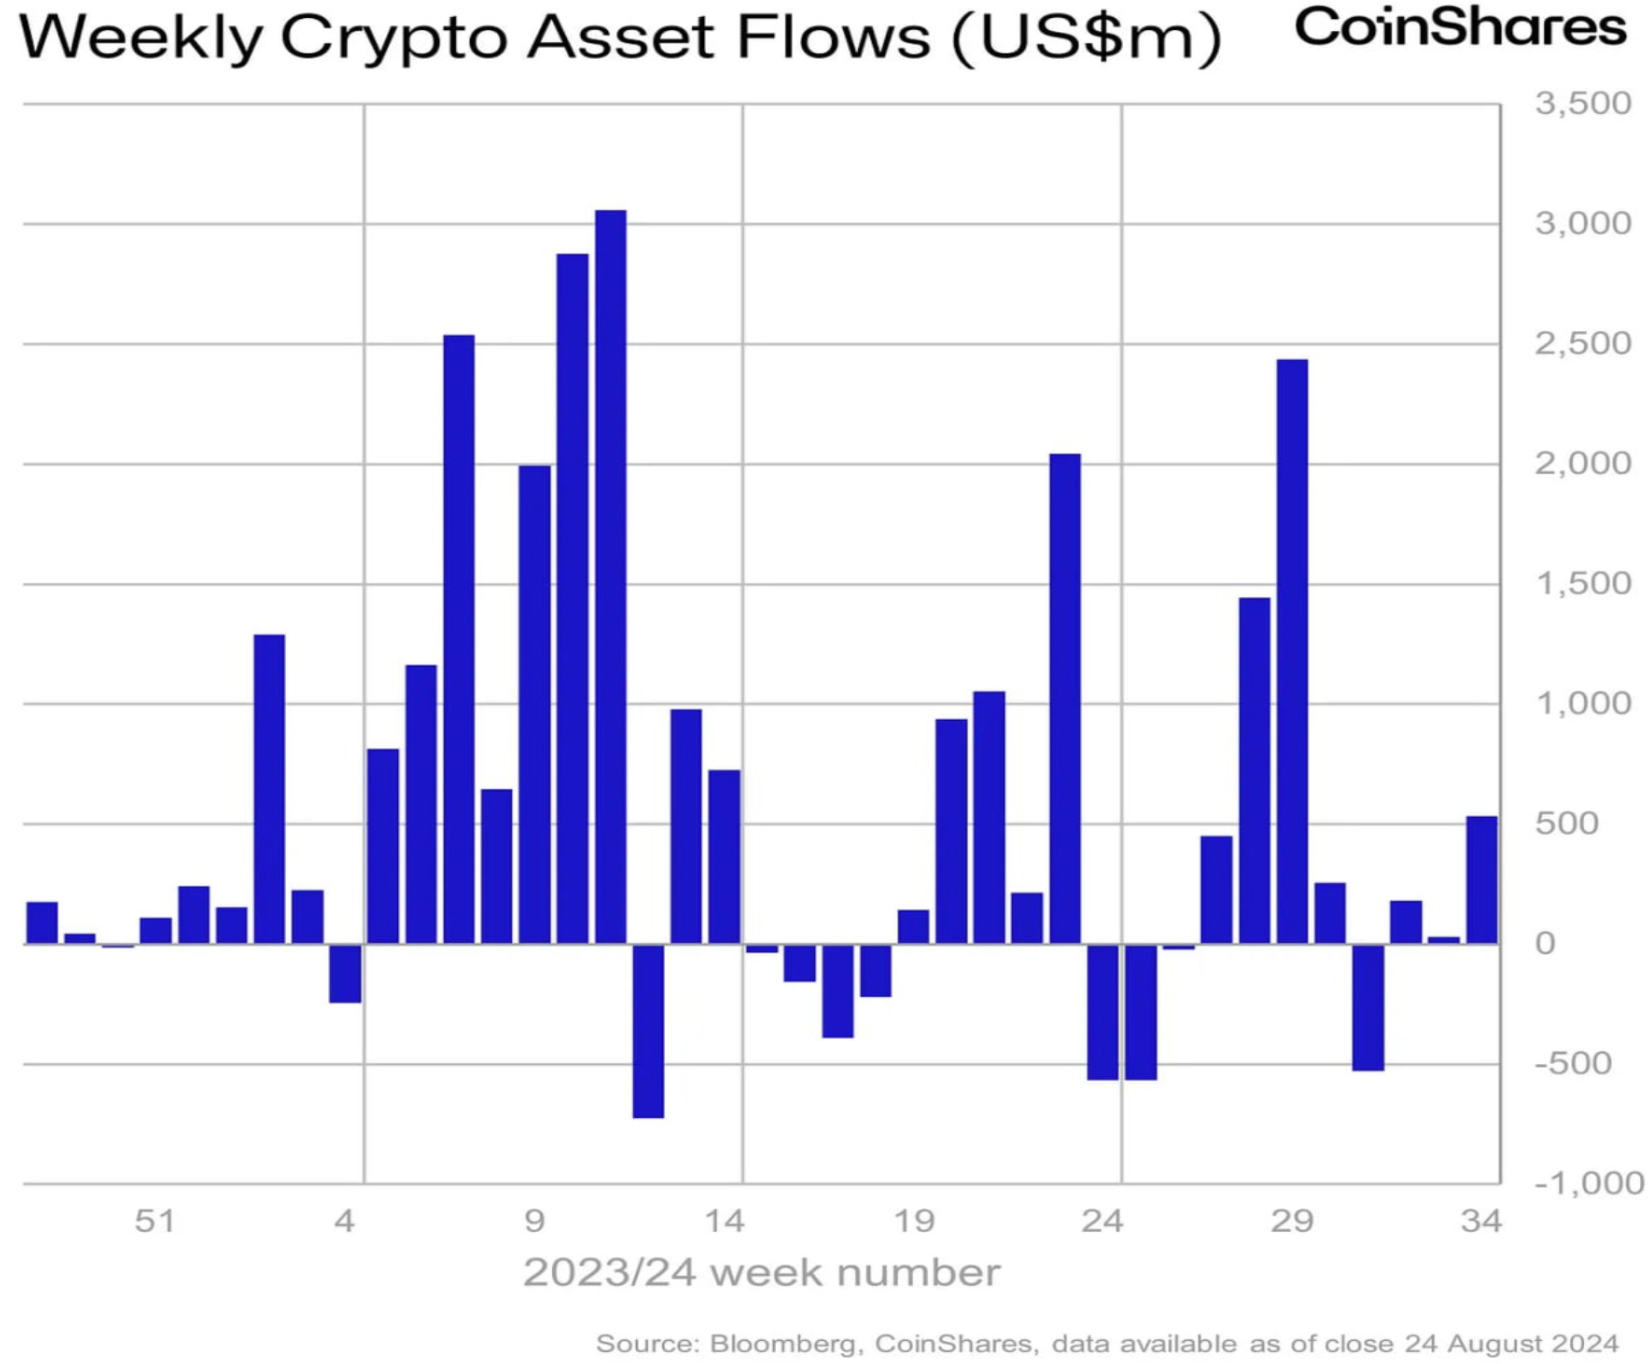
Last week, inflows into digital asset-related investment products reached $533 million, surpassing the average inflow of the past five weeks. However, these flows remain modest.
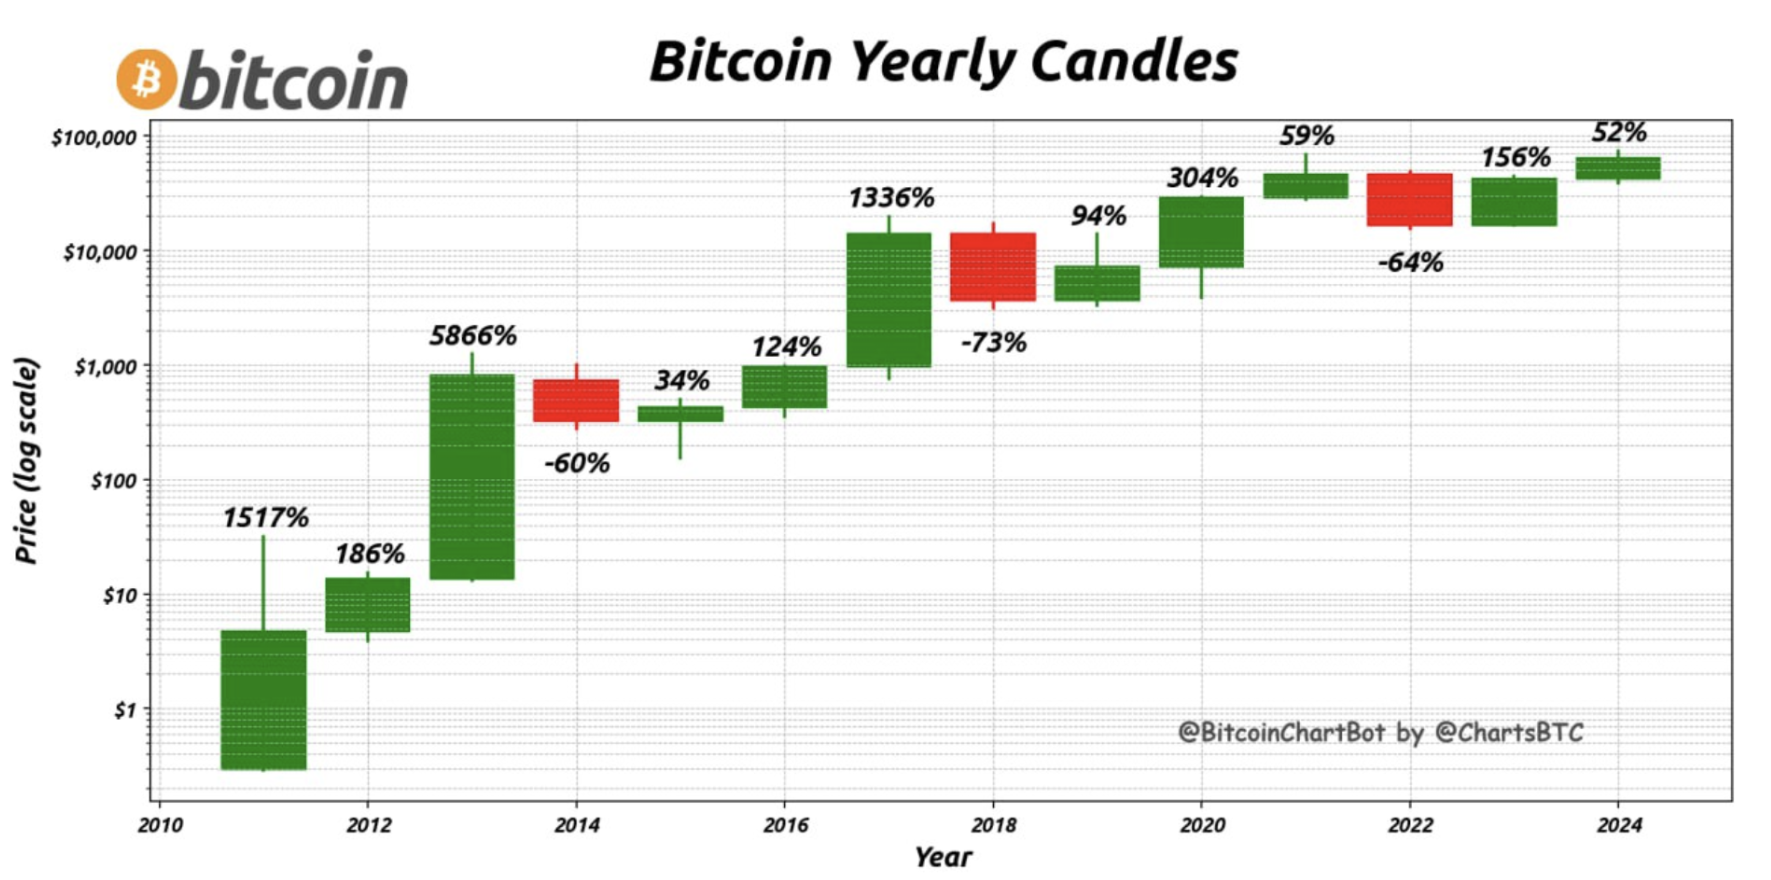
Annual candles for Bitcoin show that, historically, the asset has only declined three times since 2010, with an average annual return of 65%.
Interested in buying private tech companies' shares with us? Check out our Wealth and Growth account plans, which provide you access to exclusive venture capital deals!
Disclaimer: “The use of the trademark is for informational purposes only and does not imply endorsement or affiliation. Additionally, the information in this communication is for informational purposes only and is neither an offer to purchase, nor a solicitation of an offer to sell, subscribe for or buy any securities".