 Lietuvių
 Русский
 Қазақша
 Eesti
EestiAugust 5 — August 11: Weekly economic update
Key market insights

Macroeconomic Statistics
Inflation:
- Core Consumer Price Index (CPI) (YoY) (June): 3.3% (previous: 3.4%)
- Consumer Price Index (CPI) (YoY) (June): 3.0% (previous: 3.3%)
Federal Reserve Inflation Target:
- Core Personal Consumption Expenditures (PCE) Price Index (YoY) (June): 2.63% (previous: 2.62%)
- Personal Consumption Expenditures (PCE) Price Index (YoY) (May): 2.51% (previous: 2.6%)
Inflation Expectations:
- 12-month expected inflation (June): 2.9% (previous: 3.0%)
- 3-year expected inflation (June): 2.9% (previous: 2.8%)
- 5-year expected inflation (June): 2.9% (previous: 3.0%)
GDP (QoQ) (2Q) (preliminary estimate): 2.8% (previous: 1.4%), GDP deflator (QoQ) (1Q): 2.3% (previous: 3.1%)
Business Activity Index (PMI) (above 50 — economic expansion, below — slowdown):
- Services Sector (June): 56.0 (previous: 55.3)
- Manufacturing Sector (June): 51.4 (pre: 49.5, review)
- S&P Global Composite (June): 55.0 (pre: 54.8)
Labor Market
- Unemployment Rate (July): 4.3% (previous: 4.1%)
- Change in Non-Farm Private Sector Employment (June): 97K (previous: 136K)
- Average Hourly Earnings (July, YoY): 3.6% (previous: 3.8%)
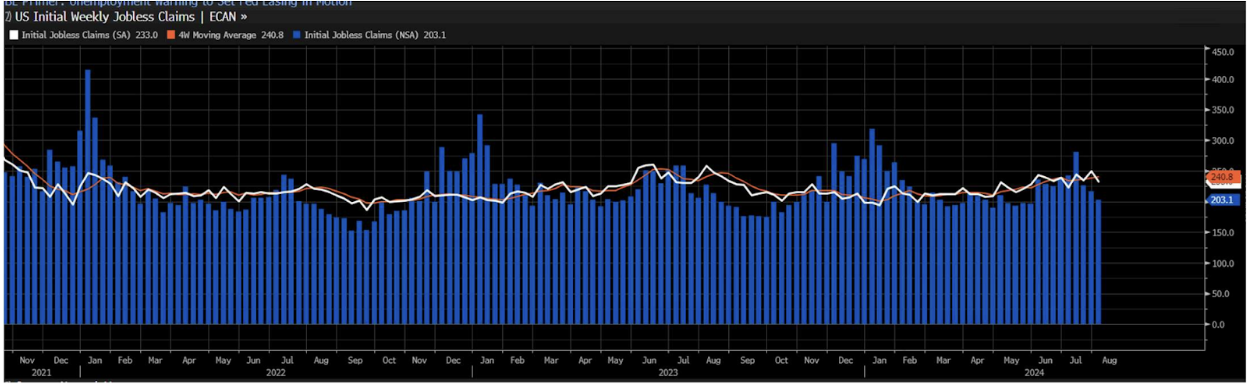
- Initial Jobless Claims: 233K (pre: 249K)
Monetary Policy
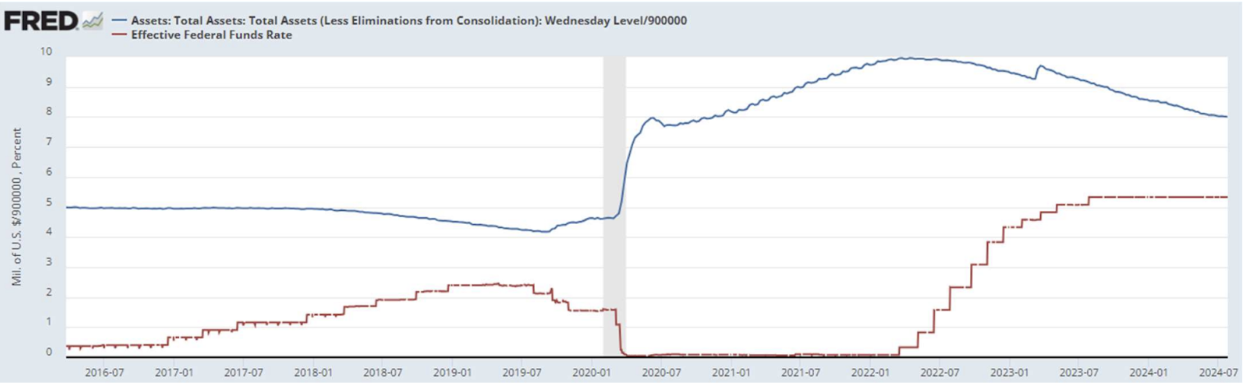
- Federal Funds Rate (EFFR): 5.50% (in red line)
- Federal Reserve balance sheet continues to decline at a slower pace: $7.175 T
Market Forecast for Rate (FedWatch):
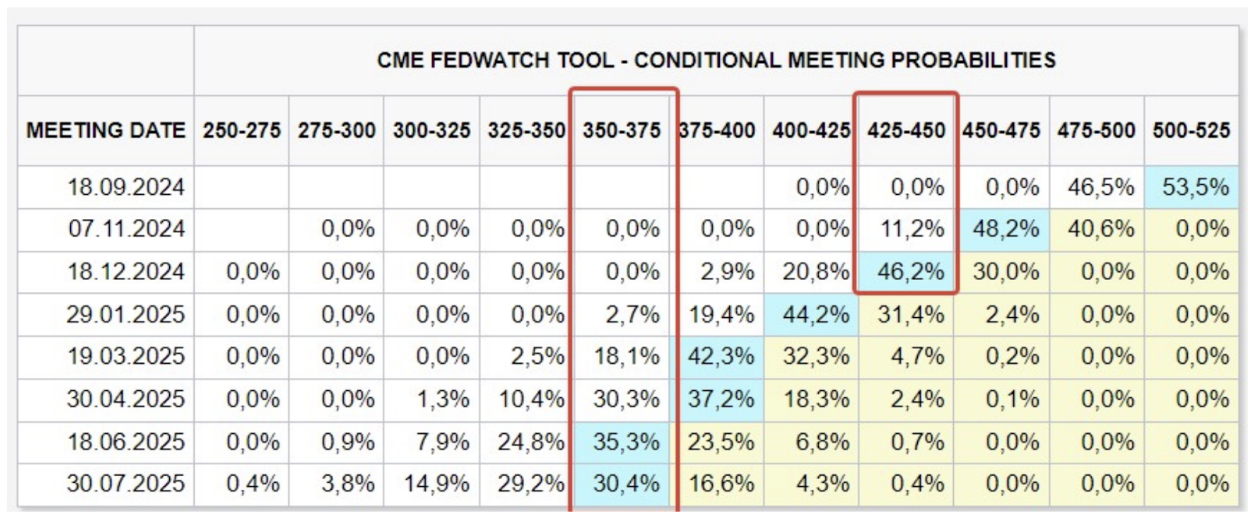
Today:
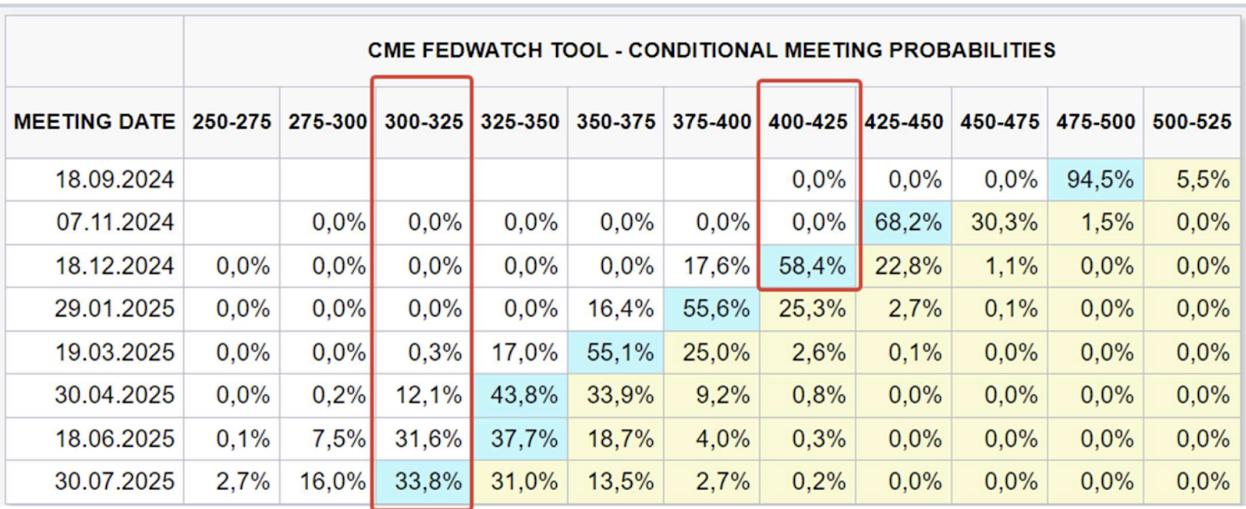
A week earlier:
Commentary
-
The number of weekly initial claims decreased to 233,000, below the expected 250,000 revised from the previous week. The data received more attention than usual after last week's weak employment report. This release positively impacted the markets;
-
FedWatch for December this year indicates three rate cuts to 4,00%–4,25% (down 1%). Long-term expectations for a year ahead suggest six rate cuts to 3,50%–3,75% (2,25%);
-
Goldman Sachs Group Inc. CEO predicts that the Fed will not take emergency steps to reduce borrowing costs and believes that one or two rate cuts are likely in the fall.
Market
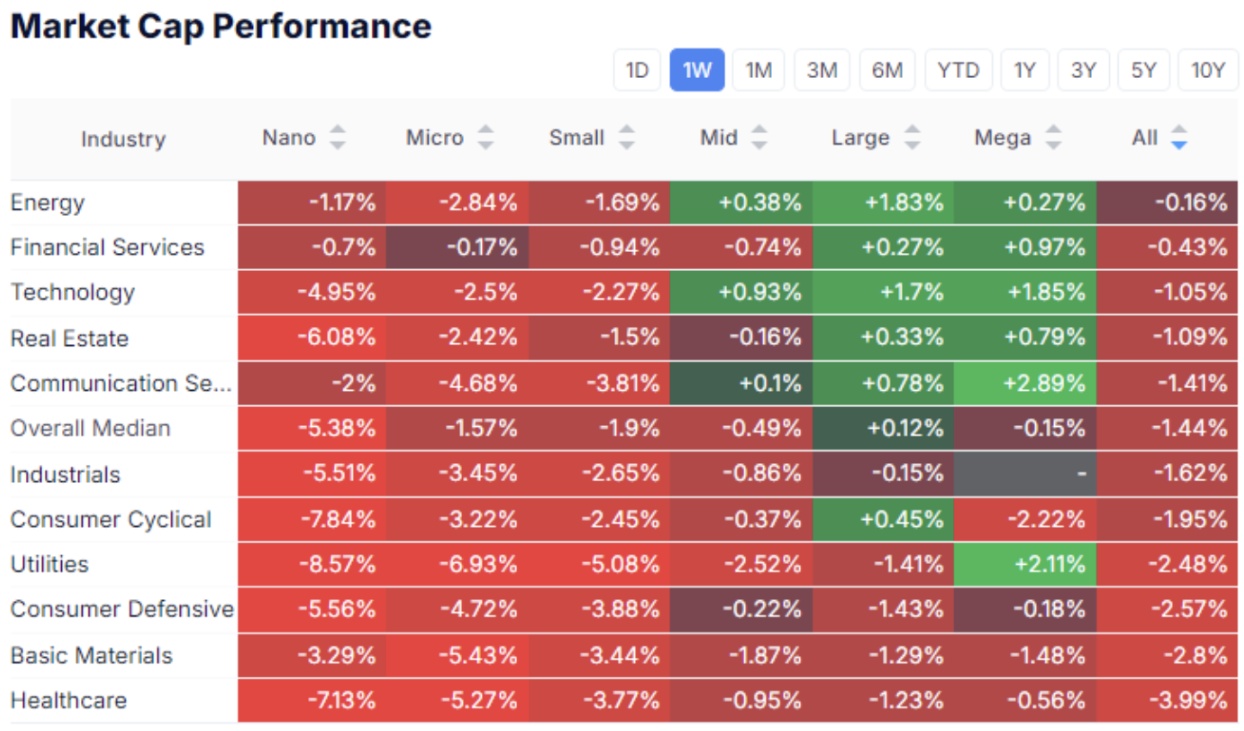
Market Cap Performance
The stock market:
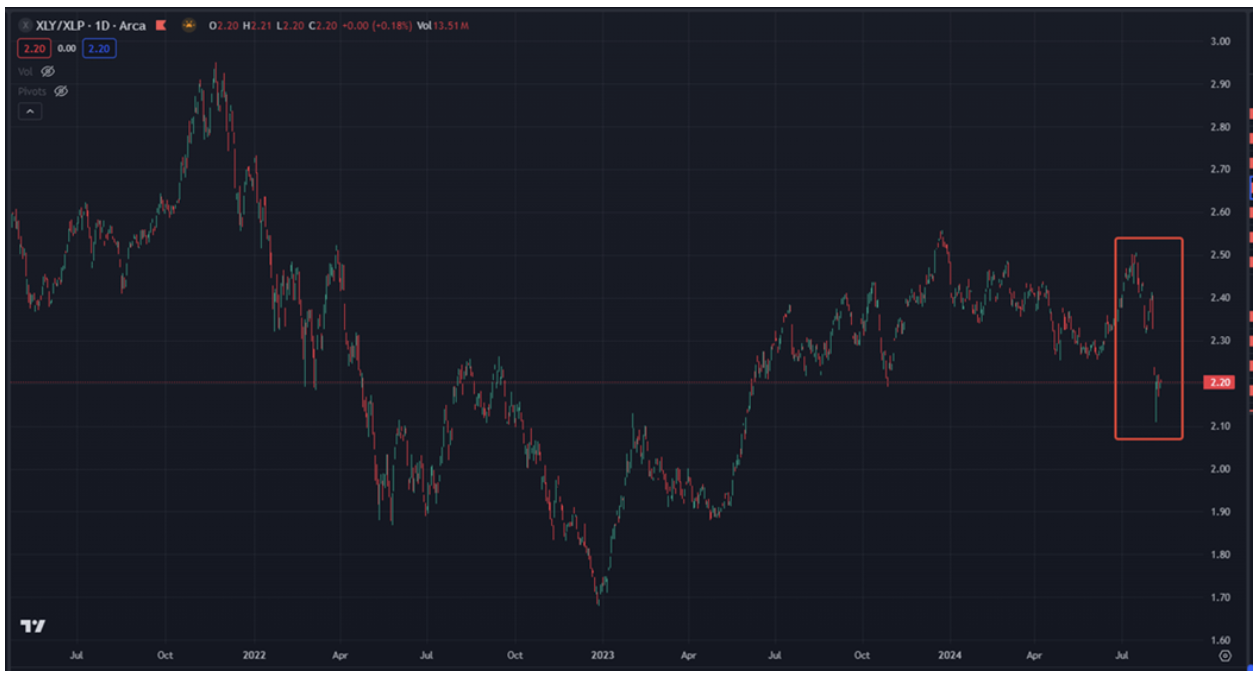
XLY/XLP
The median stock market decreased by 1,44%.
There was an inflow into large-cap companies in the energy, finance, technology, communication services, and utilities sectors.
Greater selling pressure was seen in consumer sectors, basic materials, healthcare, and all sectors of the stock market from mid-cap and below.
This trend indicates a continued investor risk aversion.
A significant gap in the XLY/XLP ratio (the ratio of the discretionary consumer sector (non-essential goods) to the defensive consumer sector (essential goods)) confirms this trend.
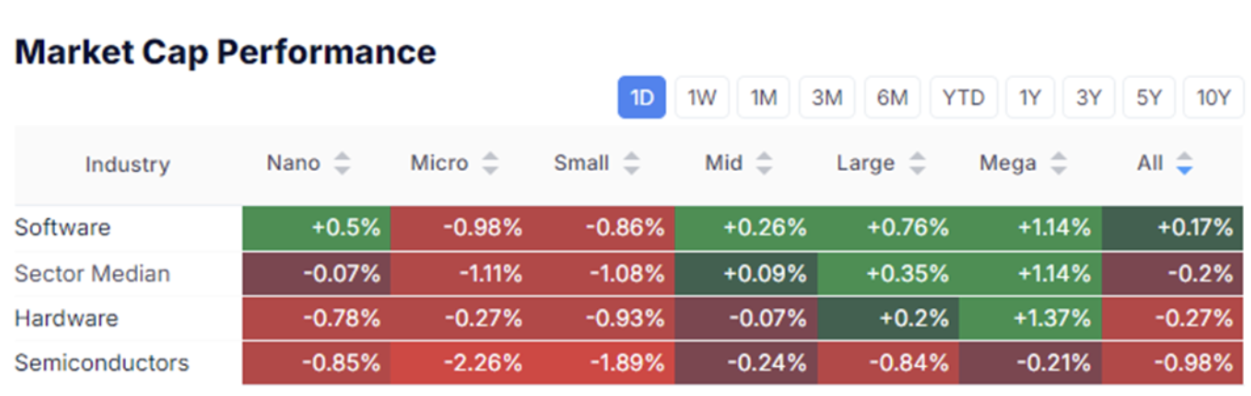
Technology Sector:
SMH
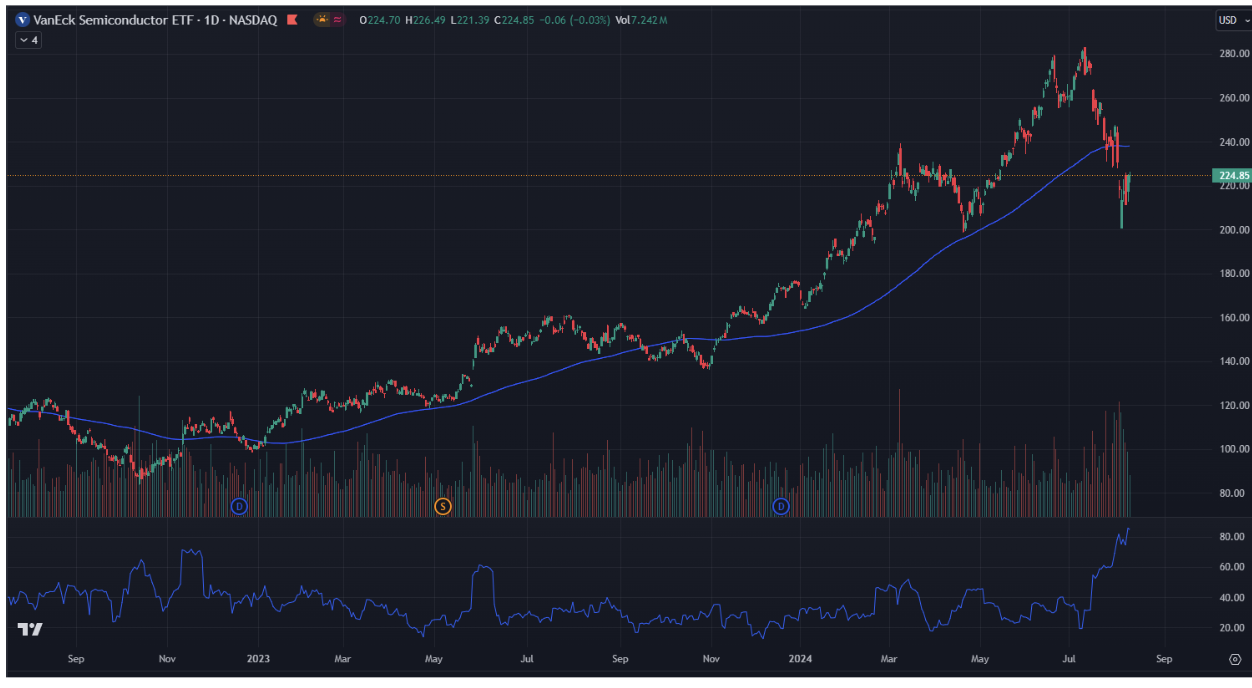
The semiconductor sector tracked by ETF SMH nearly closed the gap over the week. The decline from the peak exceeded 20%.
However, semiconductor production remains a strong theme. Growth since the beginning of the year exceeded 30%. Overall, the bullish sentiment in this sector remains.
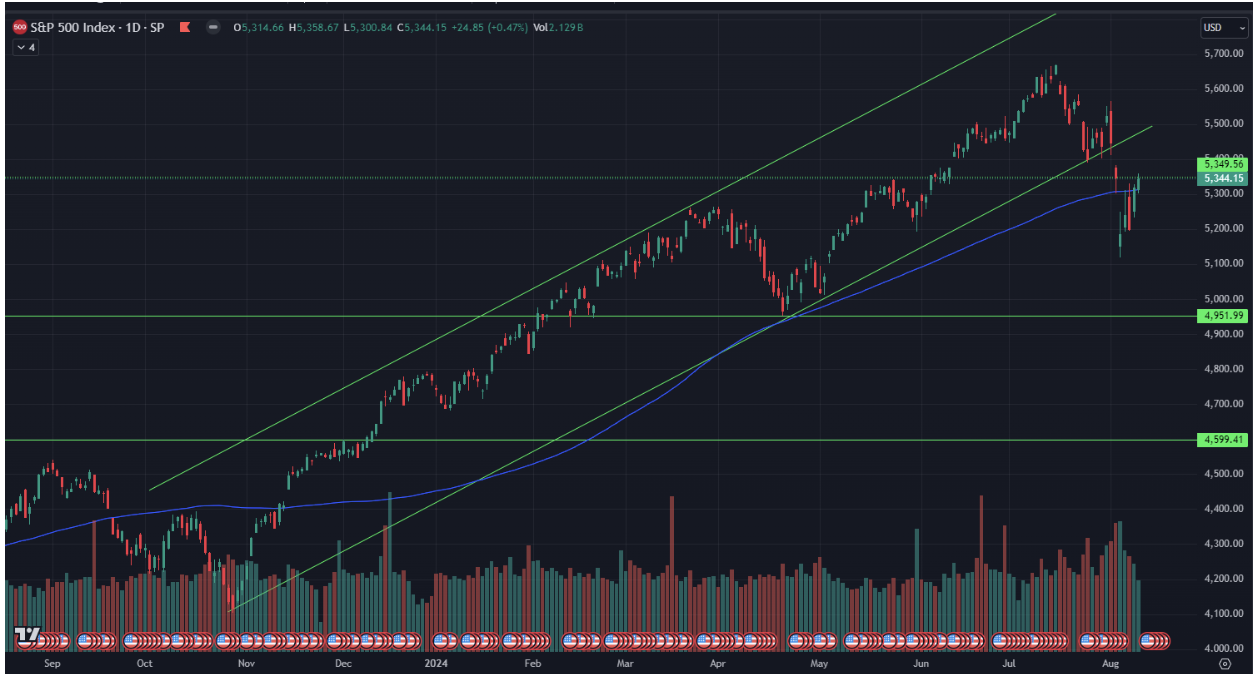
Standard&Poor's 500:
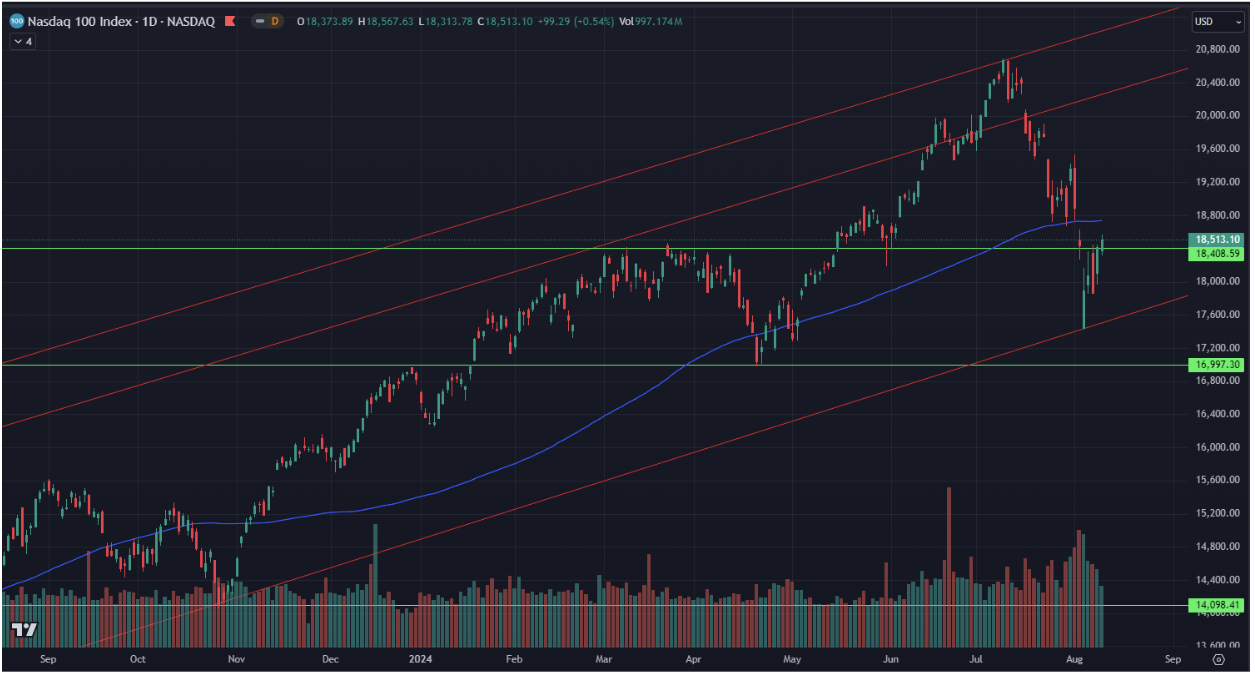
NASDAQ 100:
SP500: weekly growth: 3.88%, current price below the historical peak: by 5.66%. The index briefly broke below the 200-day moving average but returned above it by the end of the week, closing the gap.
NASDAQ100: similar dynamics, from the historical peak–10.65%, weekly–6.12%. Overall, volatility in NDX is twice as high as in SP500.
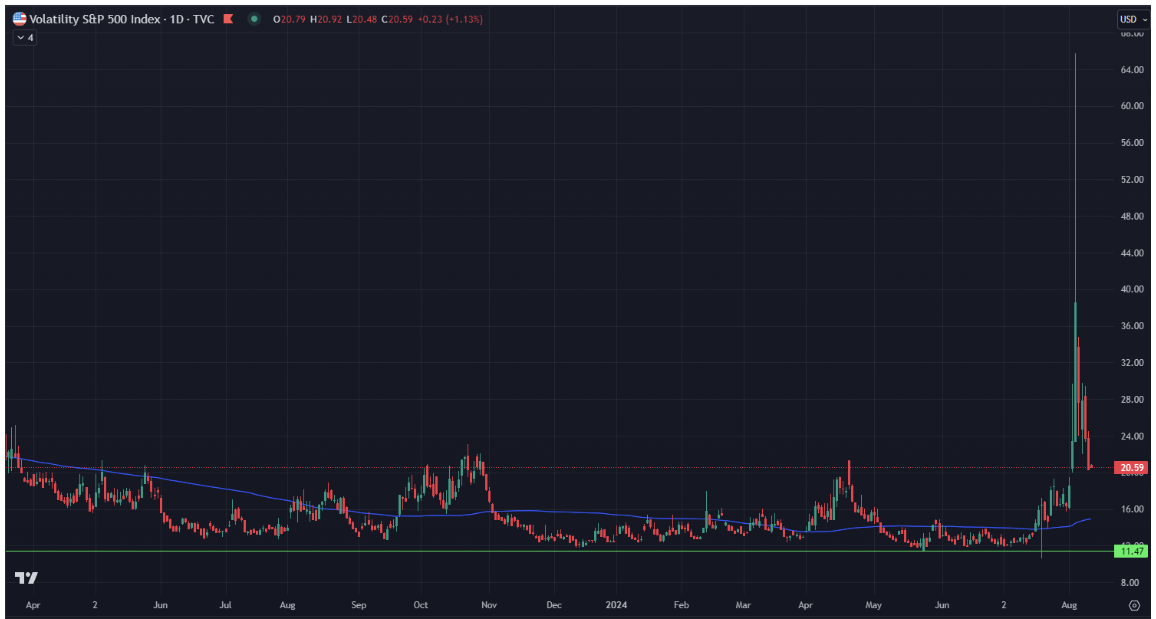
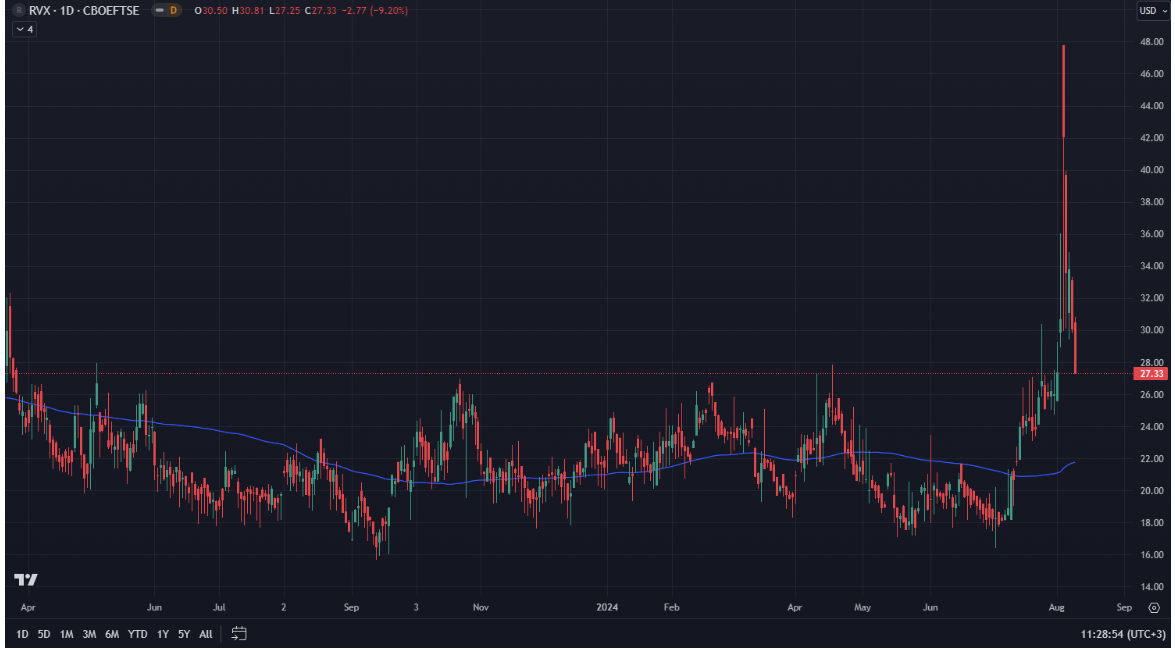
Volatility Indices (top: VIX on SP500, bottom: RVX on mid- and small-cap companies).
Volatility decreased during the week, remains above average, but the current picture indicates a normalization of the situation.
VIX:
RVX:
Recession Probability in the U.S.
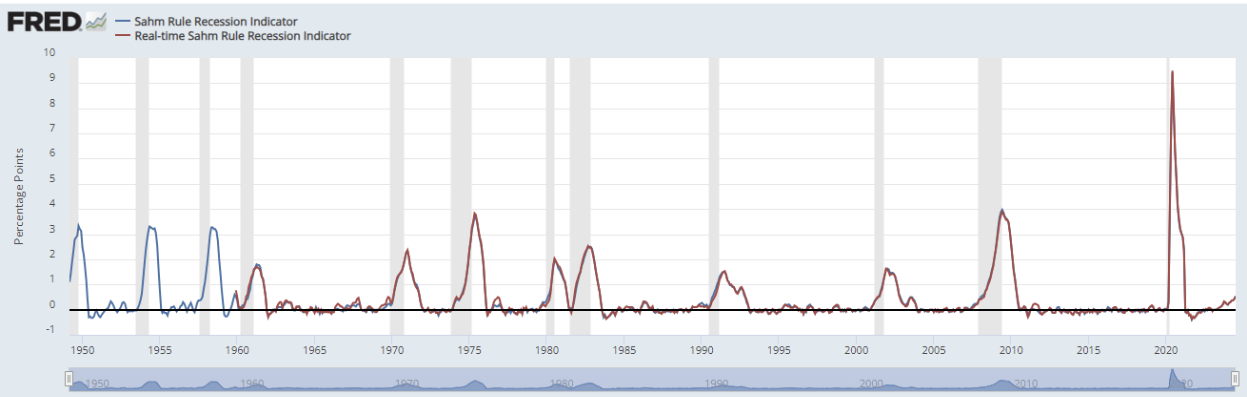
Sahm Recession Indicator:
GDP-Based Recession Indicator Index 4,00:
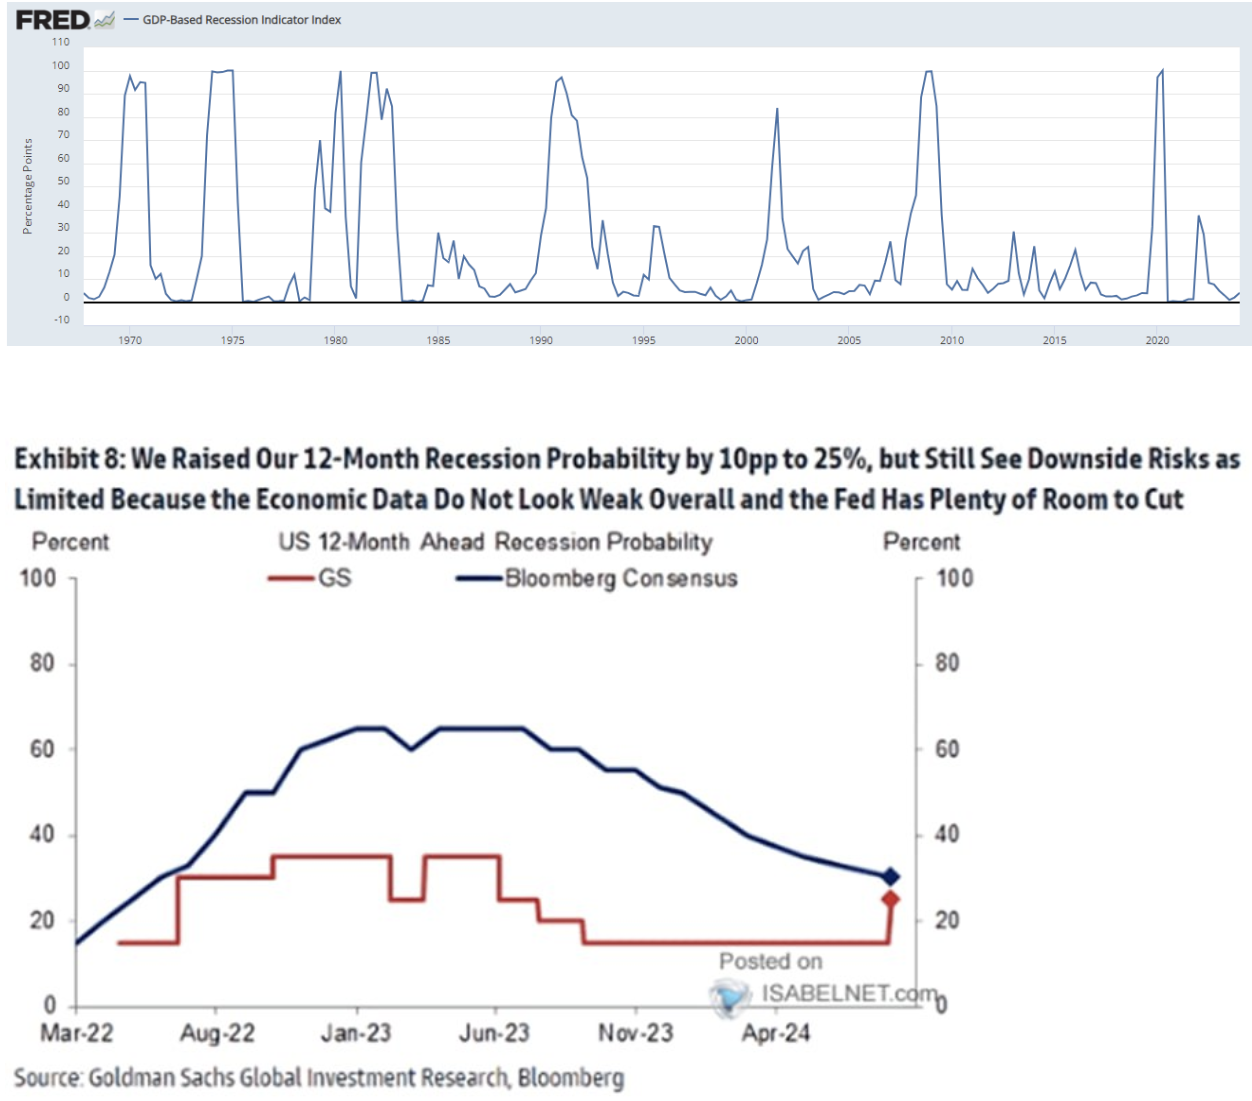
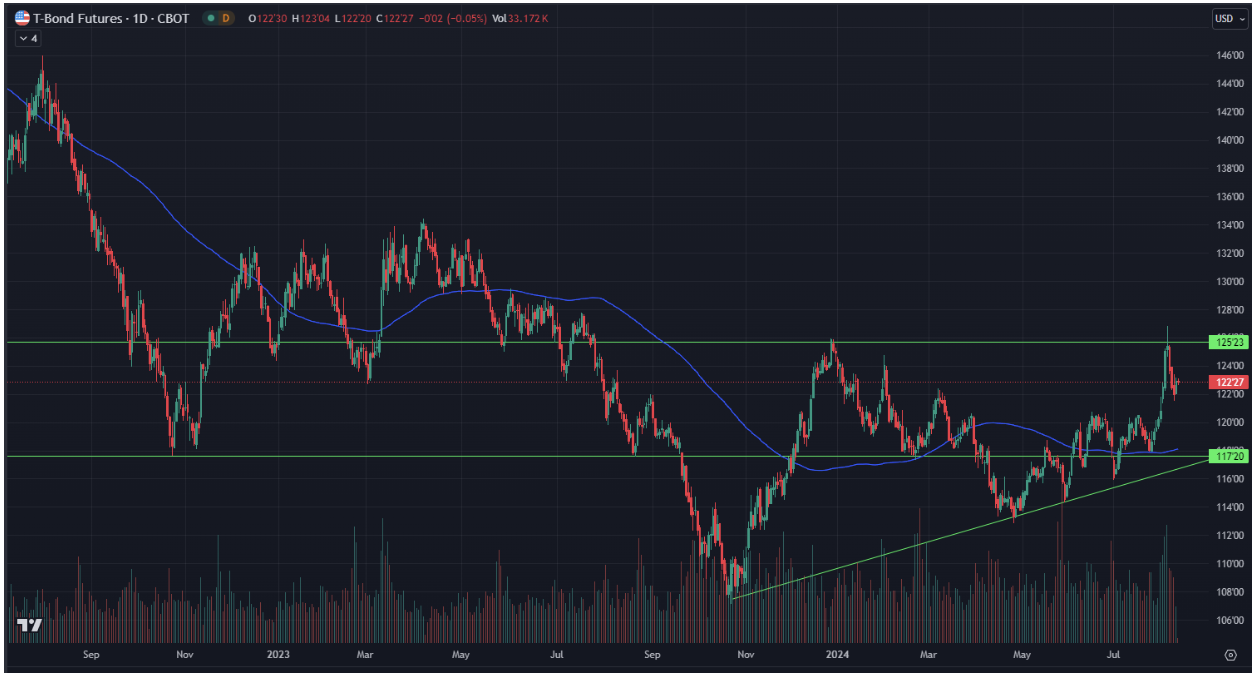
The upper graph – the Sahm recession indicator (based on the labor market) rose above 0.5, a historical signal of the beginning of a recession. The middle graph – the GDP-based recession indicator: current value 4 – the recession range is from 33 to 65. The lower graph – GS and JPM's estimates of recession probability, with indicators at 25% and 30%, respectively. Overall, the probability estimates have increased but are not critical.
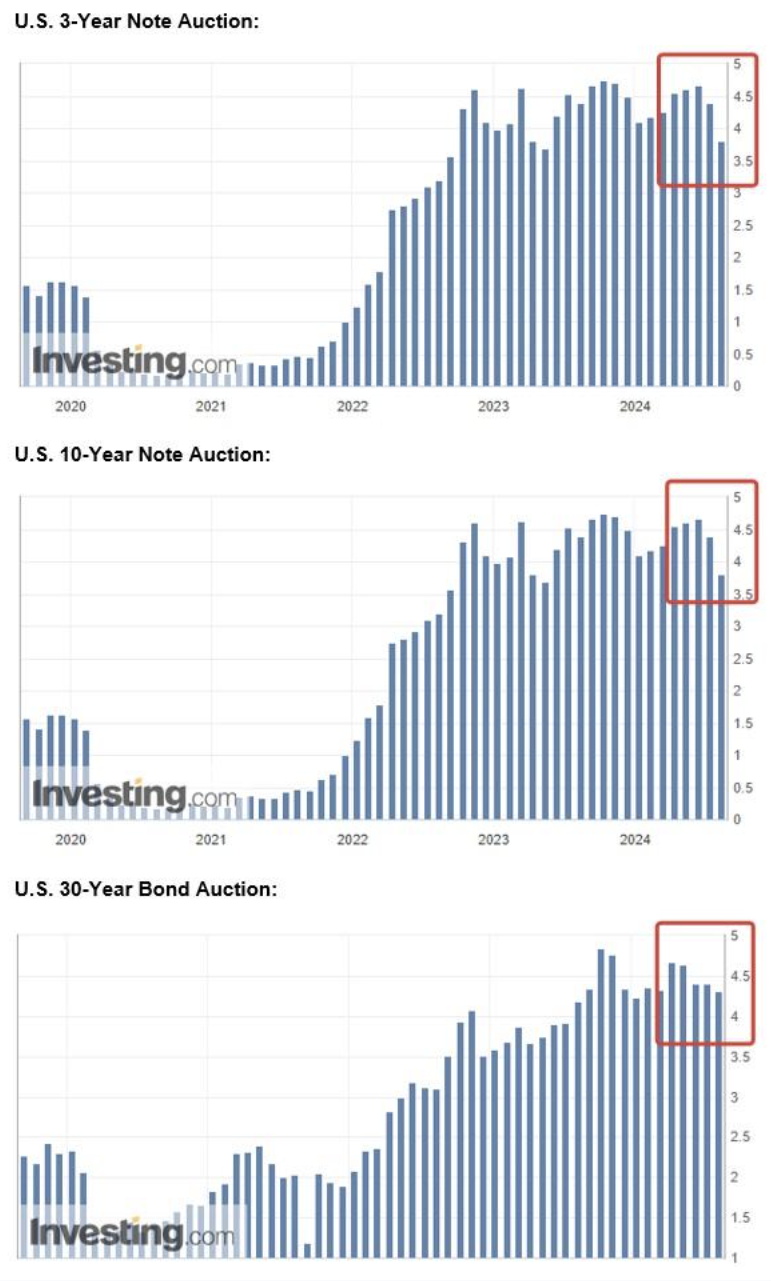
Treasury Market
The price of long-term bond futures decreased as stock market volatility subsided, returning to a horizontal range. The weekly decline was about 2.0%. However, the overall trend remains upward.
Primary auctions for government debt show a decrease in yields across the curve, reflecting market expectations for near-term rate cuts.
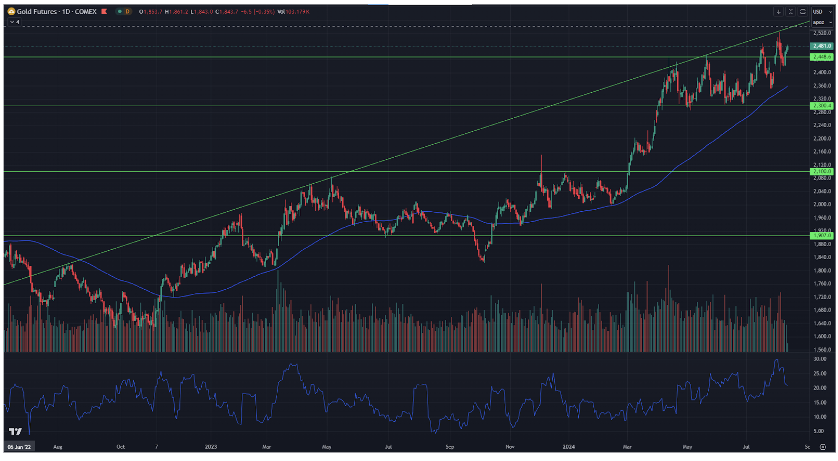
Gold:
Gold continues its upward movement, with the price approaching the historical maximum (current value: $2,480 per troy ounce).
Summary:
Markets are calming down. This week, we saw a decrease in volatility. In the medium term, the correction in the stock markets may continue. The rhetoric of Fed representatives is softening. The rate is likely to be cut in September, but data on inflation and the labor market will become increasingly important.
Interested in buying private tech companies' shares with us? Check out our Wealth and Growth account plans, which provide you access to exclusive venture capital deals!
Disclaimer: “The use of the trademark is for informational purposes only and does not imply endorsement or affiliation. Additionally, the information in this communication is for informational purposes only and is neither an offer to purchase, nor a solicitation of an offer to sell, subscribe for or buy any securities".