Lietuvių
 Русский
 Қазақша
 Eesti
EestiFebruary 17 - 21, 2025: Weekly economic update
Key market updates

MACROECONOMIC STATISTICS
INFLATION
- Core Consumer Price Index (CPI) (m/m) (January): 0.4% (prev: 0.2%);
- Consumer Price Index (CPI) (m/m) (January): 0.5% (prev: 0.4%);
- Core Consumer Price Index (CPI) (y/y) (January): 3.3% (prev: 3.2%);
- Consumer Price Index (CPI) (y/y) (January): 3.0% (prev: 2.9%).
INFLATION EXPECTATIONS (MICHIGAN)
- 12-month expected inflation (January): 4.3%, prev: 4.3%;
- 5-year expected inflation (January): 3.5%, prev: 3.3%.
BUSINESS ACTIVITY INDEX (PMI):
- Services Sector (December): 49.7 (prev: 52.8);
- Manufacturing Sector (December): 51.6 (prev: 50.1);
- S&P Global Composite (December): 50.4 (prev: 52.4).
GDP (BEA – U.S. Bureau of Economic Analysis) (q/q) (Q) (Preliminary Estimate):
- 2.3% (prev: 3.1%)
LABOR MARKET:
- Unemployment Rate (January): 4.0% (prev: 4.1%);
- Nonfarm Payrolls Change (January): 143K (prev: 307K);
- Private Nonfarm Payrolls Change (January): 111K (prev: 273K revised);
- Average Hourly Earnings (January, y/y): 4.1% (prev: 4.1%).
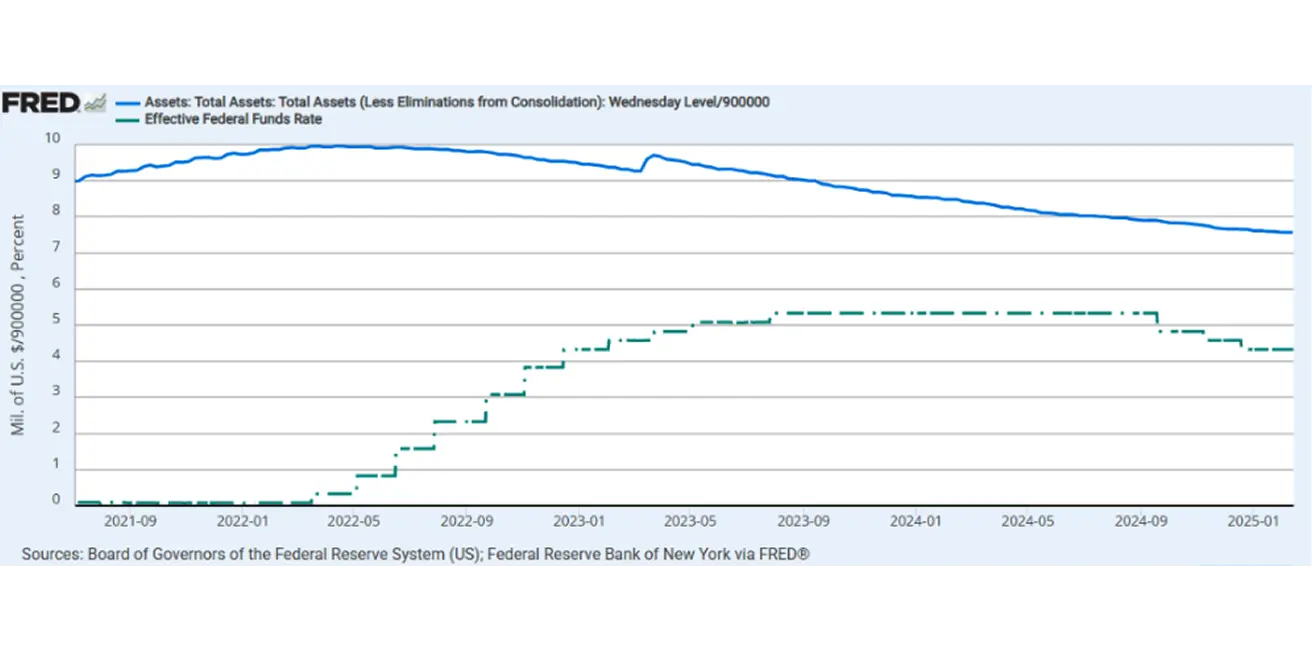
MONETARY POLICY
- Federal Funds Rate (EFFR): 4.25%–4.50% (dotted line);
- Fed Balance Sheet (blue): $6.782 trillion (vs previous week: $6.810 trillion)
MARKET FORECAST FOR RATE
Today:
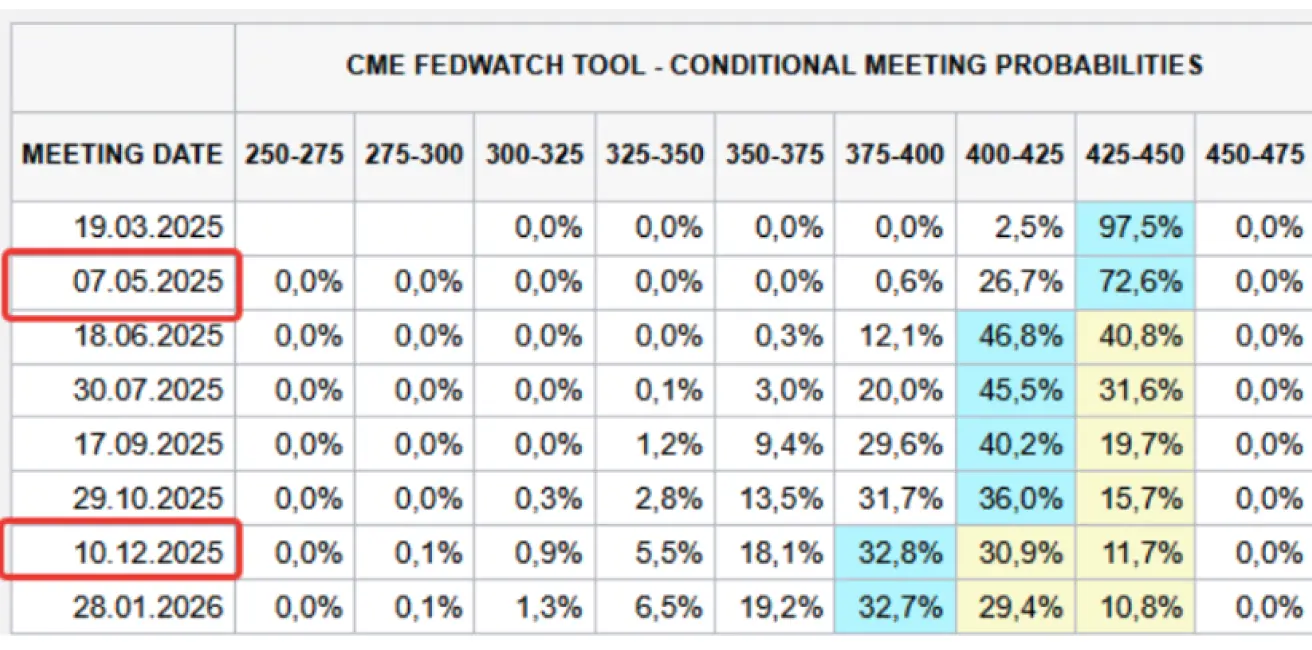
А week earlier:
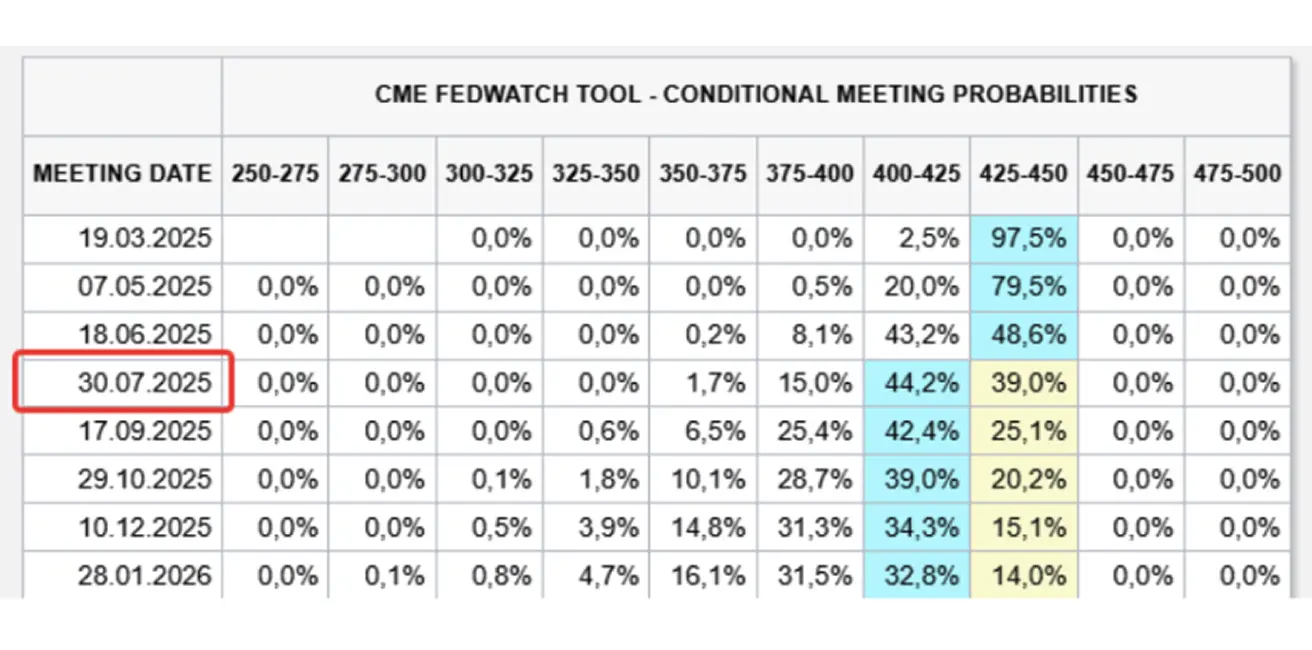
Commentary: Business activity data (PMI) showed a slight increase in the manufacturing sector (+0.4), but more importantly, the services sector recorded a decline of 1.2 points — the first significant drop since June 2024. The index fell below 50, indicating a slowdown in services. This is a positive signal, as service-sector inflation contributes more significantly to the consumer price index.
FOMC meeting minutes (summary): Before lowering interest rates, further confirmation of declining inflation is required. The economy continues to grow, and the labor market remains stable.
Market expectations (FedWatch tool): Two rate cuts are now priced in — the first 0.25% cut has been pushed to June, the second to December this year, with the expected rate range at 3.75-4.00%.
Market
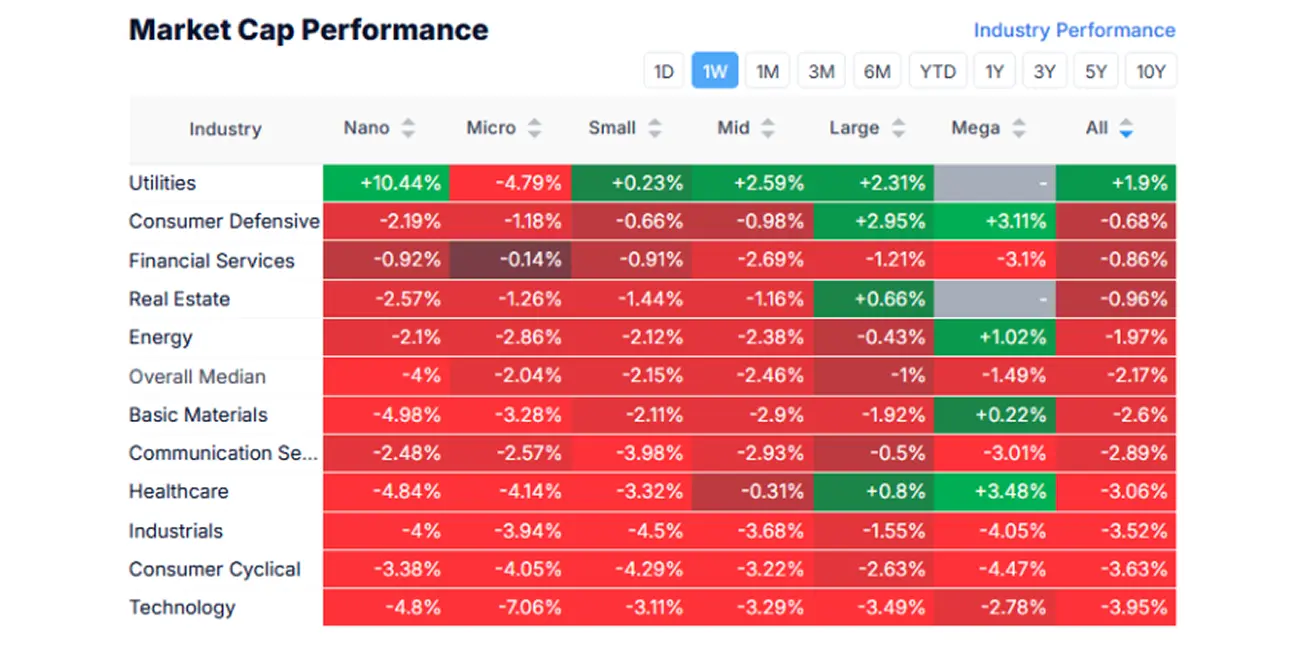
MARKET CAP PERFORMANCE
Last week, the stock market remained firmly in the red, with a median decline of -2.17%. The utilities sector was the sole gainer, while the technology, consumer cyclical, and industrial sectors ranked among the worst performers.
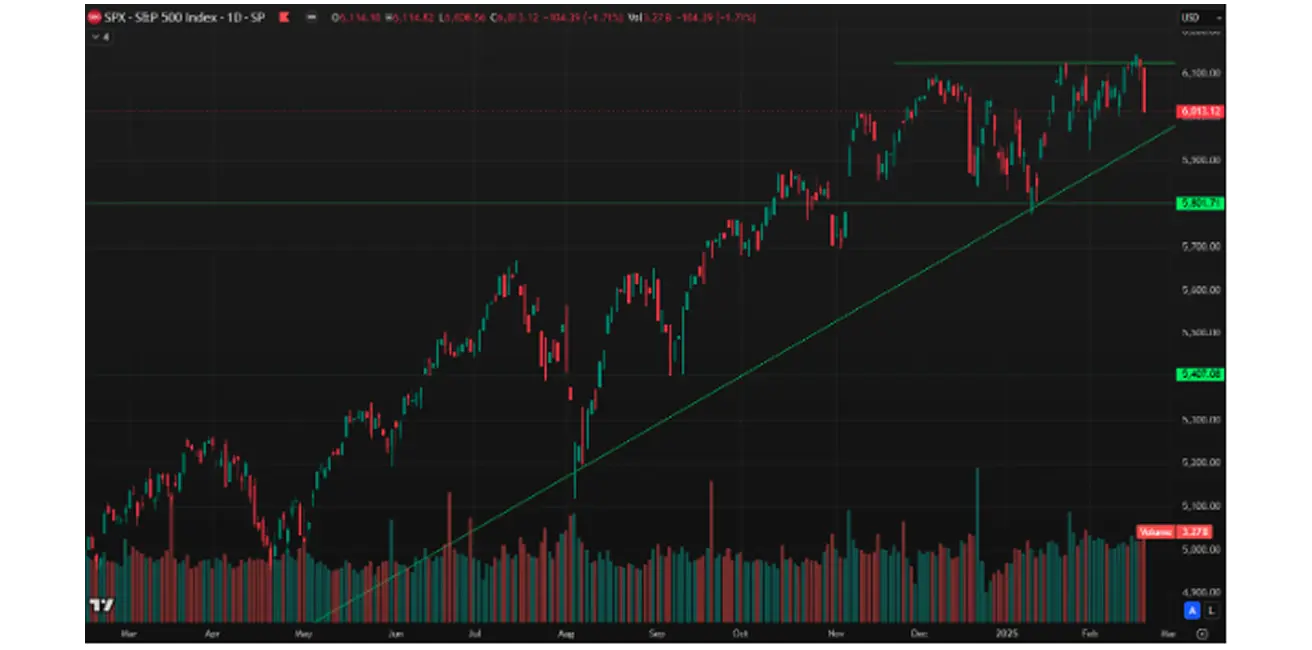
SP500
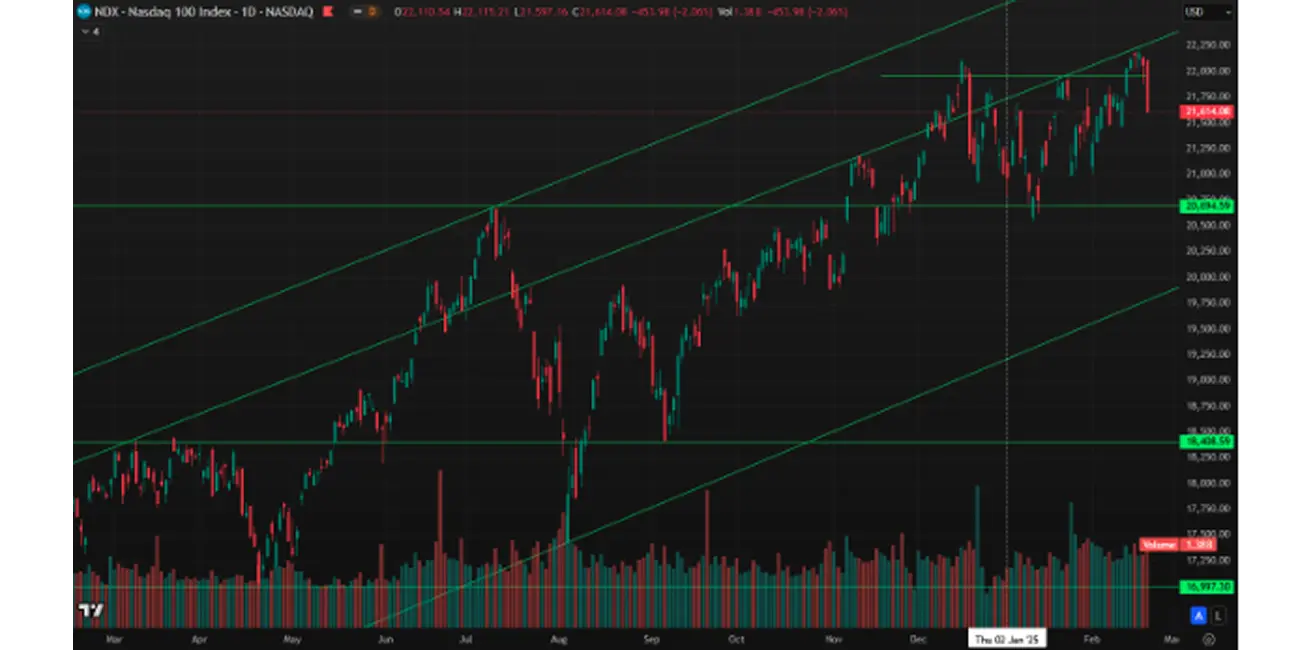
NASDAQ100
Nasdaq 100: Similarly, the index hit an all-time high of 22,222 on Wednesday but ended the week down -2.26% (closing at 21,614). Year-to-date growth (2025): +2.34%.
BOND MARKET
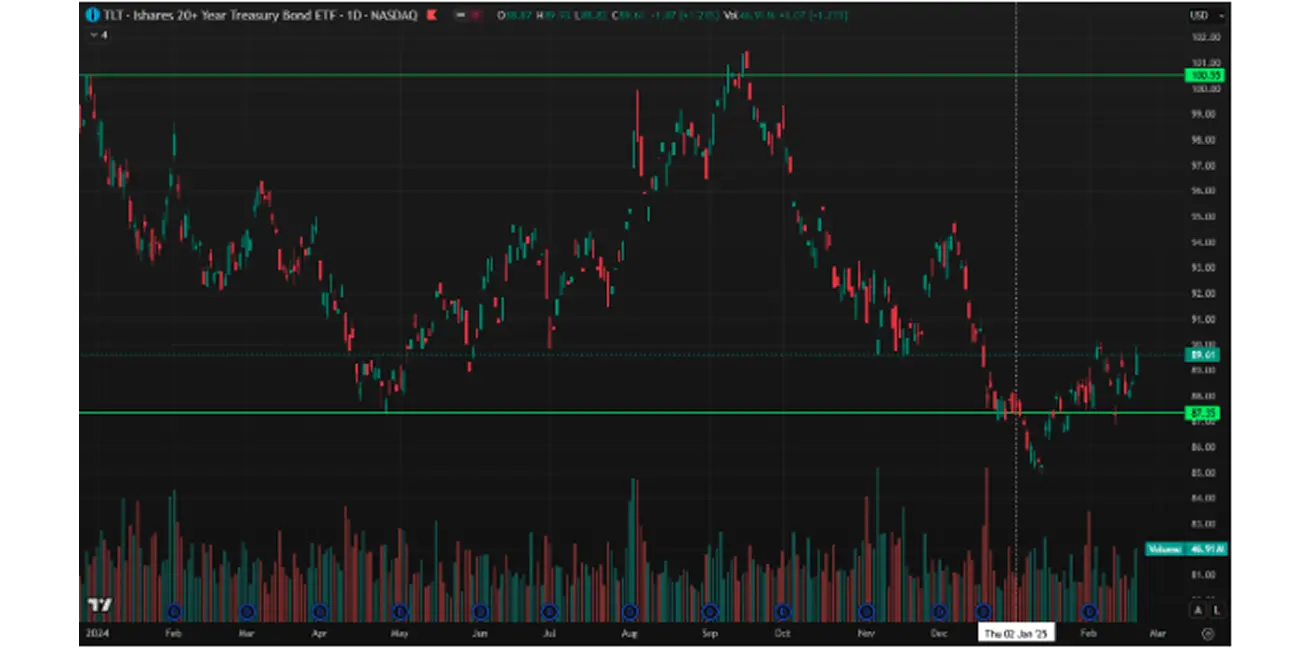
Bond Market: Ended the week with gains (yields declined).
20+ Year Treasury Bonds (ETF TLT): +0.52% (week closed at $89.61). Year-to-date growth (2025): +2.06%.
YIELDS AND SPREADS
Yields and Spreads 2025/02/17 vs 2024/02/14
- Market Yield on U.S. Treasury Securities at 10-Year Constant Maturity: 4,437% (4,493)%;
- ICE BofA BBB US Corporate Index Effective Yield: 5,46% (5,59%)
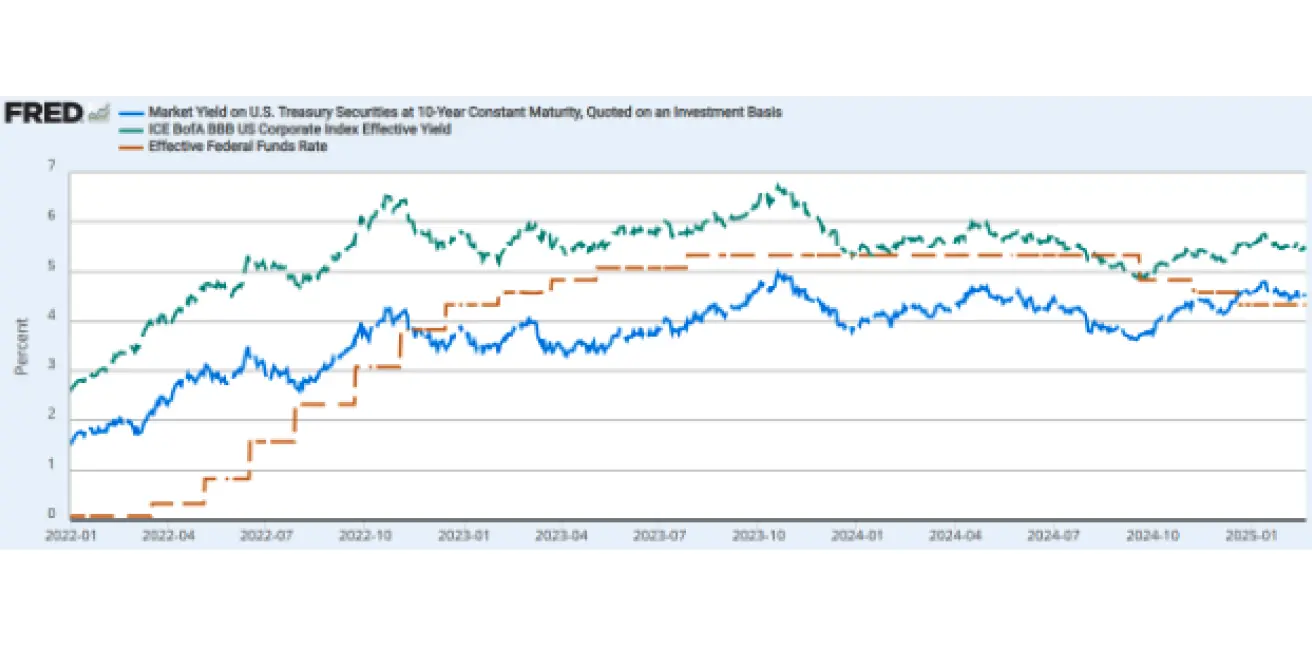
The yield spread between 10-year and 2-year U.S. Treasury bonds currently stands at 23.7 vs. 18.3 basis points, reflecting the differential in returns between long-term and short-term debt instruments.
The U.S. Treasury yield curve — plots yields across bonds with varying maturities—serves as a key economic indicator, offering insights into market expectations and the broader economic outlook:
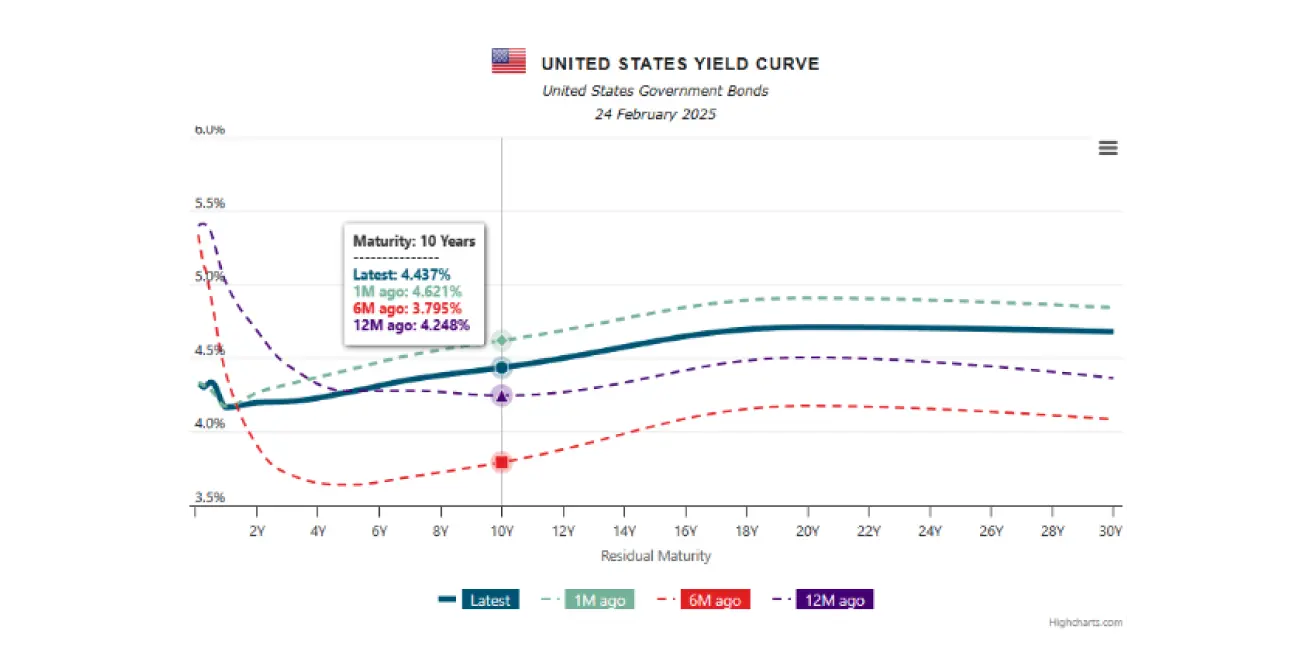
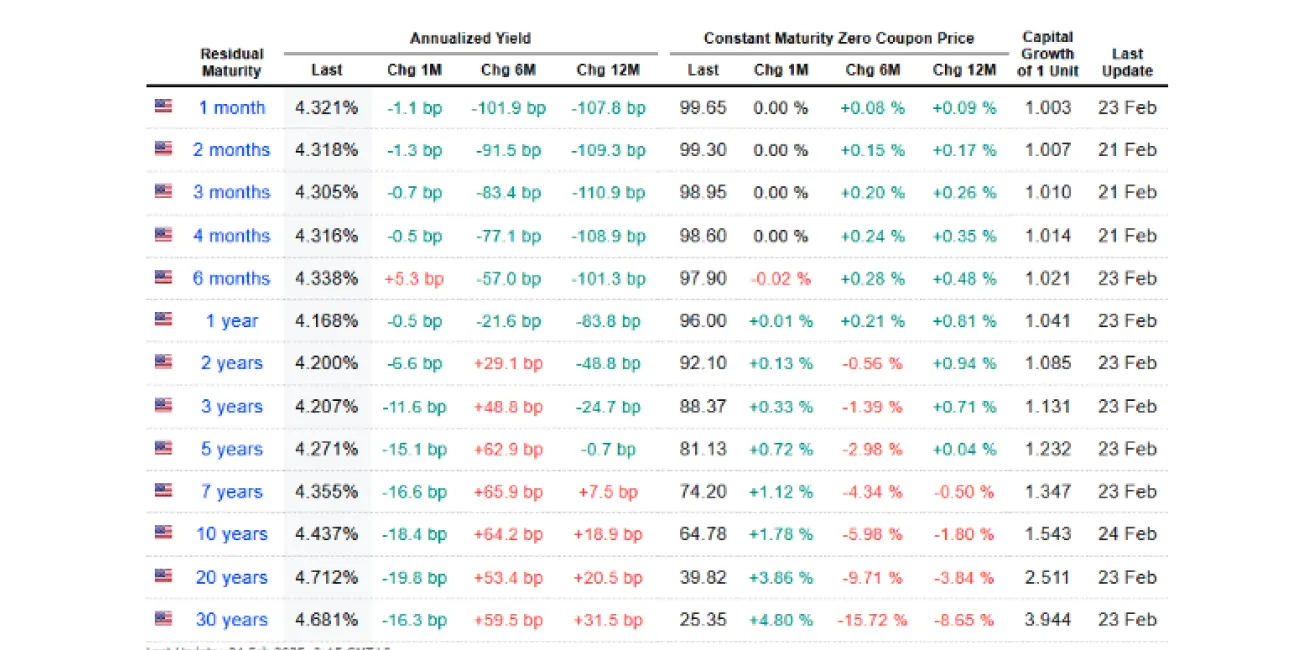
Yield Curve for U.S. Treasuries:
- Short-term (up to 1 year): 4.321 - 4.168%
- Mid-term (3-7 years): 4.207 – 4.355%
- Long-term (10+ years): 4.437-4.681%
This year, TIPS (Treasury Inflation-Protected Securities) have seen capital inflows surpassing levels last recorded in mid-2022. While elevated, these inflows remain below the peaks observed in 2020-2021.
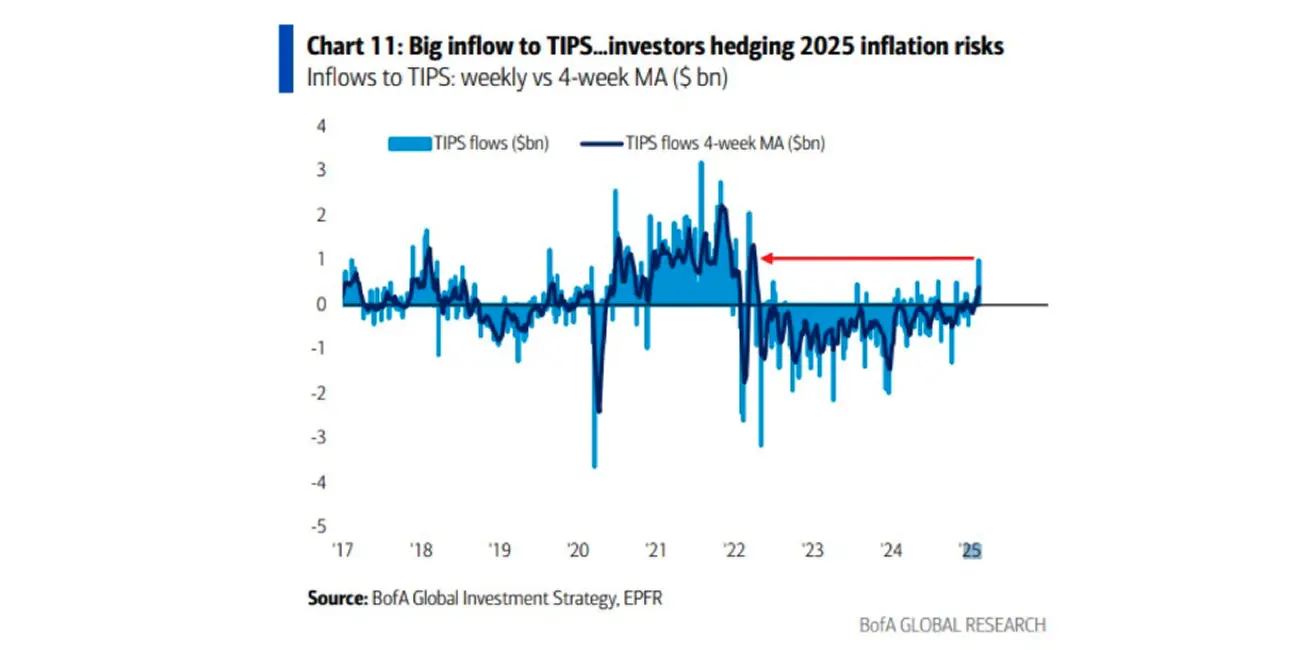
Explanation: When inflation rises, TIPS payouts increase; conversely, in periods of deflation, payouts decrease. TIPS serves as a hedging instrument against inflationary risks, offering investors protection against the erosion of purchasing power.
GOLD FUTURES (DX)
Gold Futures (GC): Price consolidation persists within the $2,950–$2,970 range, establishing a resistance level.
- Weekly performance: +1.93% (closing at $2,949.6 per troy ounce).
- Year-to-date growth (2025): +11.68%.
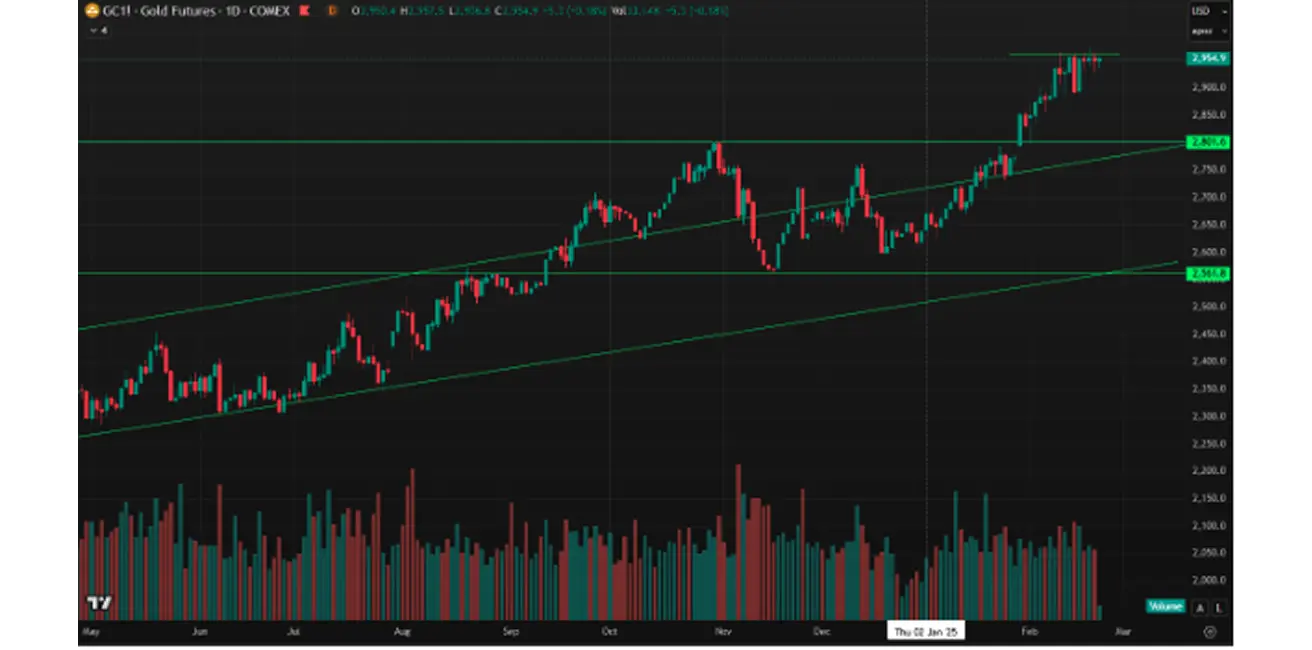
Revised 2025 Forecasts:
- UBS: $3,200 (driven by heightened demand for safe-haven assets amid economic uncertainty).
- Goldman Sachs: $3,100 (strong central bank demand coupled with geopolitical uncertainty).
DOLLAR INDEX FUTURES (DX)
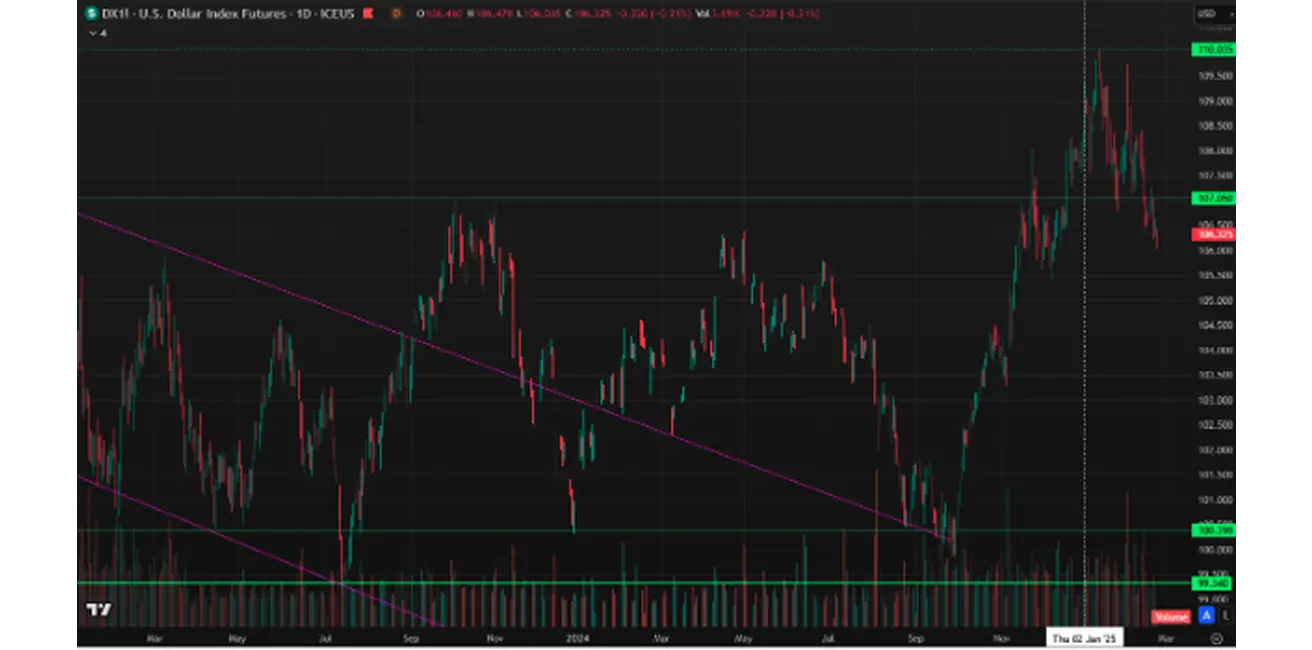
U.S. Dollar Index Futures (DX): After breaching the 107 level and completing a retest, the index resumed its decline.
- Weekly performance: -0.13% (closing at 106.545).
- Year-to-date (2025): -1.65%.
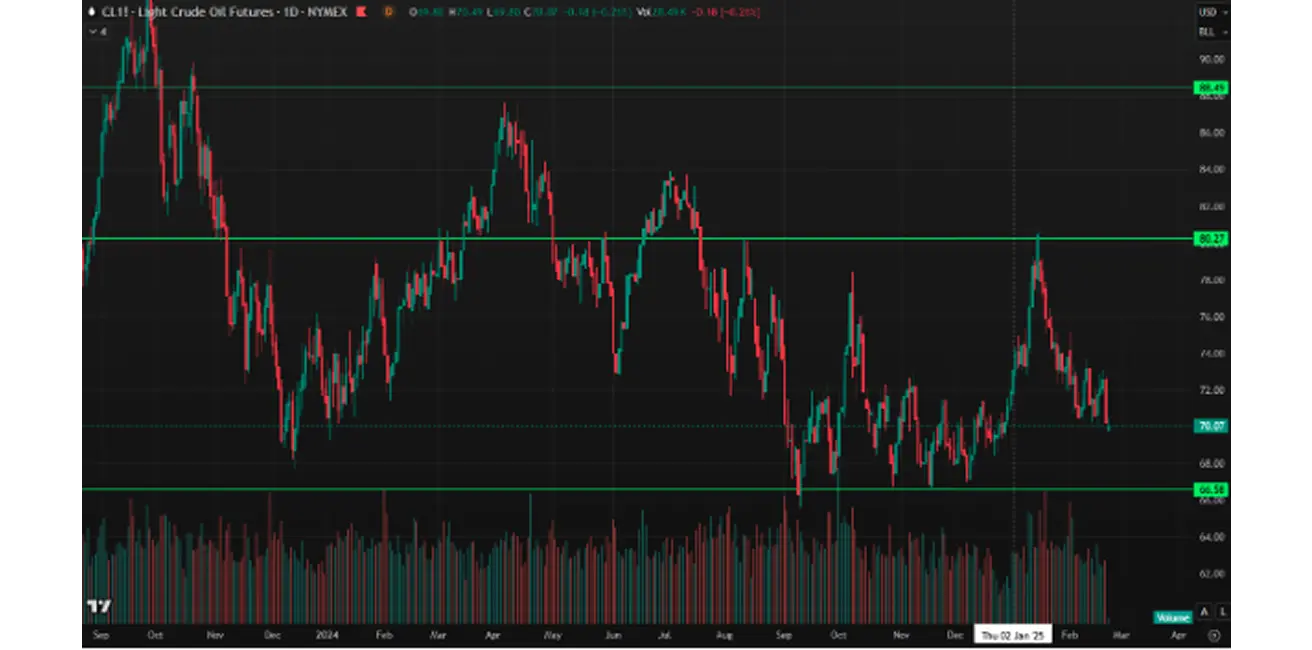
OIL FUTURES
- Weekly performance: -0.45% (closing at $70.25 per barrel).
- Year-to-date: -2.23%.
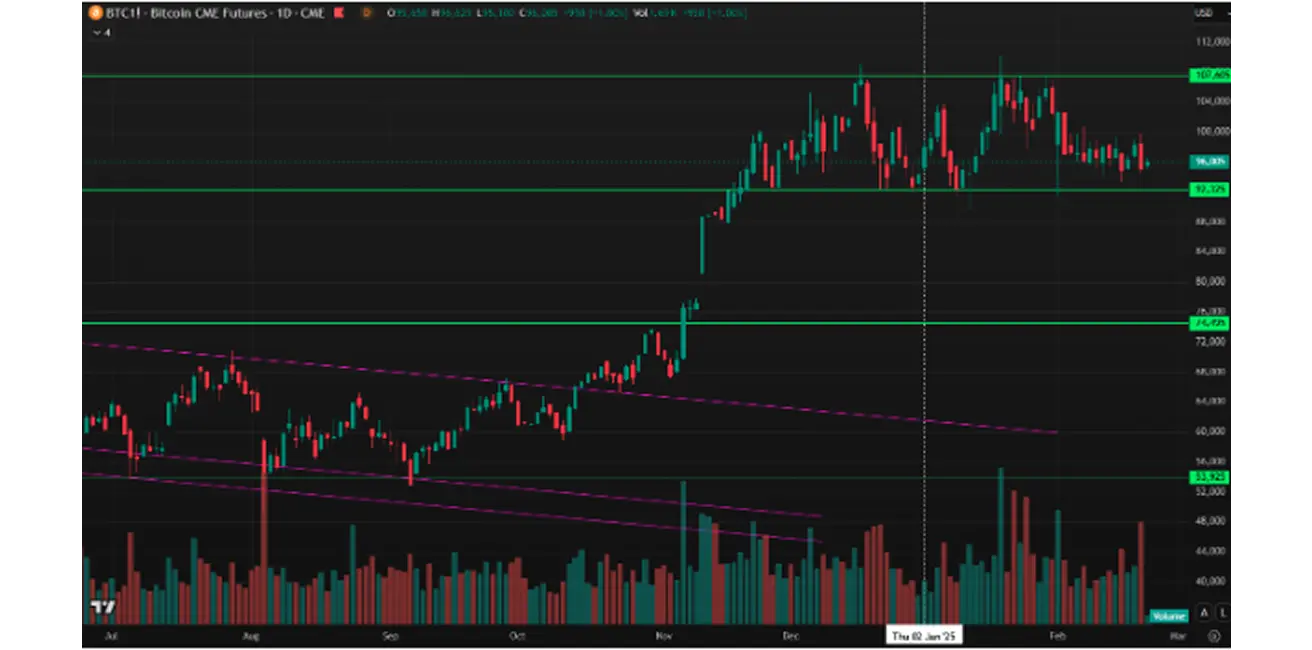
BTC FUTURES
Trading has remained within a horizontal range since November.
- Weekly performance: -2.85% (closing at $95,055).
- Year-to-date (2025): -0.23%.
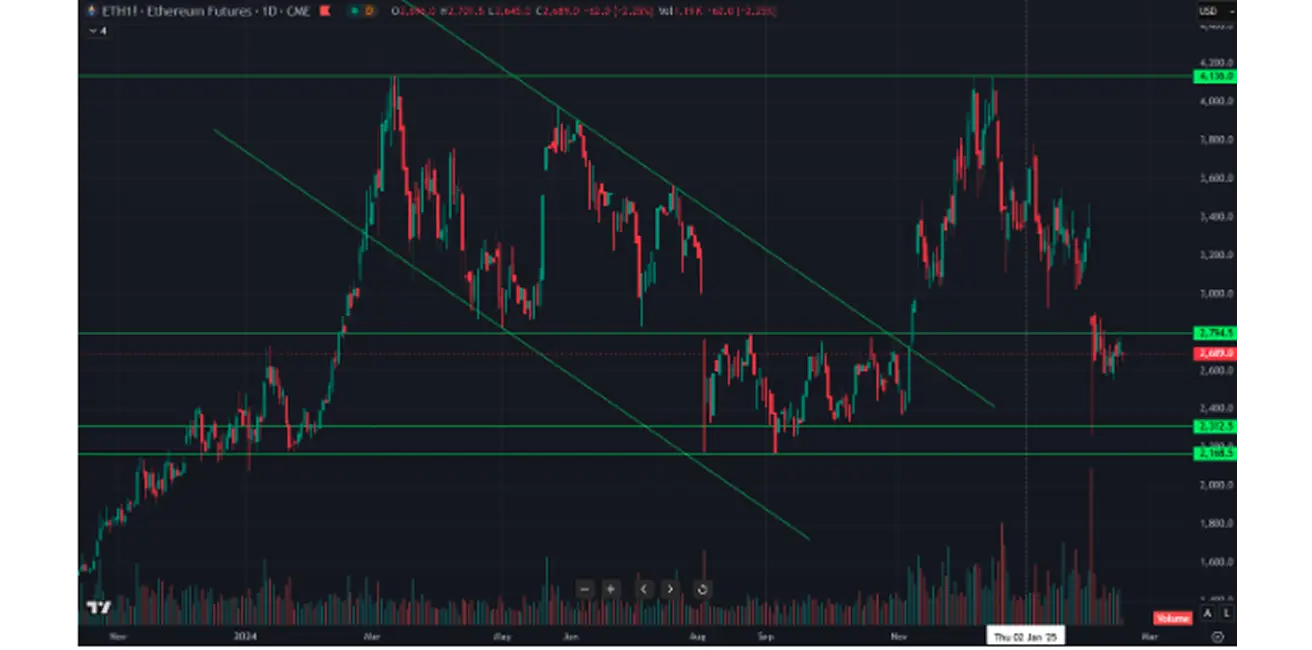
ETH FUTURES
Declining at a faster pace, with a weekly drop of -4.27% (closing at $2,633.5). Year-to-date (2025): -22.18%.
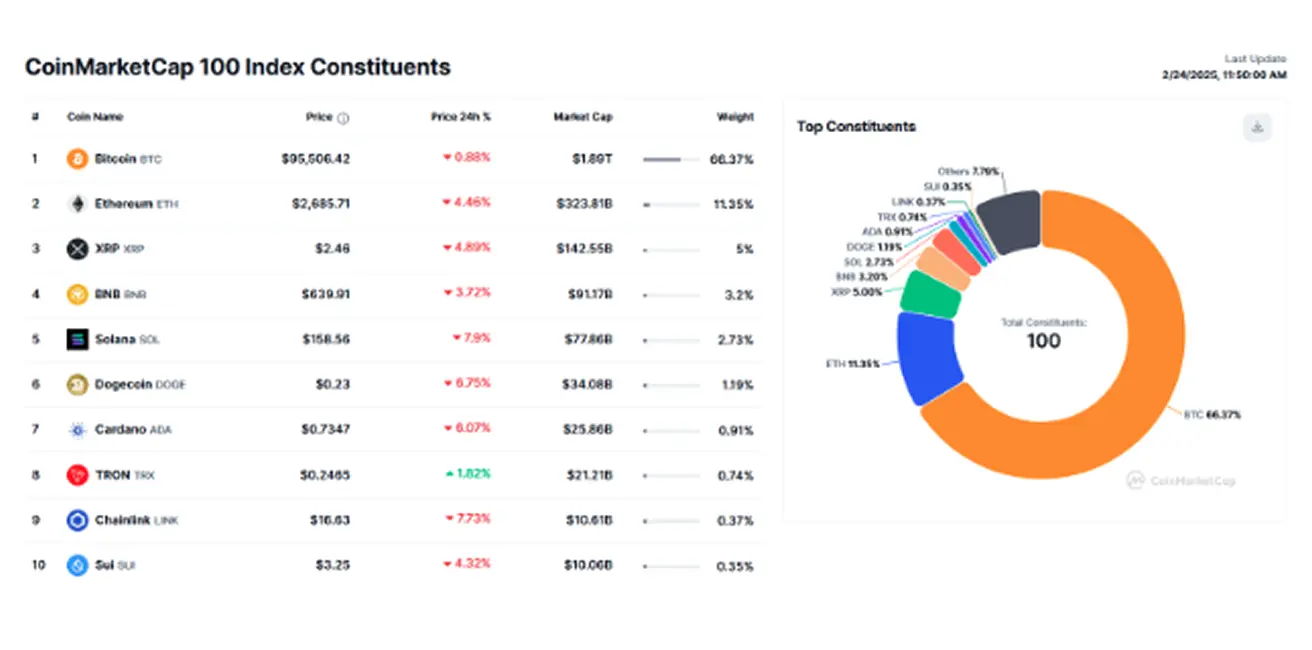
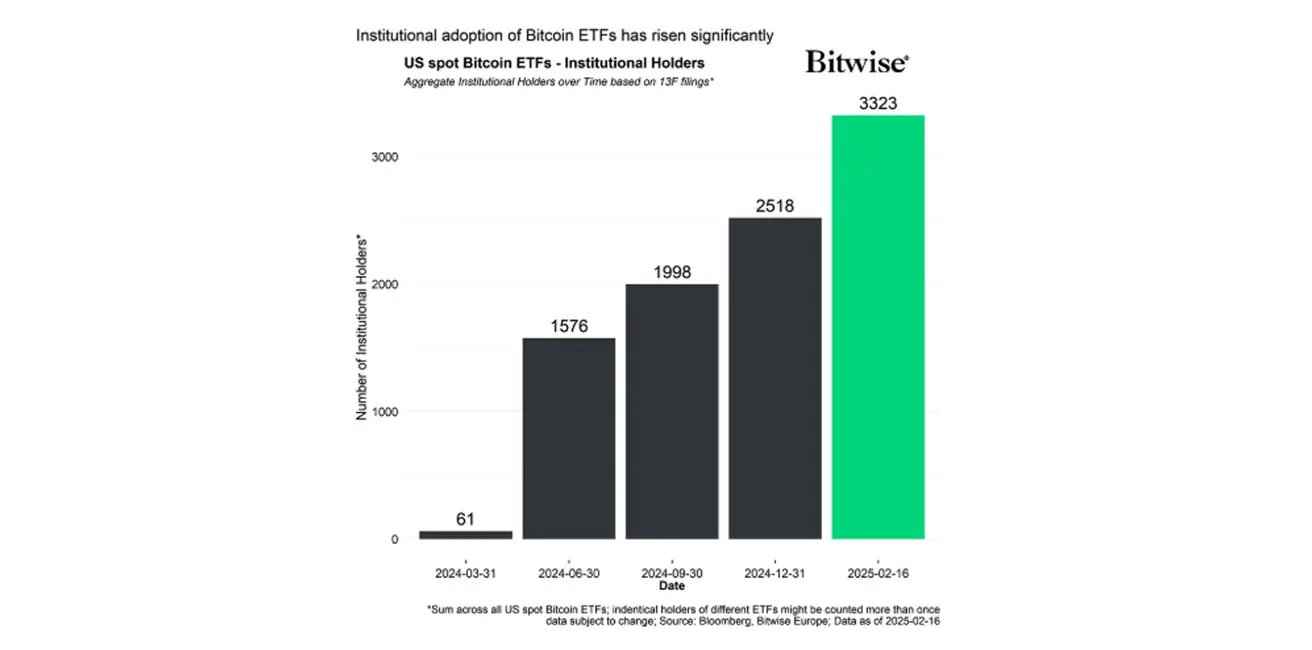
According to Bitwise, the number of institutional holders of Bitcoin ETFs has risen to 3,323, reflecting an average monthly growth rate of 11.25% since June 2024.
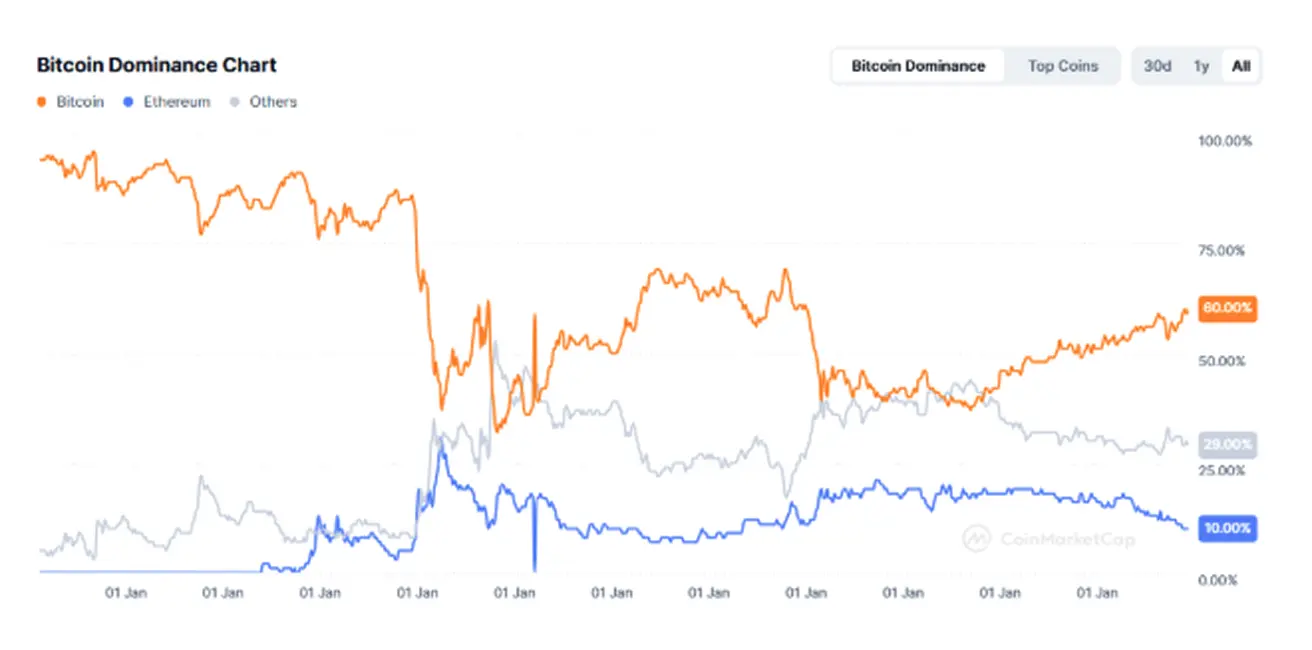
The total cryptocurrency market capitalization stands at $3.10 trillion (down from $3.19 trillion a week earlier, according to CoinMarketCap).
- Bitcoin dominance: 61.2% (previously 59.8%).
- Ethereum dominance: 10.5% (previously 10.2%).
- Other assets: 28.4% (previously 30.0%).