Lietuvių
 Русский
 Қазақша
 Eesti
EestiFebruary 24 - 28, 2025: Weekly economic update
Key market updates

MACROECONOMIC STATISTICS
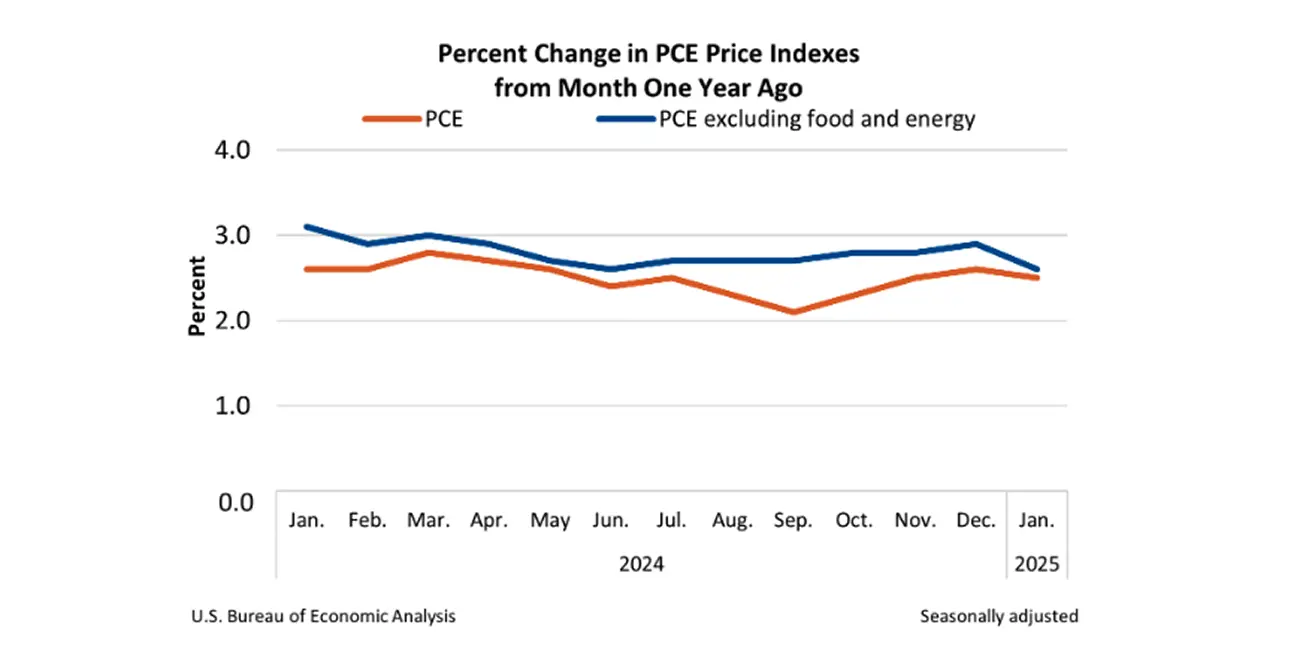
INFLATION
- Core Consumer Price Index (CPI) (m/m) (January): 0.4% (prev: 0.2%);
- Consumer Price Index (CPI) (m/m) (January): 0.5% (prev: 0.4%);
- Core Consumer Price Index (CPI) (y/y) (January): 3.3% (prev: 3.2%);
- Consumer Price Index (CPI) (y/y) (January): 3.0% (prev: 2.9%).
INFLATION EXPECTATIONS (MICHIGAN)
- 12-month expected inflation (January): 4.3%, prev: 4.3%;
- 5-year expected inflation (January): 3.5%, prev: 3.3%.
GDP (BEA – U.S. Bureau of Economic Analysis) (q/q) (Q) (Preliminary Estimate):
- 2.3% (prev: 3.1%)
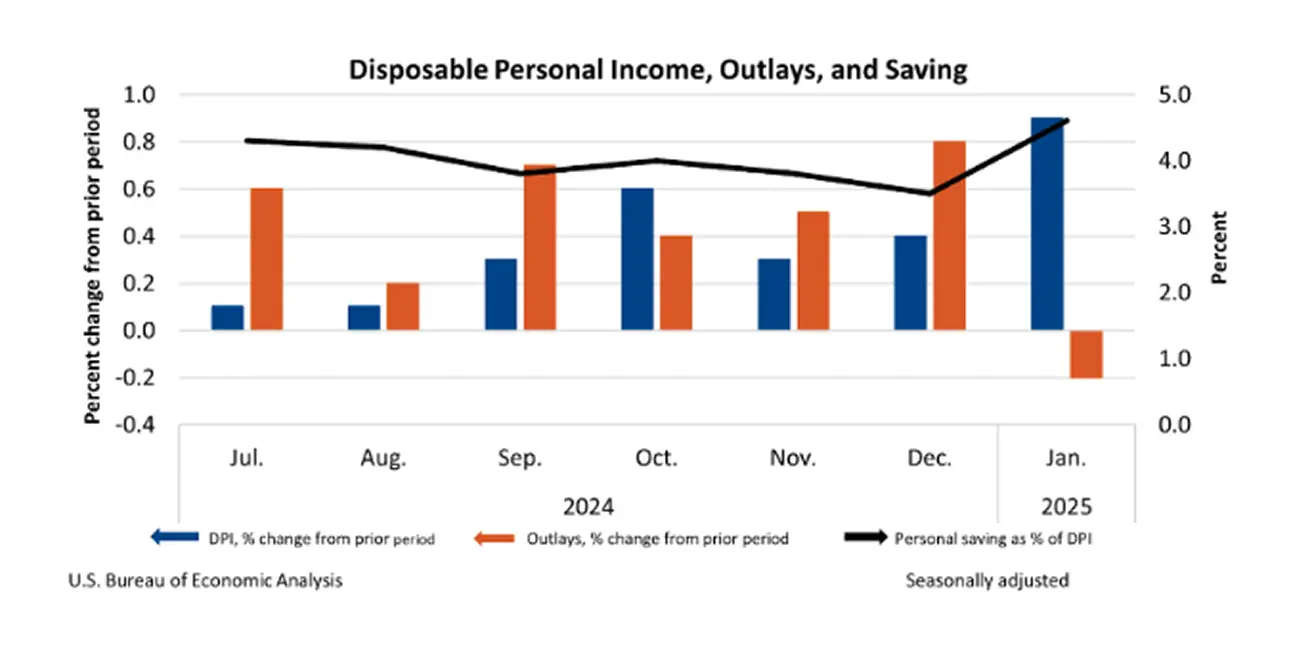
- Disposable Personal Income (DPI) (personal income minus current personal taxes): 0.9%;
- Personal Consumption Expenditures (PCE): -0.2%;
- Personal Savings Rate (personal savings as a percentage of disposable personal income): 4.6%.
BUSINESS ACTIVITY INDEX (PMI):
- Services Sector (December): 49.7 (prev: 52.8);
- Manufacturing Sector (December): 51.6 (prev: 50.1);
- S&P Global Composite (December): 50.4 (prev: 52.4).
LABOR MARKET:
- Unemployment Rate (January): 4.0% (prev: 4.1%);
- Nonfarm Payrolls Change (January): 143K (prev: 307K);
- Private Nonfarm Payrolls Change (January): 111K (prev: 273K revised);
- Average Hourly Earnings (January, y/y): 4.1% (prev: 4.1%).
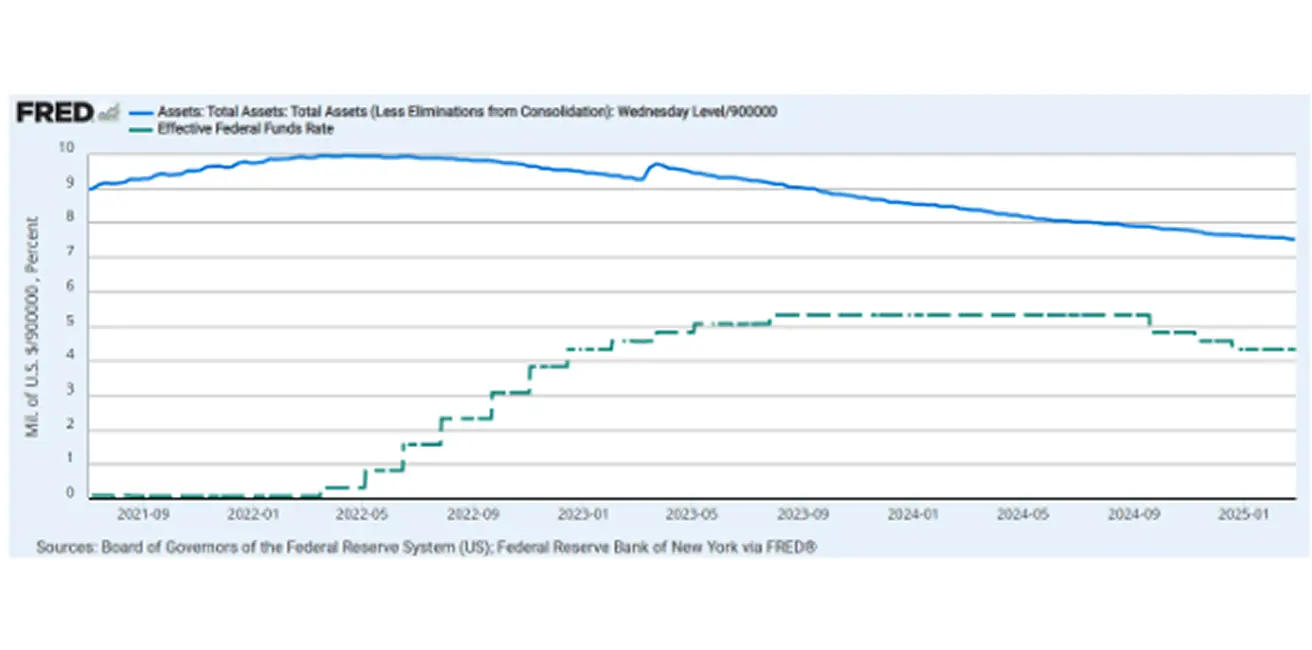
MONETARY POLICY
- Federal Funds Rate (EFFR): 4.25%–4.50% (dotted line);
- Fed Balance Sheet (blue): $6.766 trillion (vs previous week: $6.782 trillion)
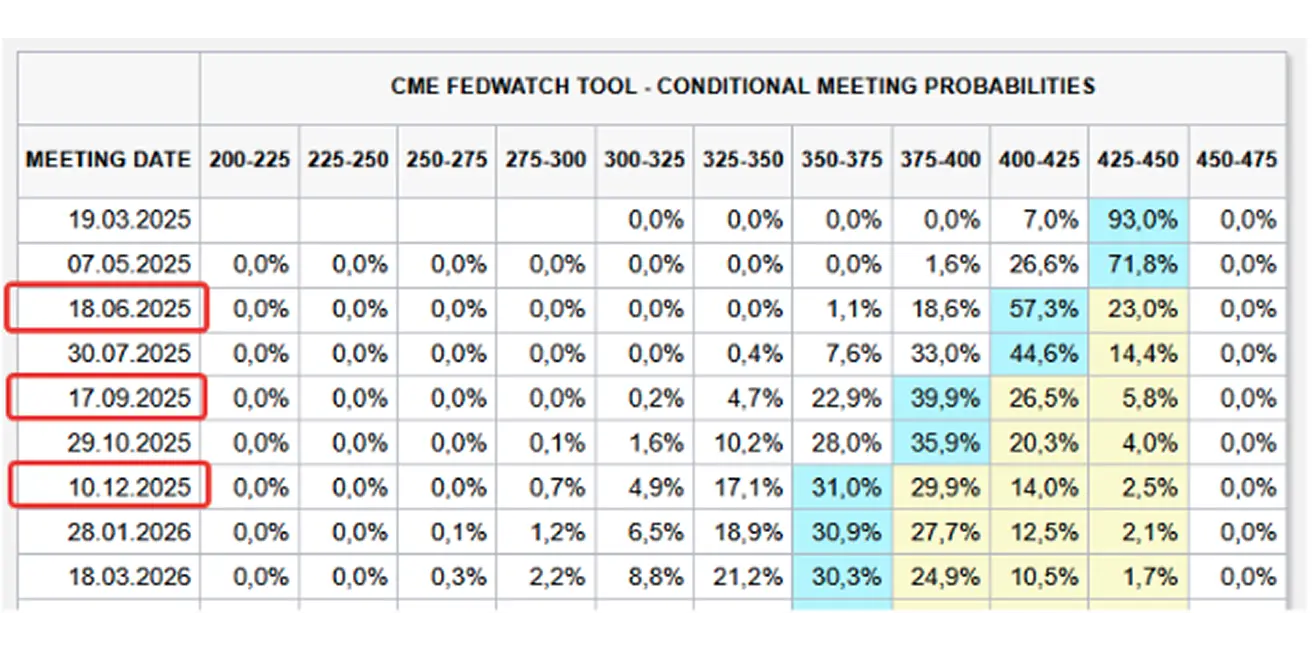
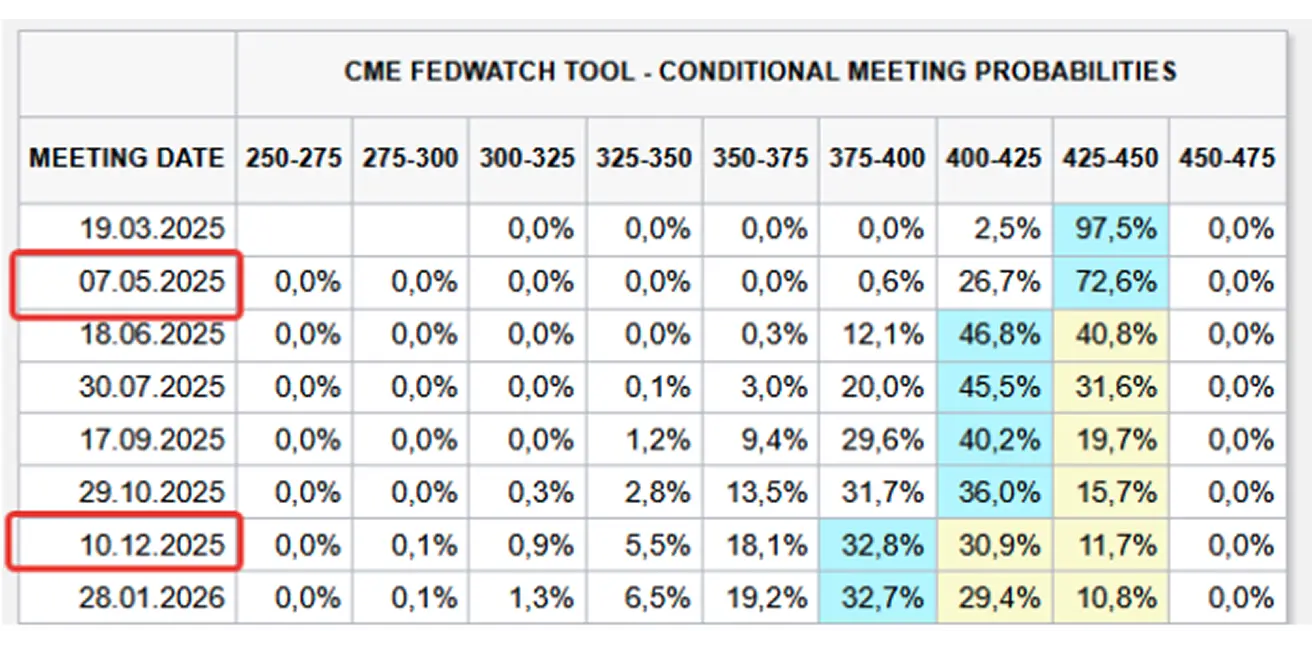
MARKET FORECAST FOR RATE
Today:
А week earlier:
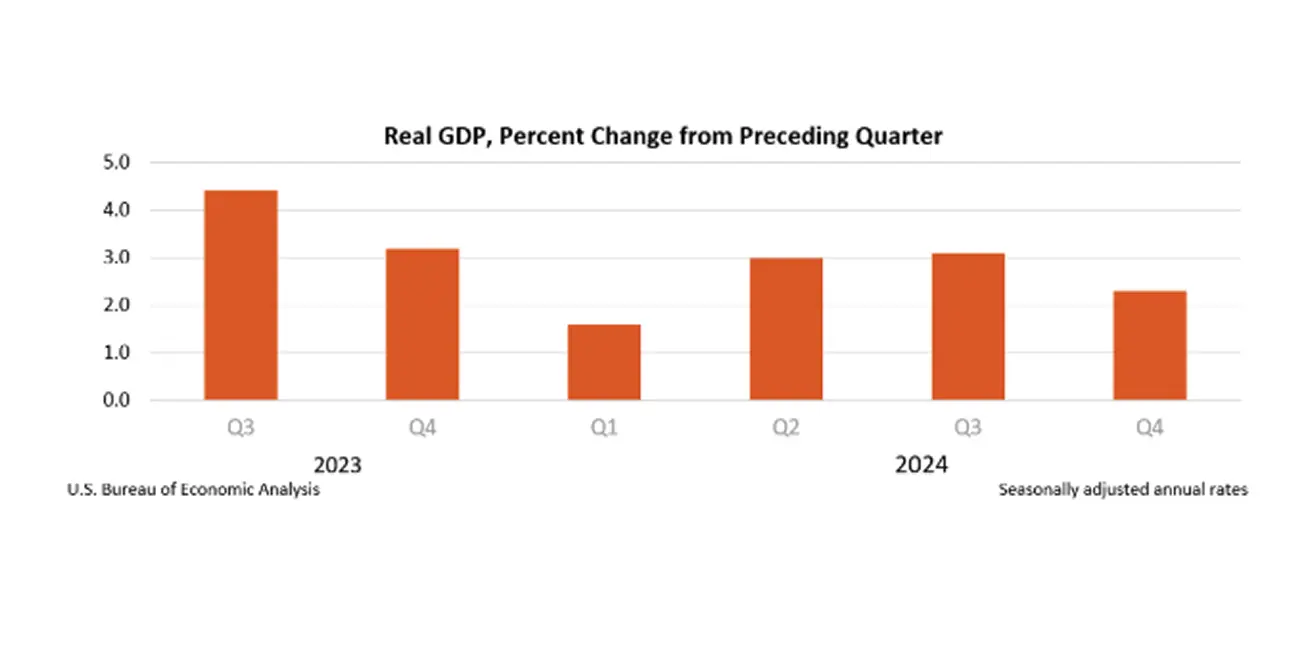
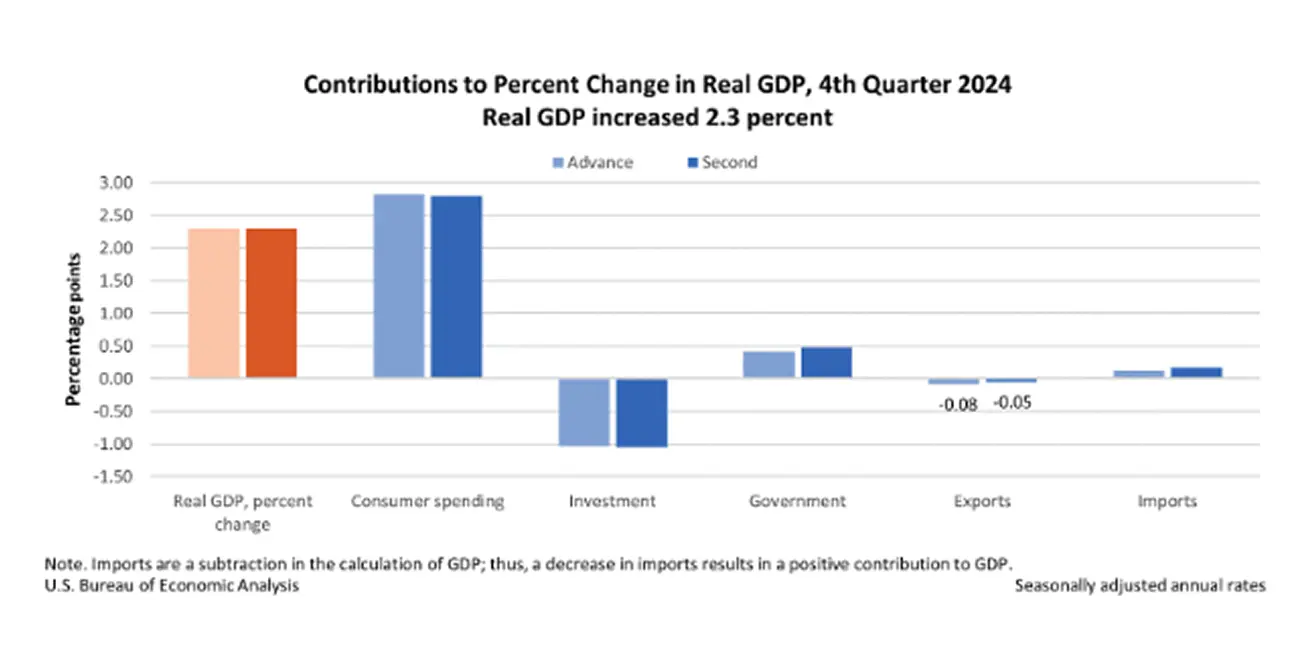
Commentary: According to the second estimate, in the fourth quarter of 2024 (October, November, and December), gross domestic product (GDP) grew at an annualized rate of 2.3%, following a 3.1% increase in the third quarter.
The GDP expansion was primarily driven by growth in consumer and government spending. However, compared to the third quarter, a slowdown is evident due to a decline in investments and exports. While the economy is gradually decelerating, the current figures still exceed annual forecasts, which hover around 2%.
In January, consumer income increased by +0.9%, significantly surpassing market expectations and marking the sharpest rise in a year. This surge in personal income was mainly attributed to higher personal current transfer receipts (social security benefits), wage growth in the private sector, and increased income from assets—driven primarily by rising dividend payments.
For the first time in a long period, consumer spending declined by -0.2%. The downward revision of consumer expenditures primarily reflected a downgrade in spending on goods, partially offset by an upward revision in spending on services.
A contraction in consumer spending is likely to weigh on the next GDP release. However, more importantly, a sustained and substantial reduction in expenditures could raise concerns about the resilience of the U.S. economy.
Market expectations based on the FedWatch tool indicate three rate cuts: the first 0.25% reduction in June, followed by another in August, and a third in December, bringing the expected target range to 3.50%-3.75%.
MARKET
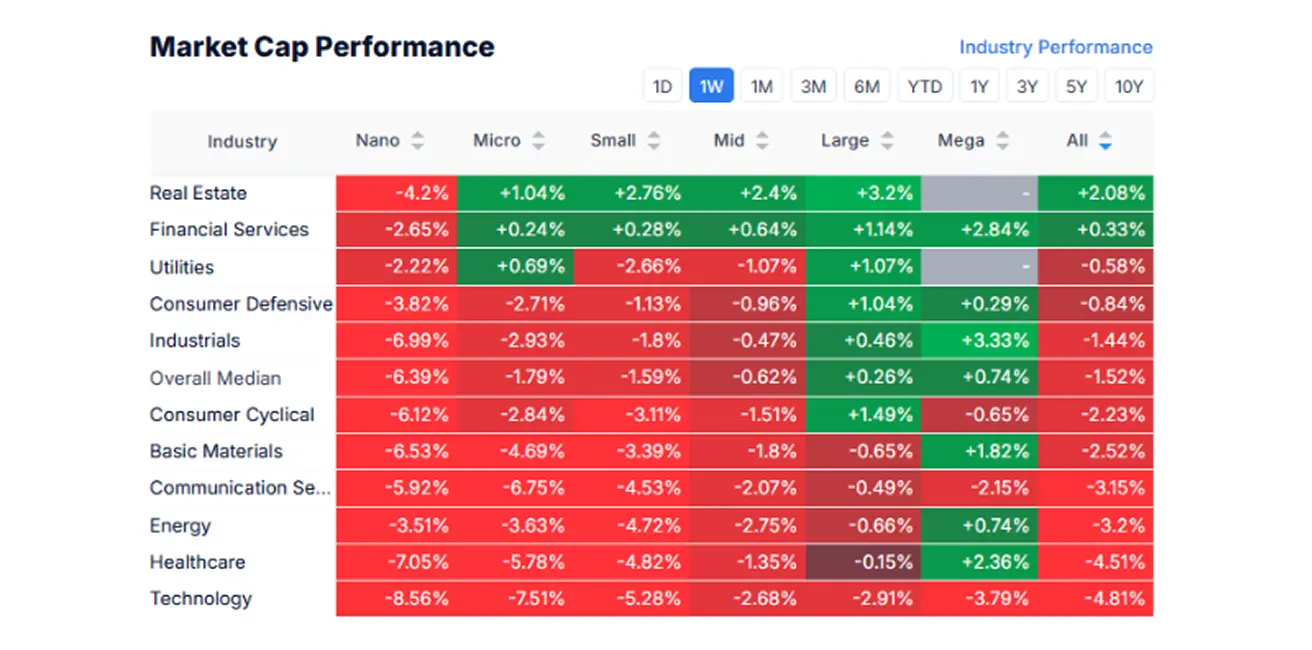
MARKET CAP PERFORMANCE
Last week, the stock market remained negative, with small- and mid-cap equities experiencing broad declines. The median market drop stood at -1.52%.
Real estate and financials were the best-performing sectors, demonstrating relative resilience amid overall market weakness. Conversely, the technology, healthcare, and energy sectors emerged as the worst performers, rounding out the bottom three laggards.
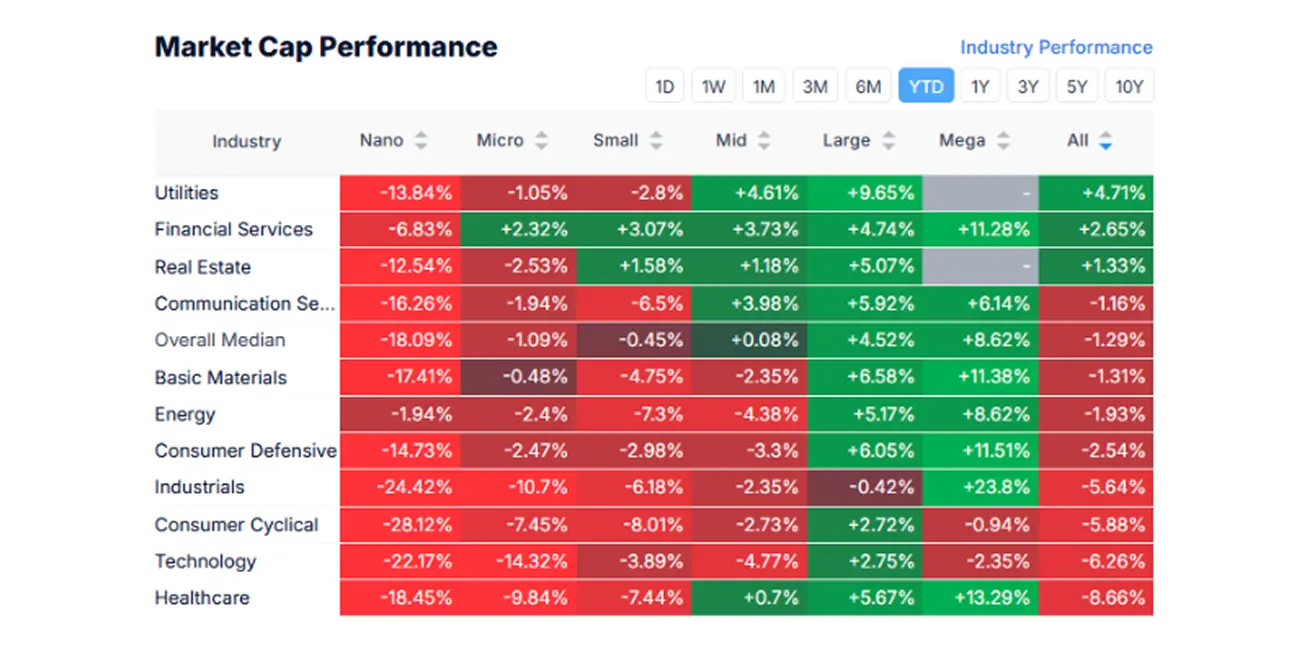
YTD (Year-to-Date: the period from the beginning of the year to the present date).
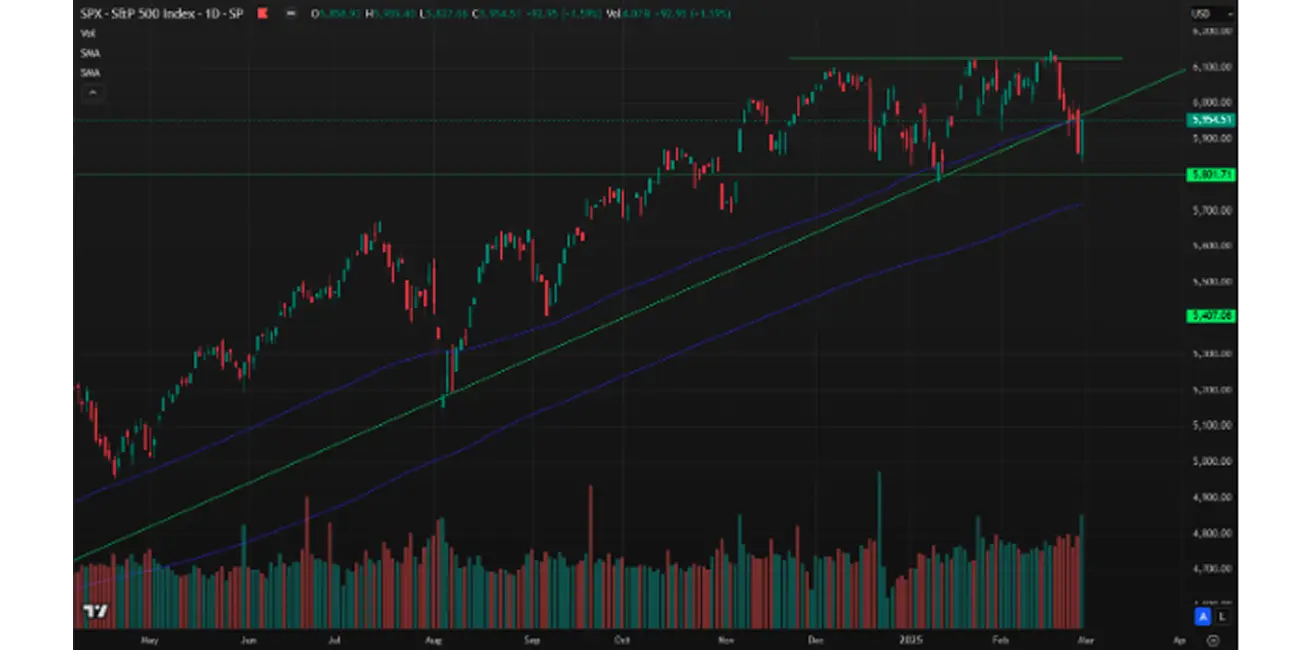
SP500
Weekly performance: -0.97% (week's closing at 5,954.51). Year-to-date growth in 2025: +0.87%.
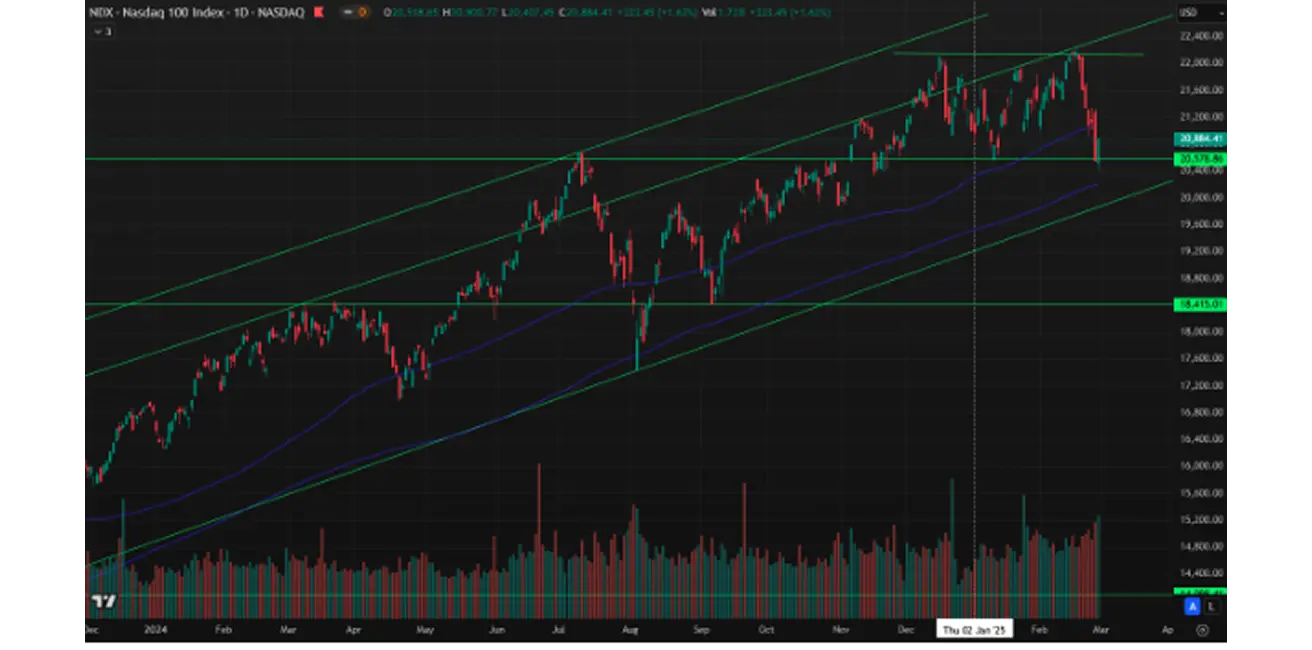
NASDAQ100
Nasdaq 100: Weekly performance: -3.38% (week’s closing at 20,884.51). Year-to-date decline in 2025: -1.12%.
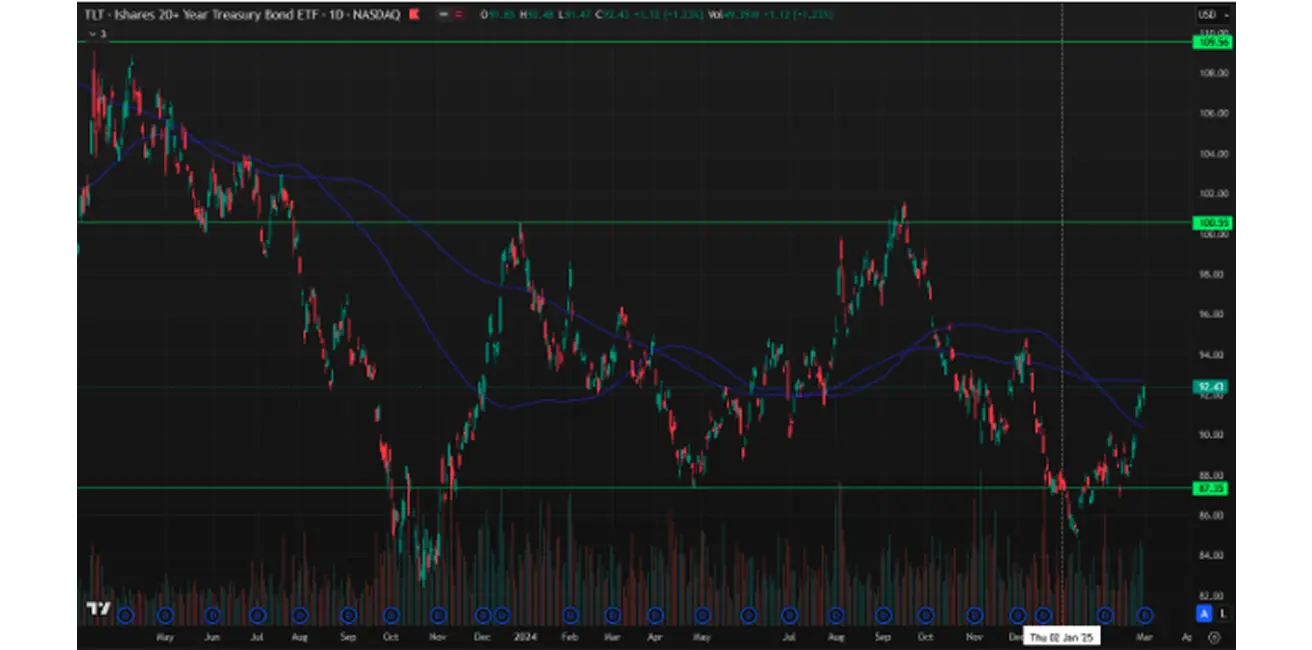
###BOND MARKET Bond Market – Significant gains over the week (declining yields). Treasury Bonds 20+ (ETF TLT): +3.15% (week’s closing at $92.43). Year-to-date performance in 2025: +5.27%.
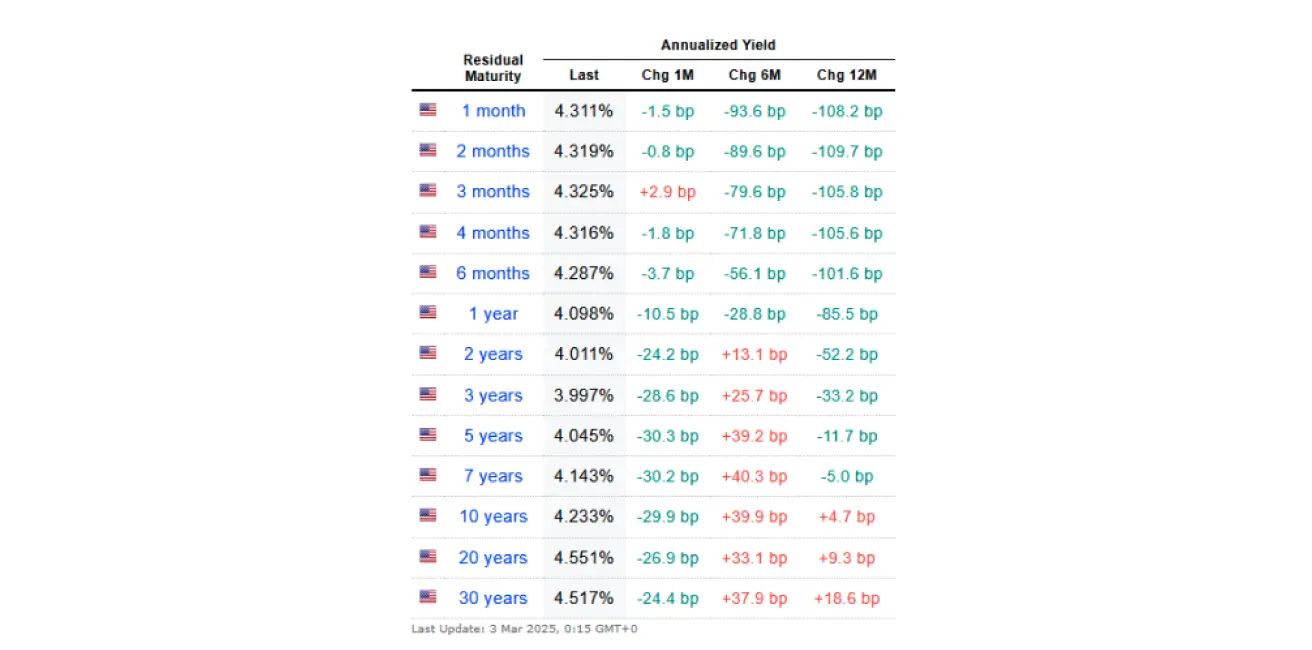
YIELDS AND SPREADS
Yields and Spreads 2025/02/17 vs 2024/02/14
- Market Yield on U.S. Treasury Securities at 10-Year Constant Maturity: 4,233% (4,437)%;
- ICE BofA BBB US Corporate Index Effective Yield: 5,30% (5,46%)
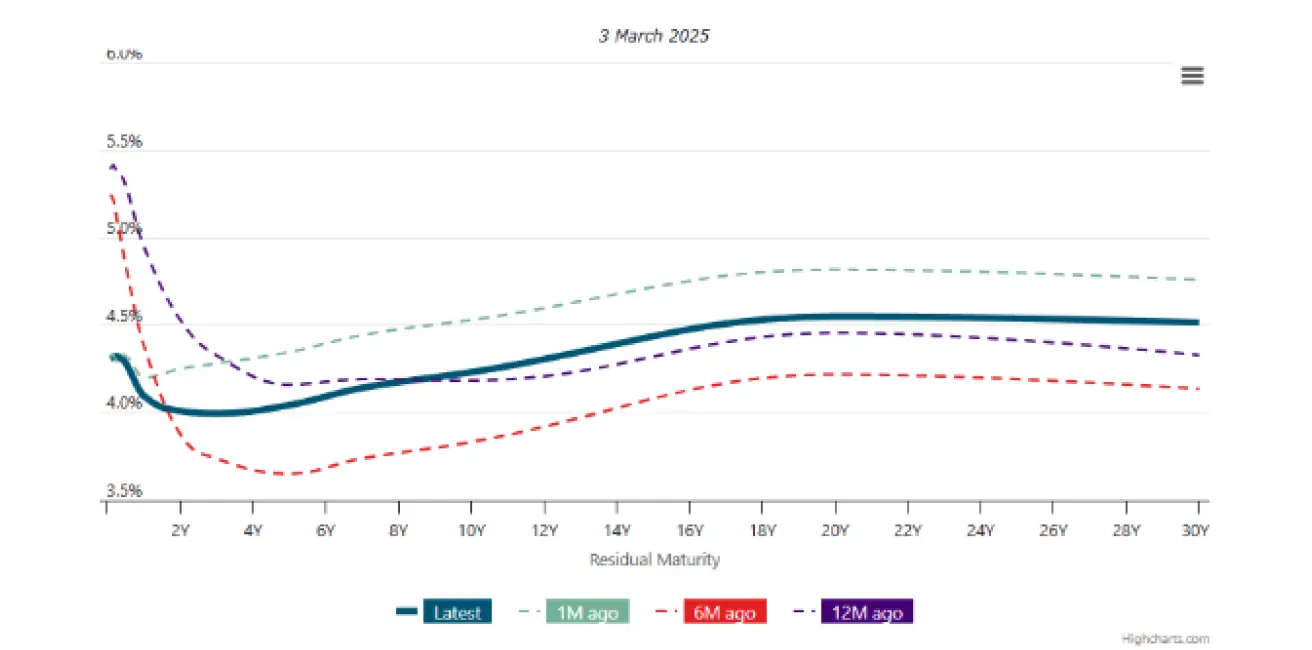
The yield spread between 10-year and 2-year U.S. Treasury bonds stands at 22.2 vs. 23.7 basis points, reflecting the difference in yields between long-term and short-term debt.
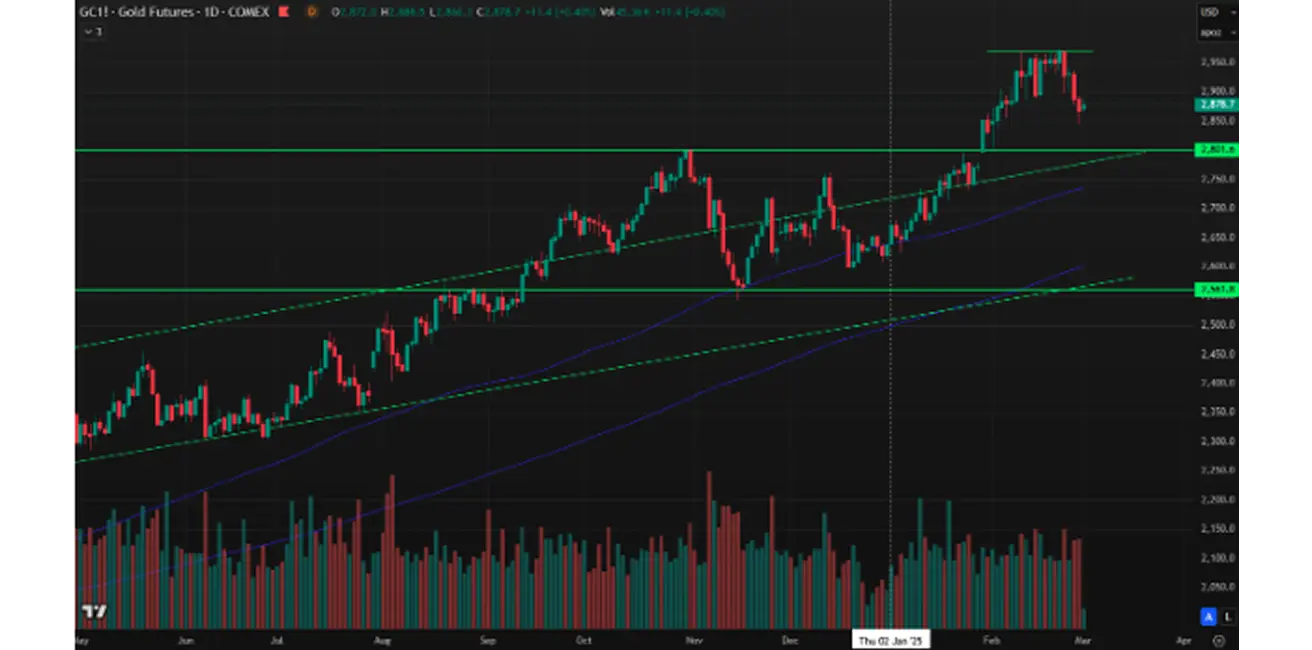
GOLD FUTURES (DX)
The price is correcting downward from its highs, posting a weekly decline of -2.79%, closing at $2,867.3 per troy ounce. Year-to-date performance in 2025: +8.57%.
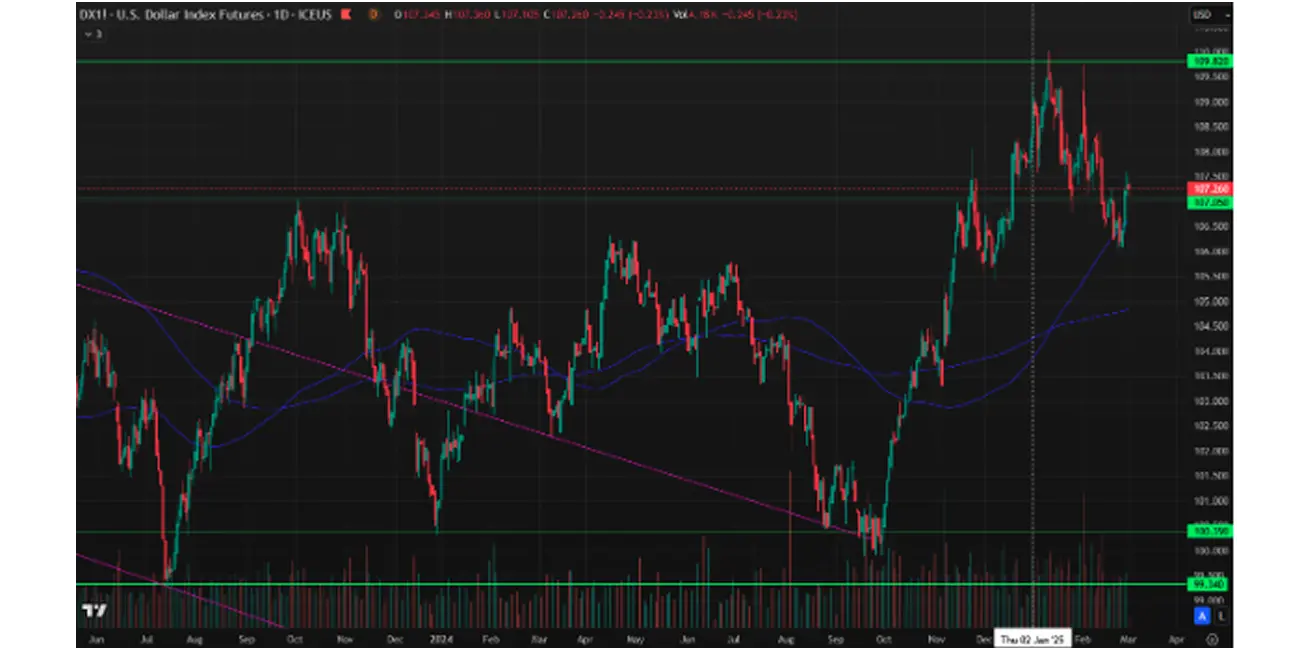
DOLLAR INDEX FUTURES (DX)
Despite improved expectations for rate cuts, it rose by 0.90% over the week, closing at 107.505. Year-to-date performance in 2025: -0.76%.
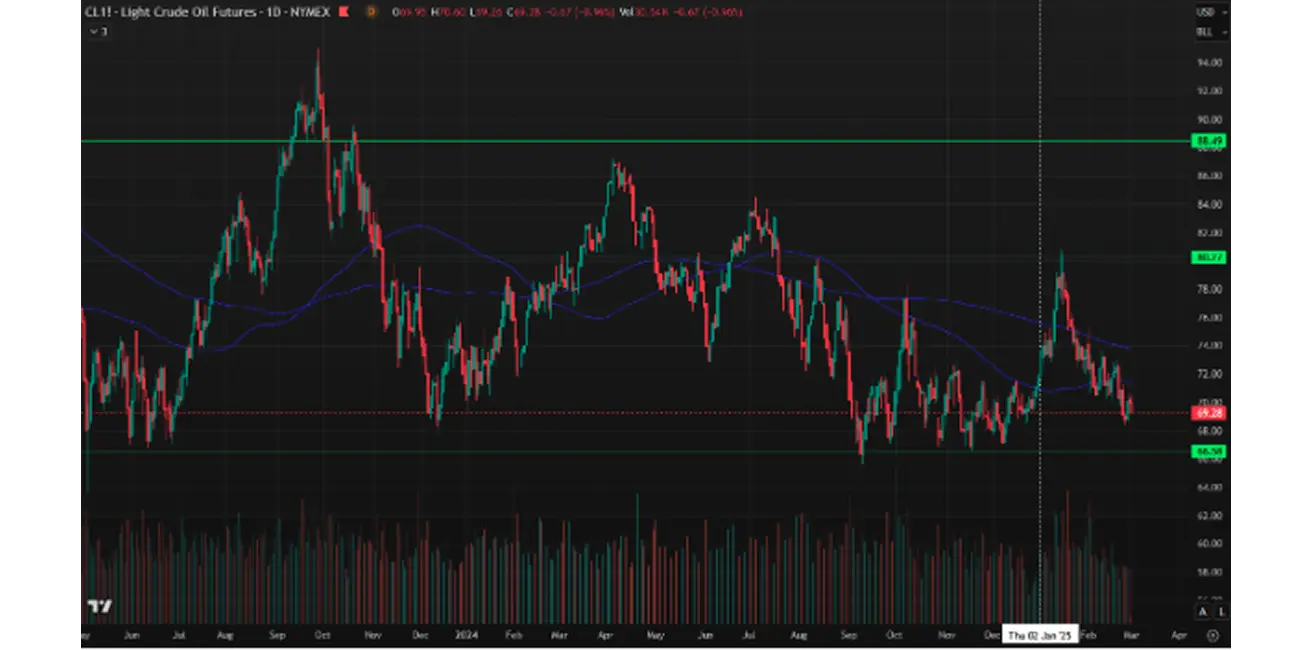
OIL FUTURES
Weekly performance: -0.43%, closing at $69.95 per barrel. Year-to-date performance: -2.64%.
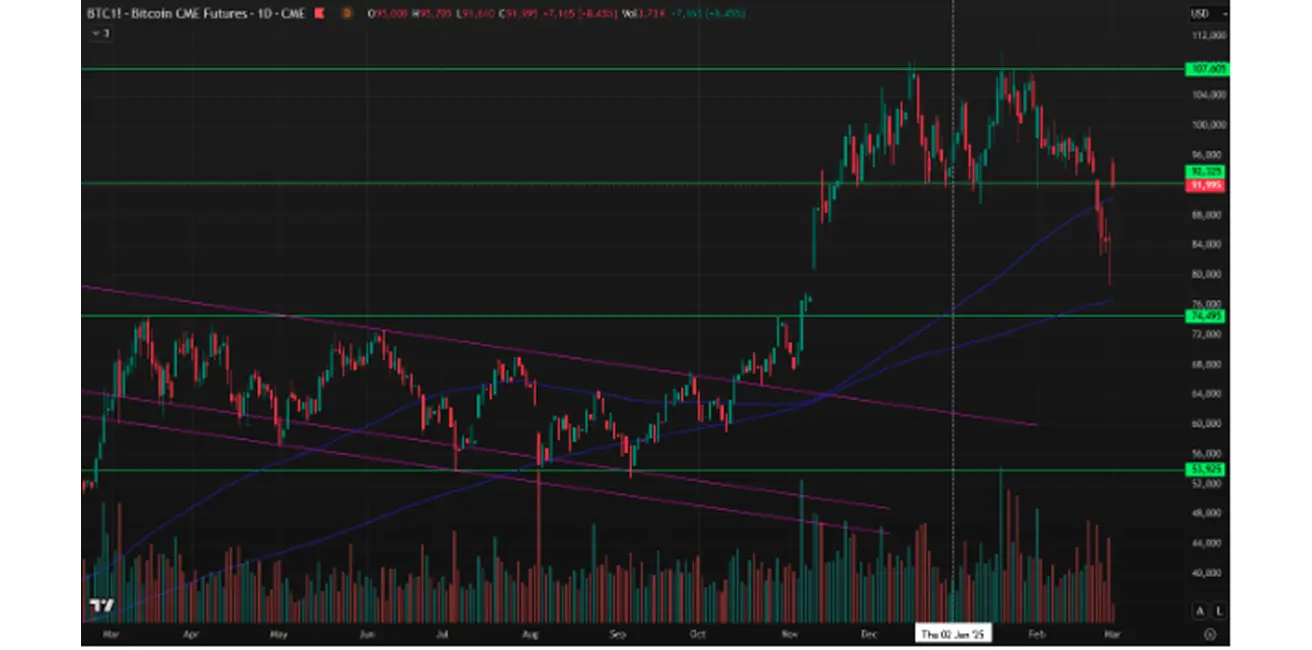
BTC FUTURES
Weekly performance: -10.76% (week’s closing at $84,830). Year-to-date performance in 2025: -10.96%.
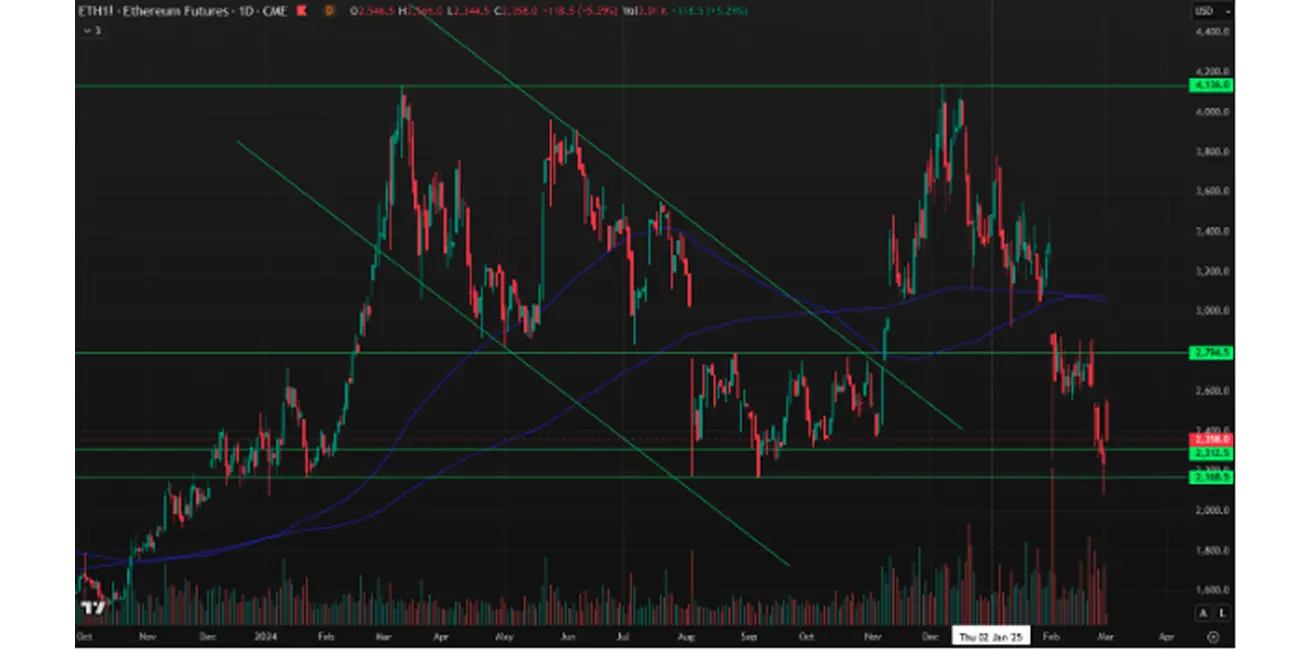
ETH FUTURES
Weekly performance: -14.96% (week’s closing at $2,239.5). Year-to-date performance in 2025: -33.82%.
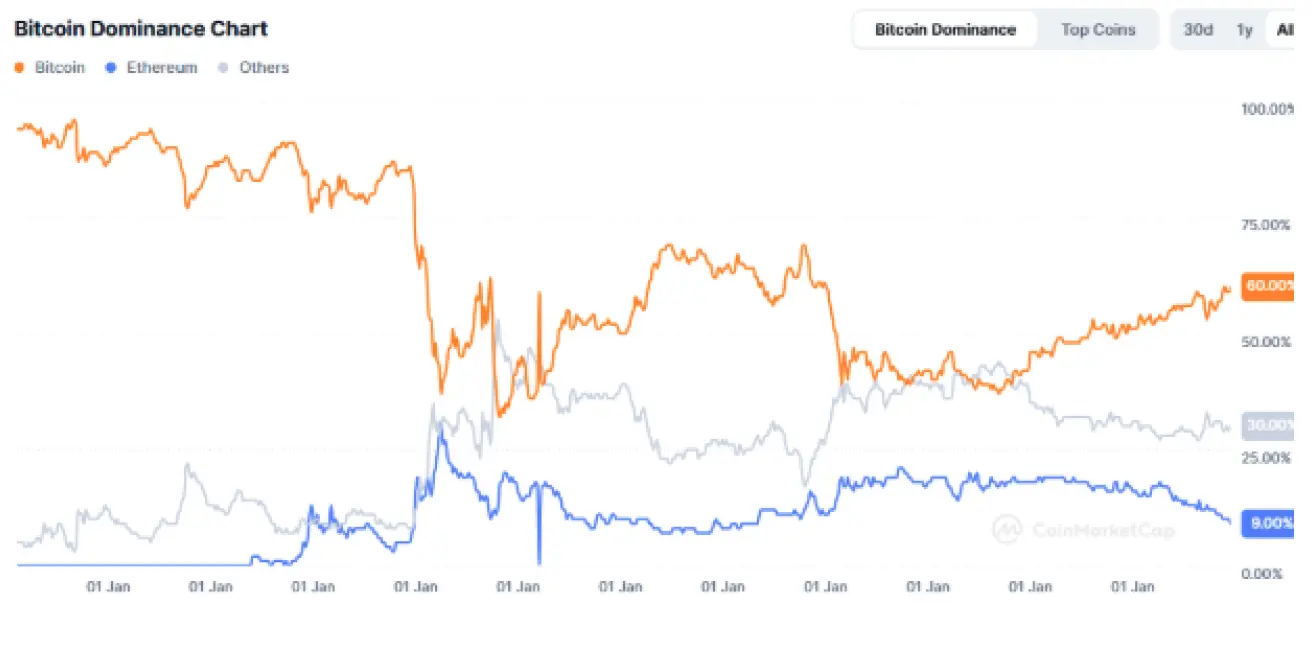
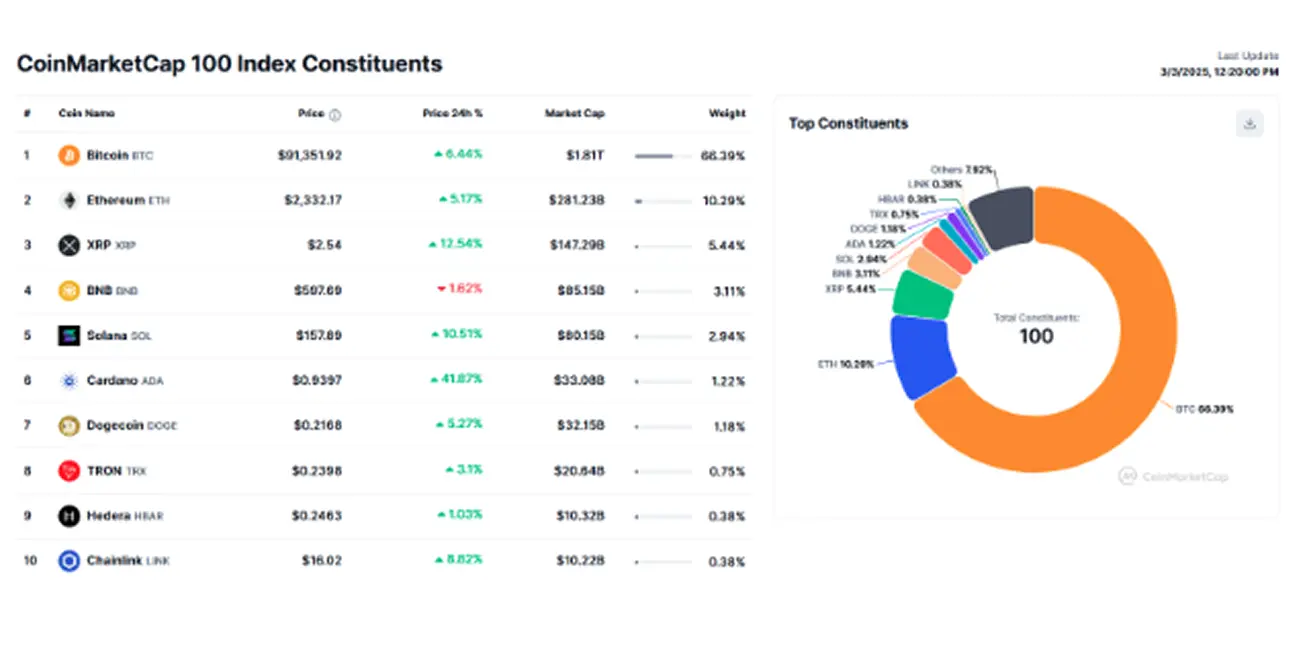
Crypto Market Capitalization fell to $3.09 trillion (from $3.10 trillion a week earlier) (source: CoinMarketCap).
- Bitcoin dominance: 60.4% (previously 61.2%)
- Ethereum dominance: 9.4% (previously 10.5%)
- Other assets: 30.2% (previously 28.4%)