Lietuvių
 Русский
 Қазақша
 Eesti
EestiFebruary 9 – 15, 2026: Weekly economic update
Key market updates

Last week, equity markets edged slightly lower amid robust labour market data. The unemployment rate declined to 4.3%, while nonfarm payrolls increased by 130,000, including a 172,000 gain in the private sector.
According to the BLS report, the U.S. labour market is showing signs of stabilisation following a period of deceleration, during which job growth was limited, and the unemployment rate gradually trended higher. Although most analysts continue to anticipate a subdued labour market trajectory in 2026, improved clarity in economic policy — particularly regarding the Trump administration’s tariff framework — alongside lower borrowing costs may support hiring activity in selected sectors.
Stronger labour market data reduces the likelihood that the Federal Reserve will deem it necessary to resume rate cuts before mid-year.
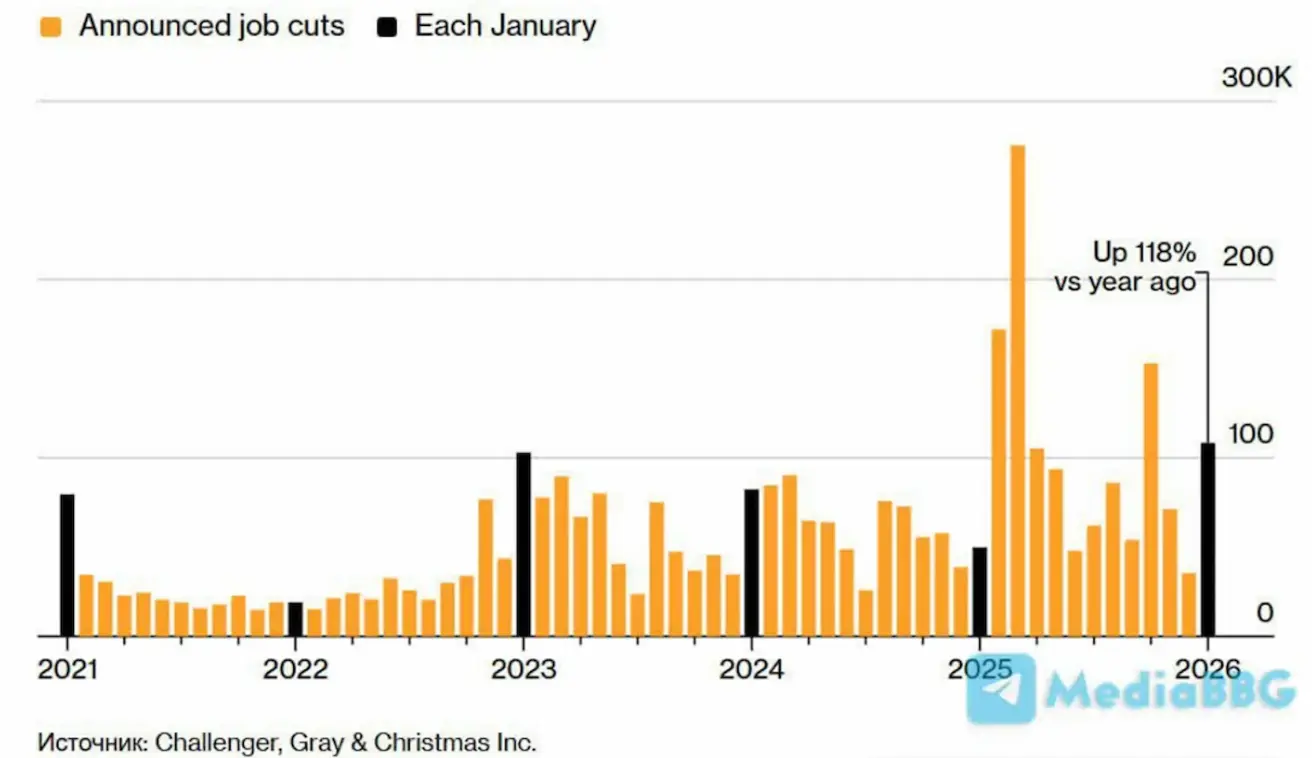
At the same time, U.S. companies announced the highest number of job cuts for the month of January since 2009 during the current earnings season.
The Republican-controlled U.S. House of Representatives backed an initiative to repeal tariffs on Canadian goods imposed under Donald Trump’s administration. The move reflects mounting concern among certain lawmakers regarding the White House’s economic course.
In response, Trump signalled his readiness to exercise veto power should similar measures advance further, substantially diminishing the probability of the bill’s final passage. He also indicated that supporting tariff repeal could carry political consequences for members of his party.
The voting outcome underscores intensifying domestic political tensions ahead of the upcoming elections: several Republicans distanced themselves from Trump’s position, while Democrats consistently opposed the tariff policy.
Against this backdrop, the Congressional Budget Office projects that Trump-era tariffs would reduce the federal deficit by $3 trillion over the next decade.
United States — Key Talking Points for the Sales Team
- Policy rate unchanged; communication remains cautious.
- Monetary policy stance remains moderately restrictive, with a gradual shift toward neutrality.
- The Federal Reserve is maintaining a delicate balance: supporting financial markets while refraining from signalling imminent rate cuts.
- U.S. macroeconomic data continue to support a soft-landing scenario: economic growth remains above potential, inflation is moderating, and the labour market is cooling without exhibiting signs of recession.
Macroeconomic Statistics
INFLATION: CONSUMER PRICE INDEX (DECEMBER):
- Core CPI: (m/m) 0.2% (prev: 0.2%); (y/y) 2.6% (prev: 2.6%).
- CPI: (m/m) 0.3% (prev: 0.3%); (y/y) 2.7% (prev: 2.7%).
PRODUCER PRICE INDEX (JANUARY):
- PPI (m/m): 0.5%, prev: 0.2%.
- Core PPI (m/m): 0.7%, prev: 0.3%.
INFLATION EXPECTATIONS (MICHIGAN) (DECEMBER):
- 12-month inflation expectations: 3.5%, prev: 4.0%.
- 5-year inflation expectations: 3.4%, prev: 3.3%.
GDP (U.S. Bureau of Economic Analysis, BEA) (Q3 2025, annualized, second estimate): +4.4% (Q2 2025: +3.8%). GDPNow indicator (“current” estimate of official GDP prior to release) by the Federal Reserve Bank of Atlanta: 3.7% (prev: 4.2%).
BUSINESS ACTIVITY INDEX (PMI) (DECEMBER):
(Above 50 indicates expansion; below 50 indicates contraction)
- Services sector: 52.7 (prev: 52.5);
- Manufacturing sector: 52.4 (prev: 51.9);
- S&P Global Composite: 53.0 (prev: 52.7).
LABOR MARKET (BLS) (December)
- Unemployment rate: 4.3% (prev: 4.4%);
- Total number of continuing jobless claims in the U.S.: 1,844K (prev: 1,819K);
- Initial jobless claims: 231K (prev: 209K, revised);
- Change in nonfarm payroll employment: 130K (prev: 48K);
- Change in private nonfarm payroll employment: 172K (prev: −64K);
- Average hourly earnings (y/y): 3.7% (prev: 3.8%);
- JOLTS job openings: 6.542M (prev: 6.928M).
During the current earnings season, U.S. companies announced the highest number of job cuts for the month of January since 2009: 108,435 layoffs, representing a 118% increase year-on-year. At the same time, hiring plans declined by 13%, falling to a historic January low of 5,306 planned additions. The primary drivers behind the workforce reductions include contract losses, macroeconomic pressures, and corporate restructuring initiatives.
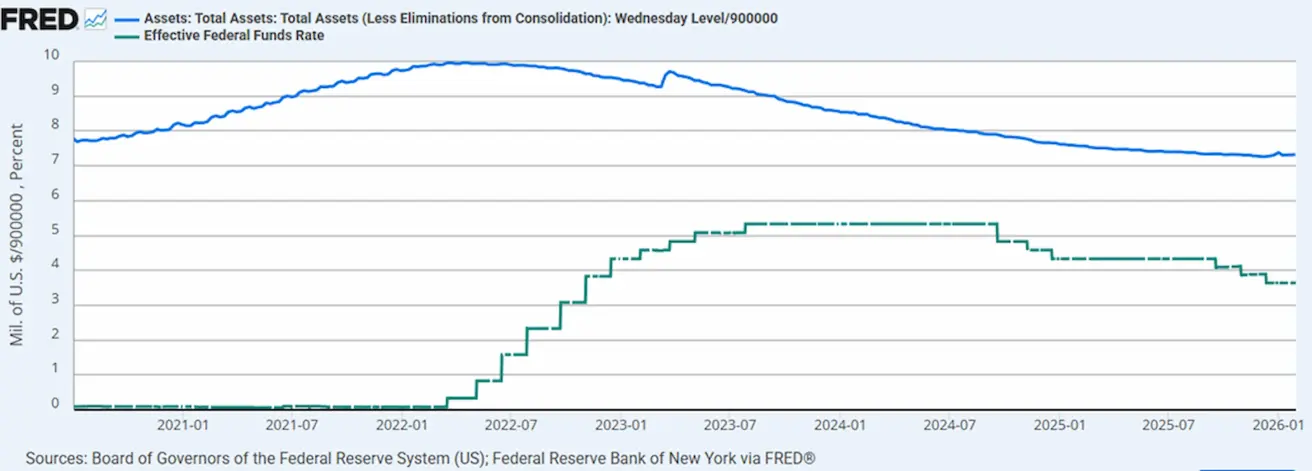
MONETARY POLICY
- Effective Federal Funds Rate (EFFR): 3.50%–3.75%;
- Federal Reserve Balance Sheet: $6.622 trillion, up 1.34% since the suspension of quantitative tightening (QT) ($6.535 trillion).
Next FOMC meeting (March 18): the implied probability of a 25 bps rate cut stands at 23.24%.
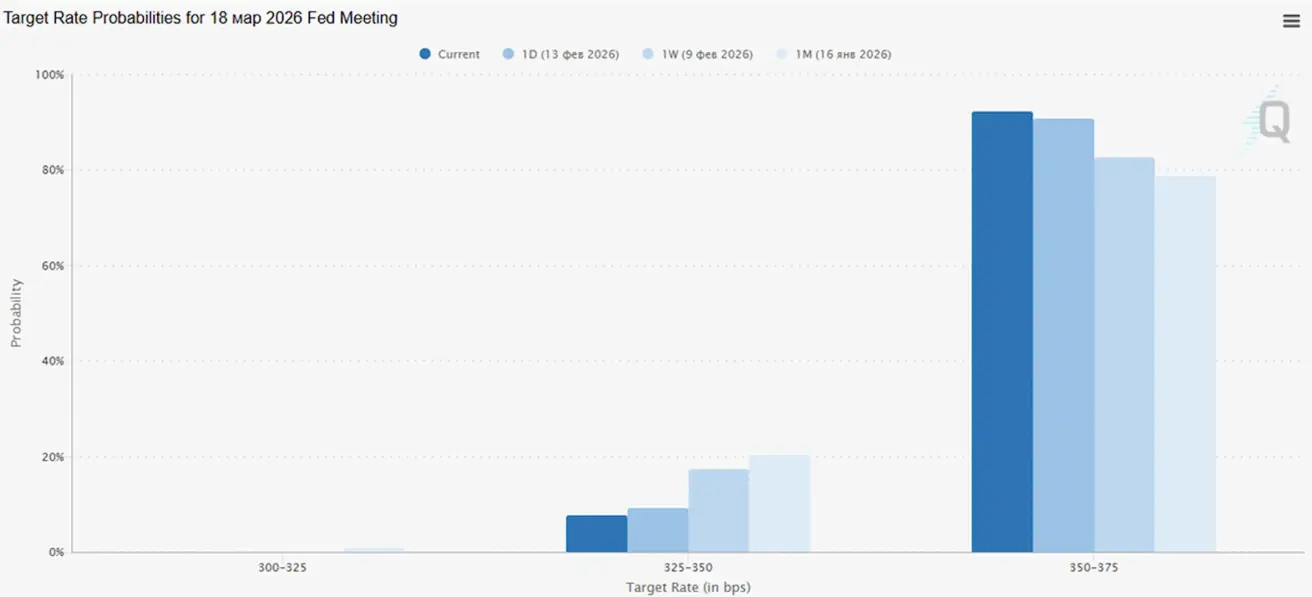
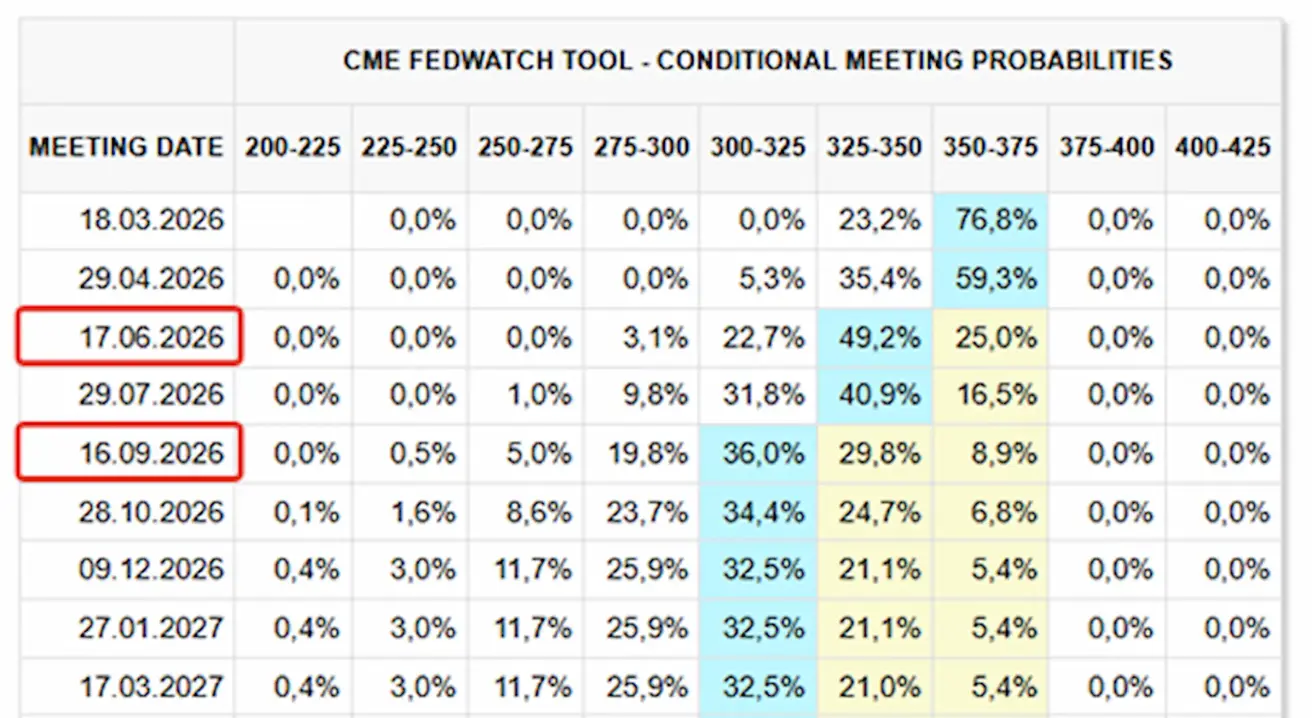
MARKET FORECAST FOR RATE (FEDWATCH)
Over the next 12 months: markets are pricing in two 25-basis-point rate cuts, bringing the target range to 3.00% – 3.25%. The first move is currently expected in June, in approximately three meetings’ time.
Today:
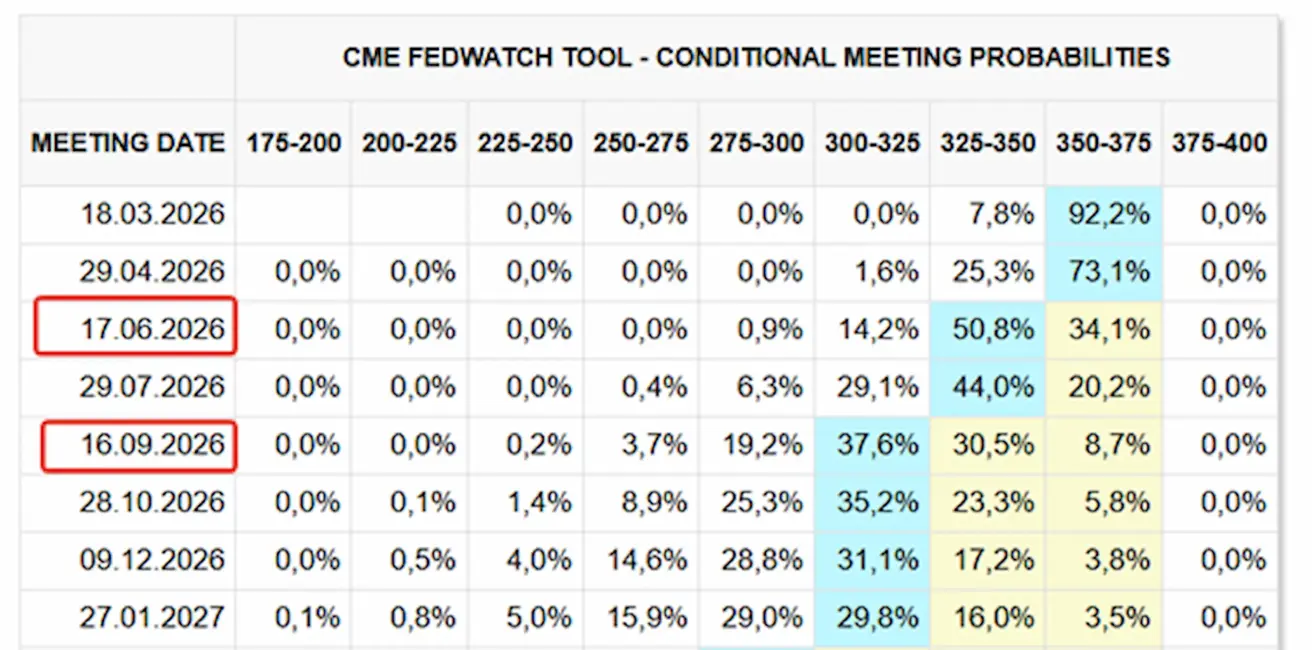
А week earlier:
Market
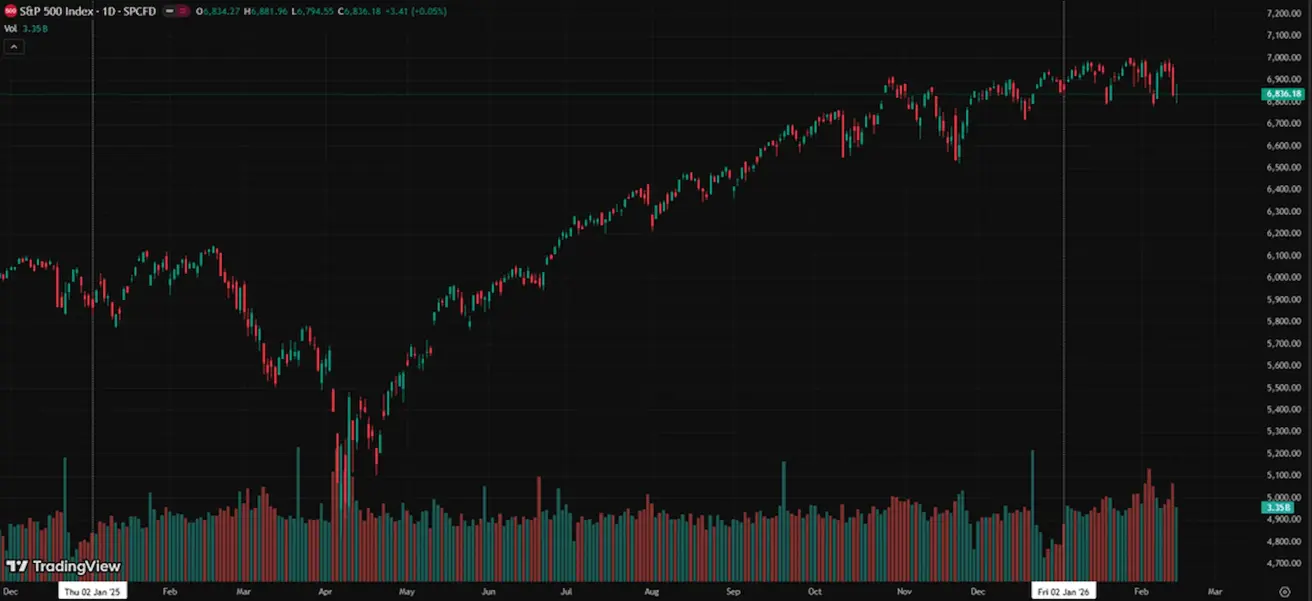
SP500
Weekly performance: -1,39% (week-end close at 6836,18); year-to-date: -0,14%.
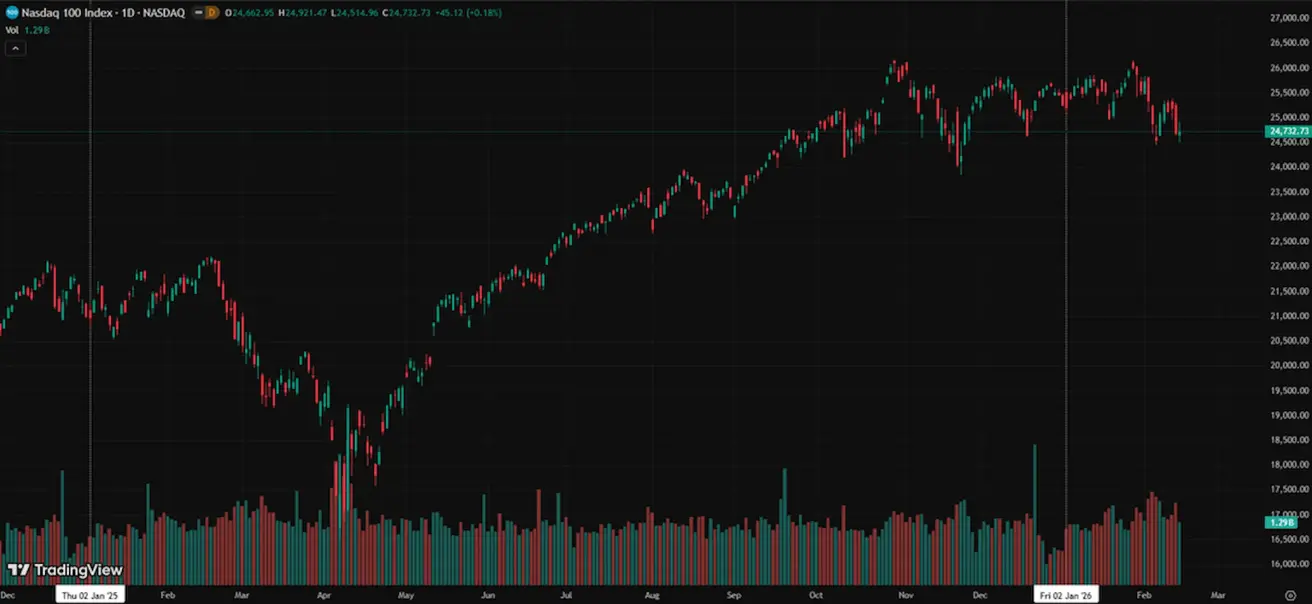
NASDAQ100
Weekly performance: -1,37% (week-end close at 24732,73); year-to-date: -2,05%.
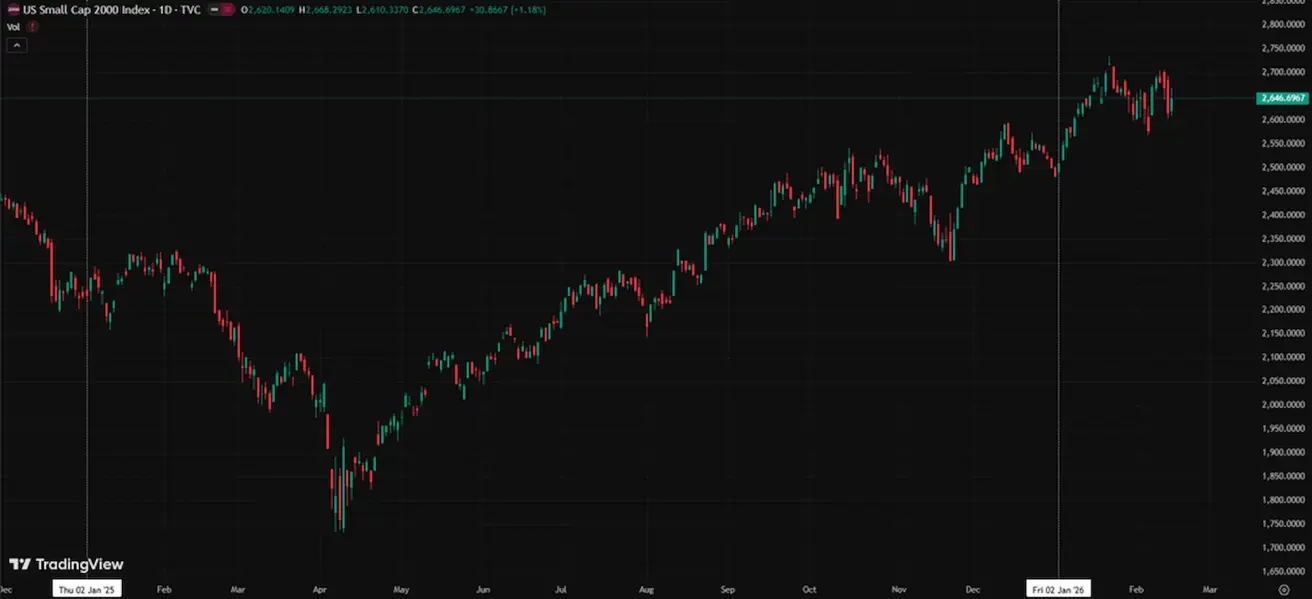
RUSSEL 2000 (RUT)
Weekly performance: -0,89% (week-end close at 2646,696); year-to-date: +6,64%.
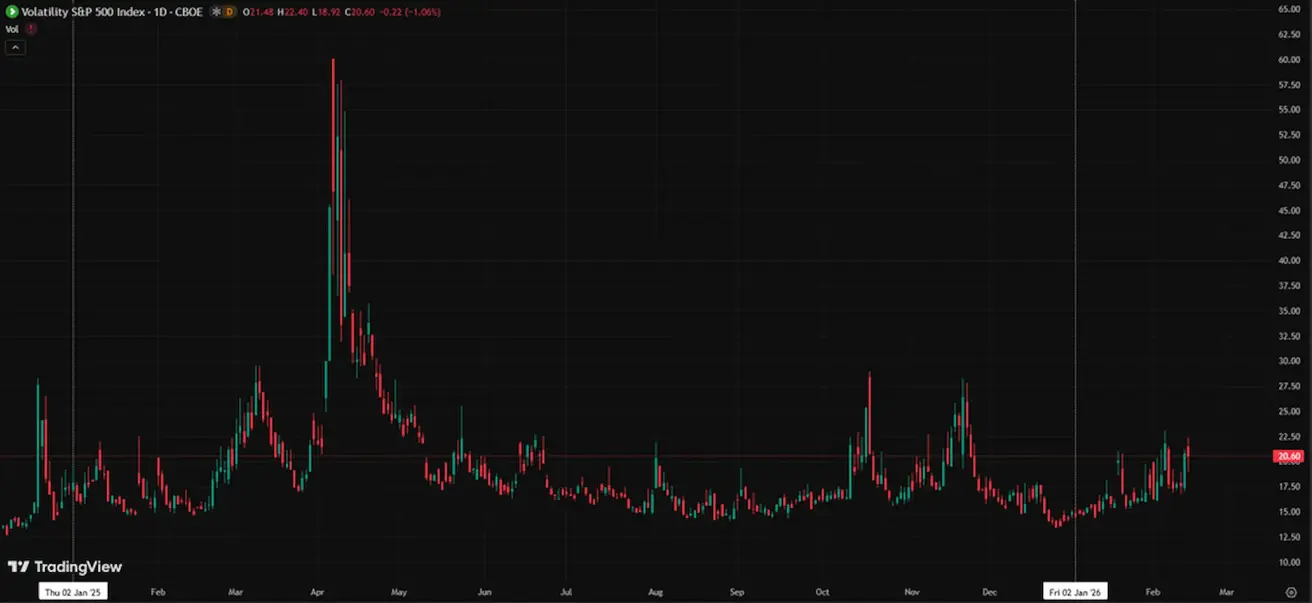
VIX
The VIX volatility index is 20,60.
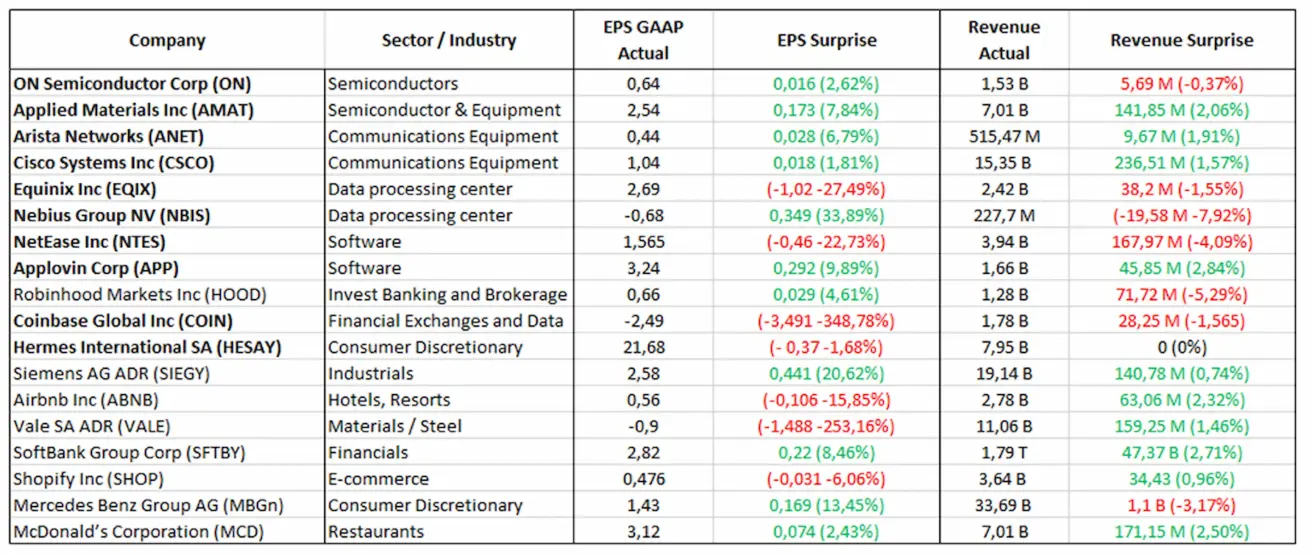
Earnings Reports (Selected Highlights: February 9–13, 2026):
Eurozone
- Policy rates unchanged; inflation remains under control.
- Monetary policy stance broadly neutral, with the balance of risks shifting from inflation toward economic weakness.
- As trade tensions ease, the ECB has revised its GDP and inflation forecasts upward for the coming years.
- Europe is stabilising, although growth continues to lag behind that of the United States.
Interest Rates
- Deposit facility rate: 2.0% (previous: 2.0%).
- Marginal lending facility: 2.4% (previous: 2.4%) — the overnight rate at which banks can borrow from the ECB.
- Main refinancing rate (policy rate): 2.15% (previous: 2.15%).
Inflation
Consumer Price Index (January):
- Core CPI (y/y): 2.2% (previous: 2.3%).
- Headline CPI (m/m): –0.5% (previous: +0.2%, revised).
- Headline CPI (y/y): 1.7% (previous: 2.0%).
ECB Communication
Fourth-quarter GDP (final reading):
-
q/q: 0.3% (previous: 0.3%).
-
y/y: 1.3% (previous: 1.4%).
-
Unemployment rate (December): 6.20% (previous: 6.23%).
Purchasing Managers’ Index (January)
- Services PMI: 51.6 (previous: 52.4).
- Manufacturing PMI: 49.4 (previous: 48.8).
- S&P Global Composite PMI: 51.3 (previous: 51.5).
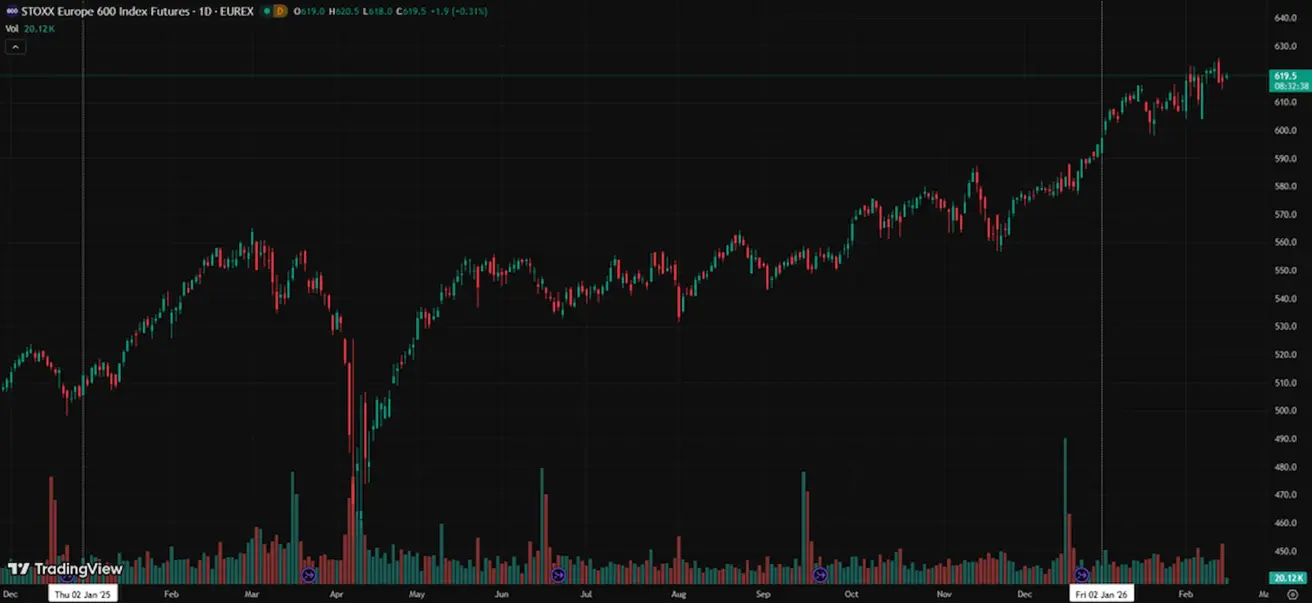
EURO STOXX 600 (FXXP1!)
Weekly performance: +0,11% (Week-end close: 617,6); January performance: +3,97%.
China
The economy is stabilising on the back of resilient export performance, while domestic demand and investment remain subdued. Policy stimulus remains targeted and measured rather than broad-based. Policy rates unchanged. Monetary policy stance remains accommodative.
China has reaffirmed its commitment to fiscal support for economic growth under the 2026 plan, including measures to stimulate domestic demand, optimise tax incentives and subsidies, and advance industrial modernisation.
Interest Rates
- 1Y Loan Prime Rate (medium-term lending benchmark): 3.00%.
- 5Y Loan Prime Rate (five-year benchmark, influencing mortgage pricing): 3.50%.
Inflation (December)
Consumer Price Index (CPI):
- m/m: 0.2% (previous: 0.2%).
- y/y: 0.2% (previous: 0.8%).
Producer Price Index (PPI), y/y: –1.4% (previous: –1.9%).
Economic Indicators
Q4 GDP (final reading):
-
q/q: 1.2% (previous: 1.1%).
-
y/y: 4.5% (previous: 4.8%).
-
Unemployment rate (December): 5.1% (previous: 5.1%).
-
Industrial production (December), y/y: 5.9% (previous: 4.8%).
-
Fixed-asset investment (December), y/y: –3.8% (previous: –2.6%).
-
Retail sales (December), y/y: 0.9% (previous: 1.3%).
-
Imports (December), y/y: 5.7% (previous: 1.9%).
-
Exports (December), y/y: 6.6% (previous: 5.9%).
-
Trade balance (December): USD 114.30 billion (previous: USD 111.68 billion).
-
Purchasing Managers’ Indices (PMI) — November
-
Manufacturing PMI: 49.3 (previous: 49.2).
-
Non-manufacturing PMI: 49.4 (previous: 49.0).
-
Composite PMI: 50.7 (previous: 49.1).
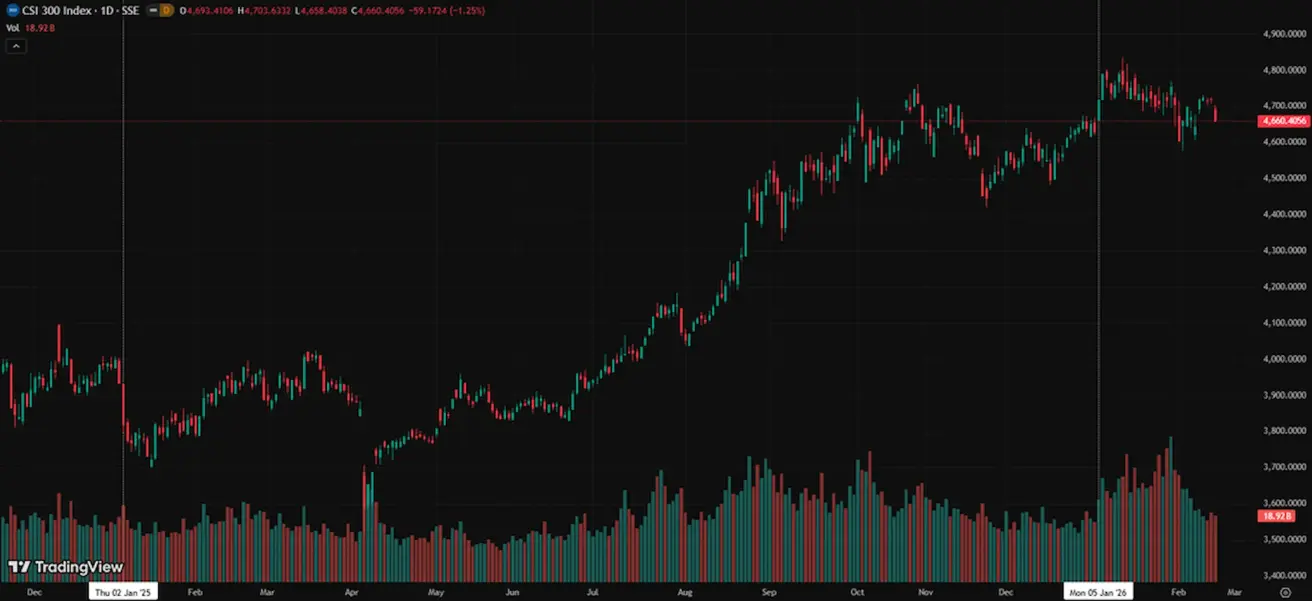
CSI 300 INDEX (000300.HK)
Weekly performance: +0,36% (week-end close at 4660,40); year-to-date: +0,66%.
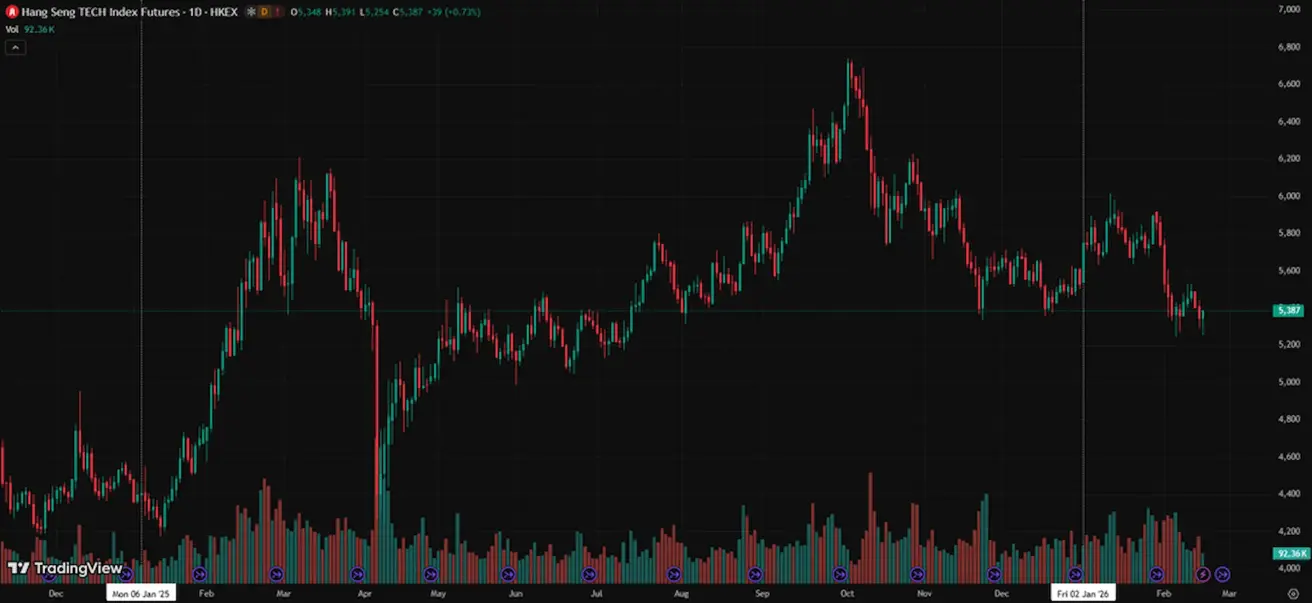
Hang Seng TECH Index (HTI1!)
Weekly performance: -1,85% (week-end close: 5360,42); year-to-date: -2,62%.
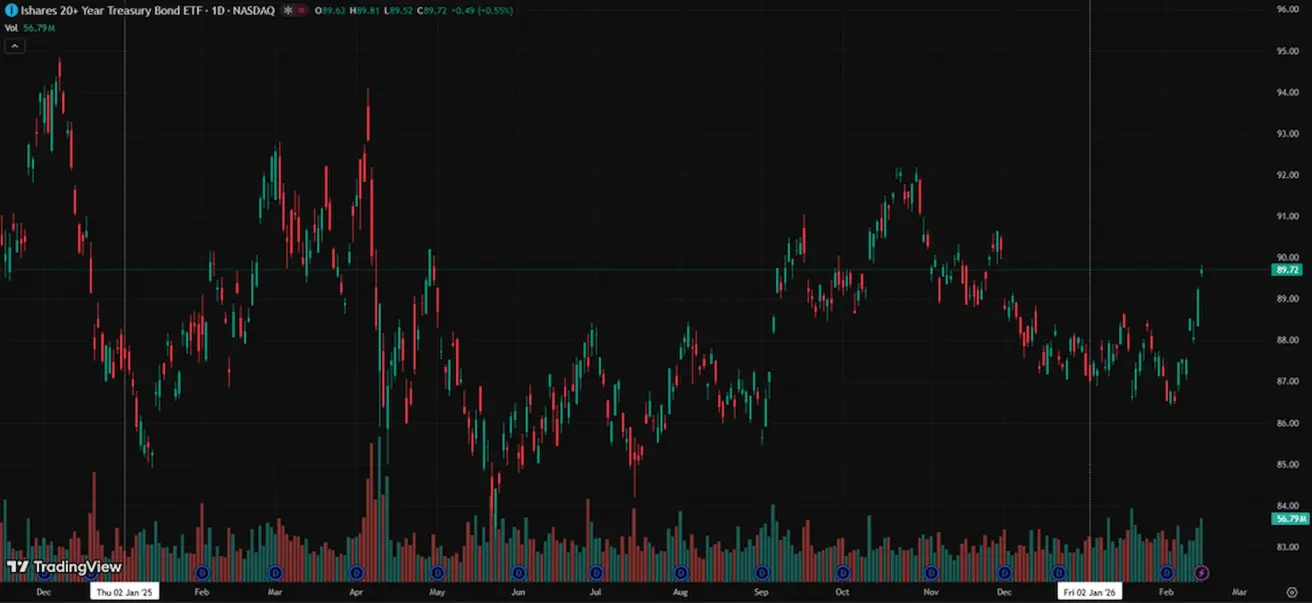
BOND MARKET
The U.S. debt market does not currently signal a scenario of deep recession or systemic risk.
U.S. Treasury 20+ Year Bonds (ETF: TLT):
- Weekly performance: +2.49% (week-end close: 89.72).
- Year-to-date performance: +2.94%.
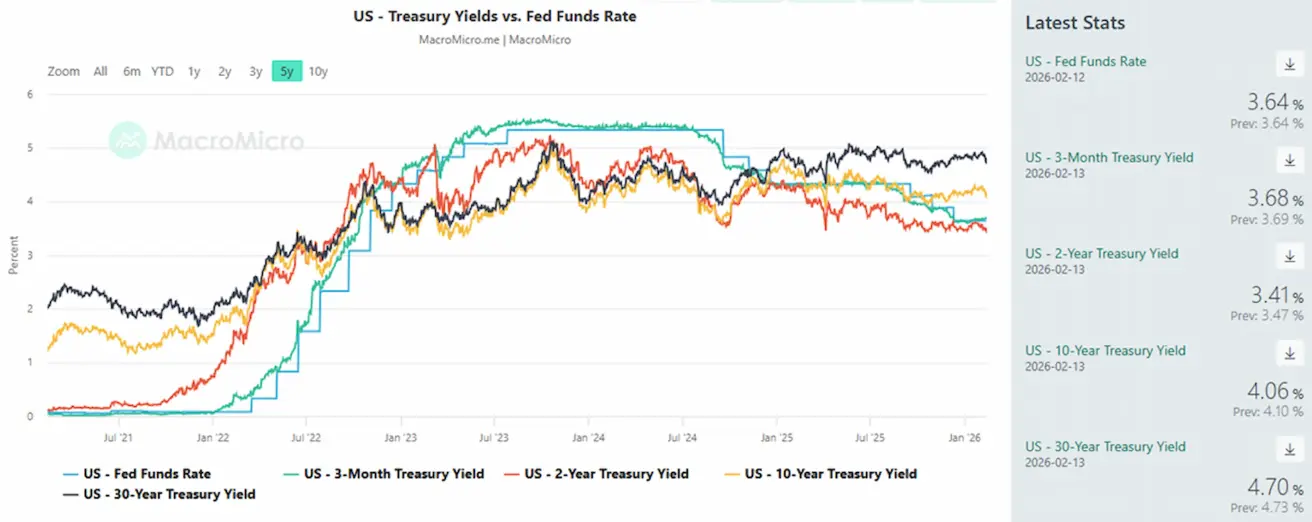
YIELDS AND SPREADS
Market Yield on U.S. Treasury Securities at 10-Year Constant Maturity: 4.21% (previous: 4.21%).
- 2-Year U.S. Treasury Yield: 3.50% (previous: 3.50%).
- ICE BofA BBB U.S. Corporate Index Effective Yield: 4.94% (previous: 5.00%).
- The yield spread between 10-year and 2-year U.S. Treasuries stands at 65 basis points (previous: 71 bps).
- The yield spread between 10-year and 3-month U.S. Treasuries stands at 38 basis points (previous: 53 bps). U.S. 5-Year Credit Default Swap (CDS): 31.02 basis points (unchanged from last week).
GOLD FUTURES (GC)
Weekly performance +1,34% (week-end close: $5046,3 per troy ounce); year-to-date: +16,49%.
Gold prices continue to trend higher, supported by sustained demand from central banks and the rapid expansion of global debt amid persistent geopolitical and macroeconomic uncertainty.
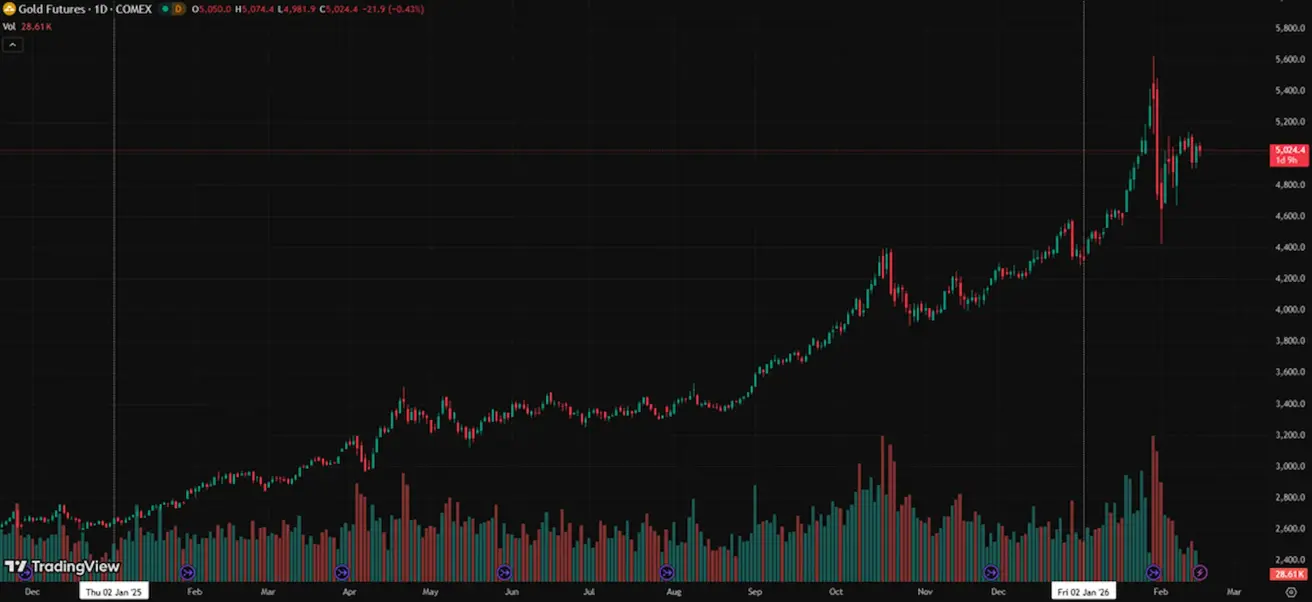
Growth drivers:
- Elevated geopolitical risks and policy uncertainty associated with Trump’s agenda;
- Continued accumulation by central banks and inflows into physically backed gold ETFs;
- Increased participation by large private entities, including Tether, which holds approximately 140 tonnes of gold.
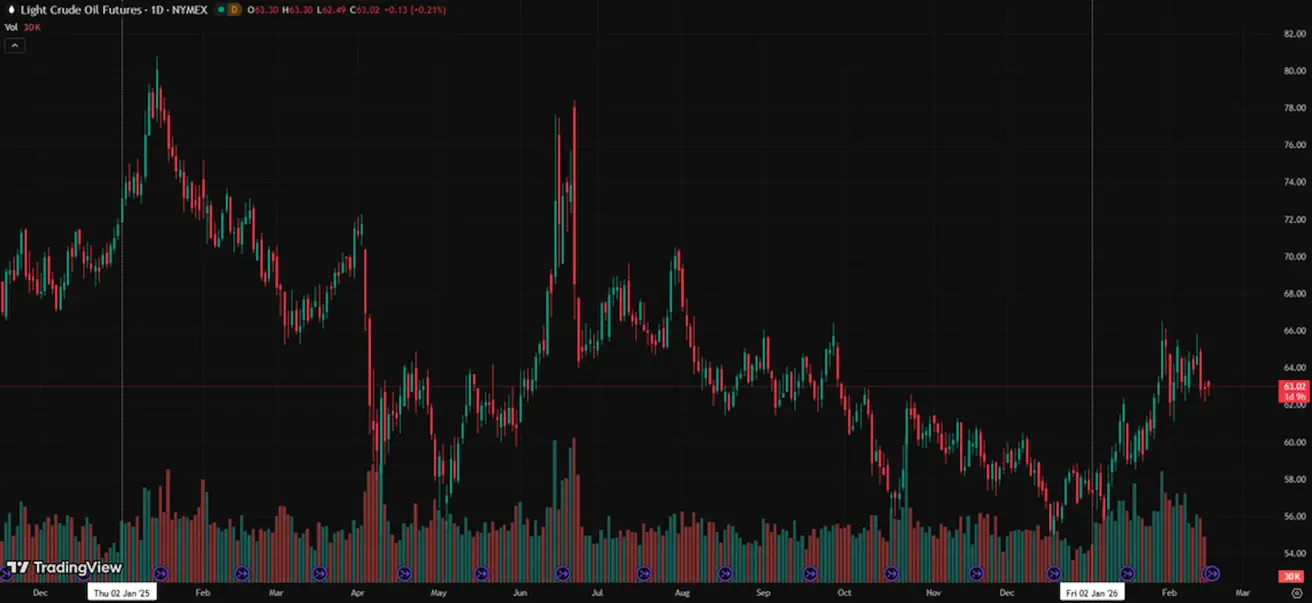
OIL FUTURES
Weekly performance: –1.04% (week-end close: $62.89 per barrel). Year-to-date performance: +9.55%.
Key Drivers:
- Expectations of further supply growth in the oil market remain intact;
- OPEC+ is reportedly considering a pause in additional production increases;
- Geopolitical risks in the Middle East — including protests and rising tensions in Iran — are reinforcing concerns over potential supply disruptions.
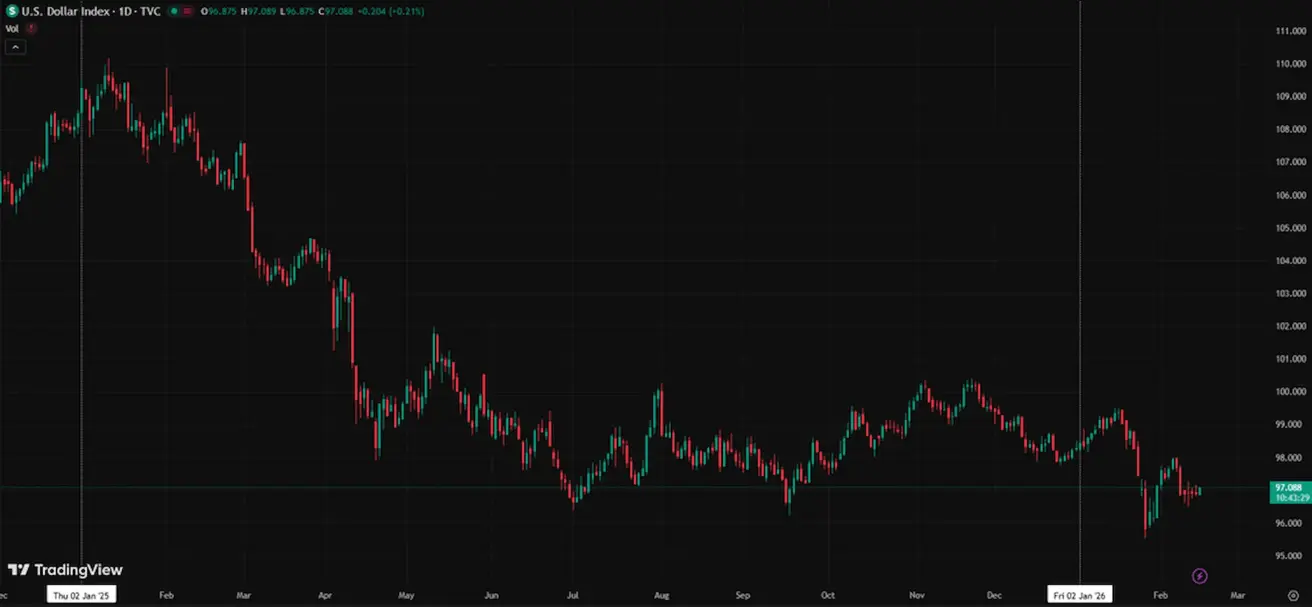
DOLLAR INDEX FUTURES (DX)
Weekly performance: –0.57% (week-end close: 96.82). Year-to-date performance: –1.20%.
Following its decline in late 2025, the U.S. dollar has entered a phase of stabilisation and partial recovery. Expectations of a more neutral Federal Reserve policy stance are limiting further upside, yet they are not creating sustained downward pressure on the USD.
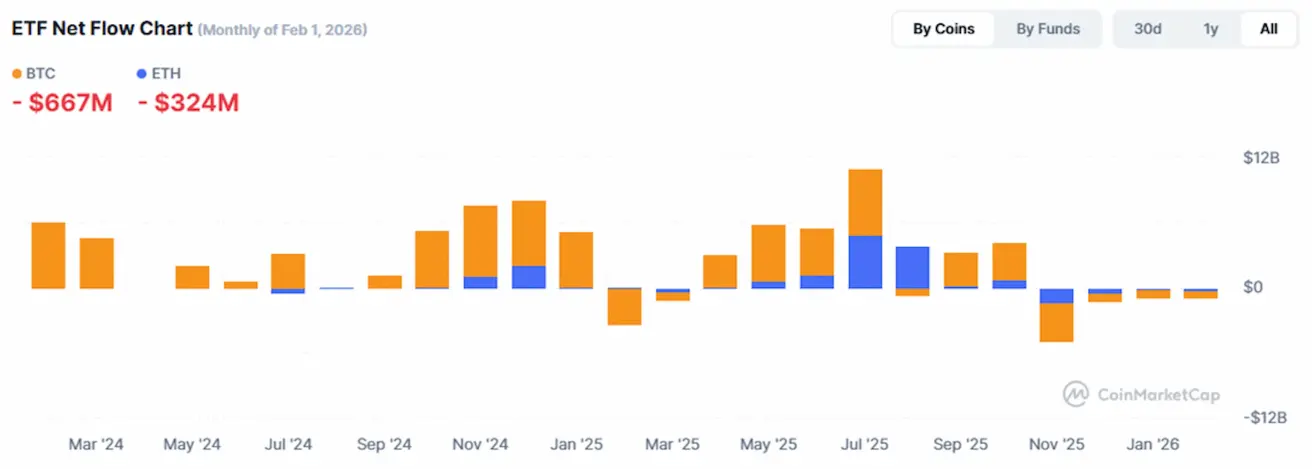
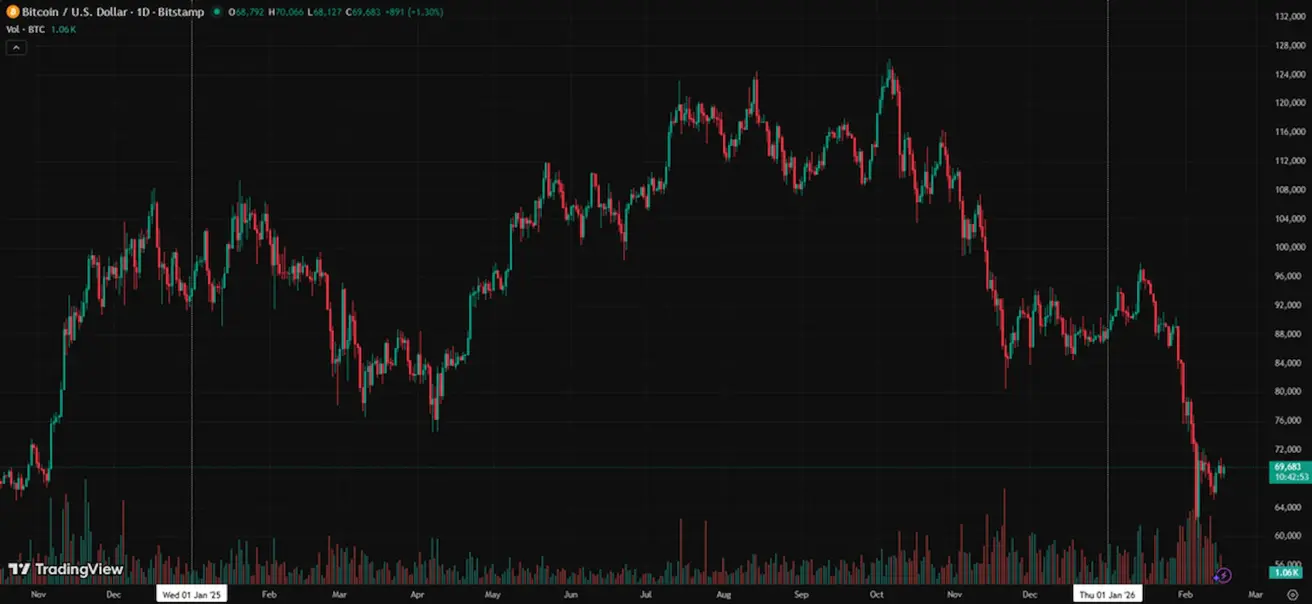
BTC FUTURES
Weekly performance -2,12% (week-end close: $68792); year-to-date: -21,58%.
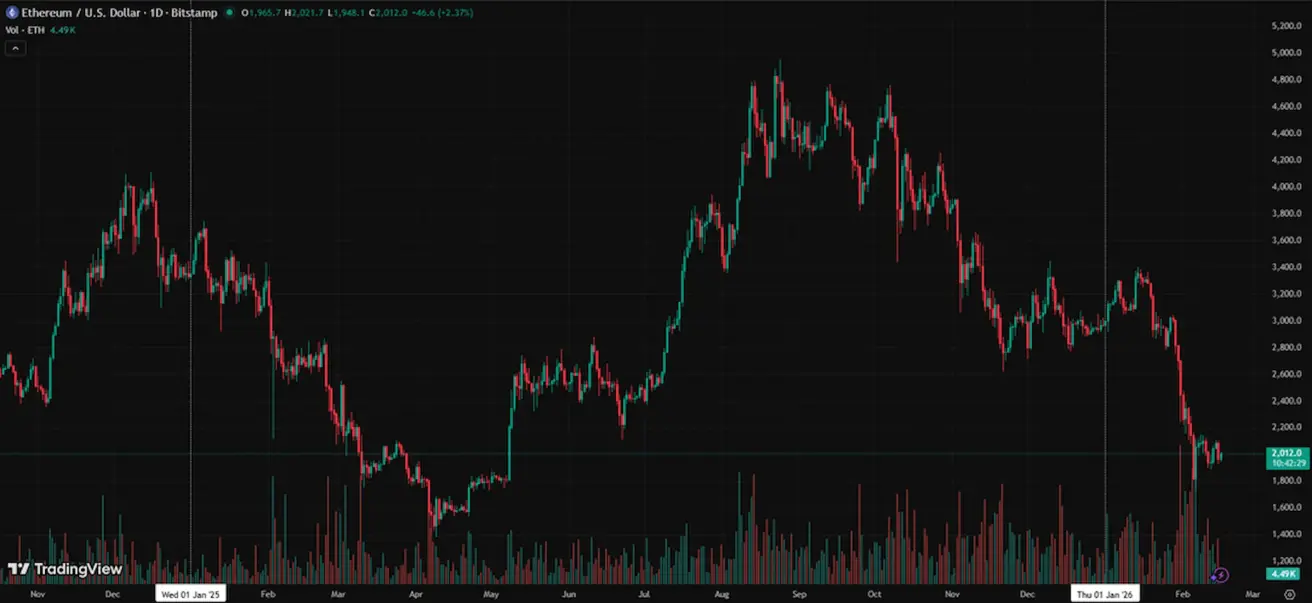
ETH FUTURES
Weekly performance -4,82% (week-end close: $1965,4); year-to-date: -33,91%.
TOTAL CRYPTOCURRENCY MARKET CAPITALIZATION
Total cryptocurrency market capitalization: $2,37 trillion (vs. $2.36 trillion a week earlier) (coinmarketcap.com).
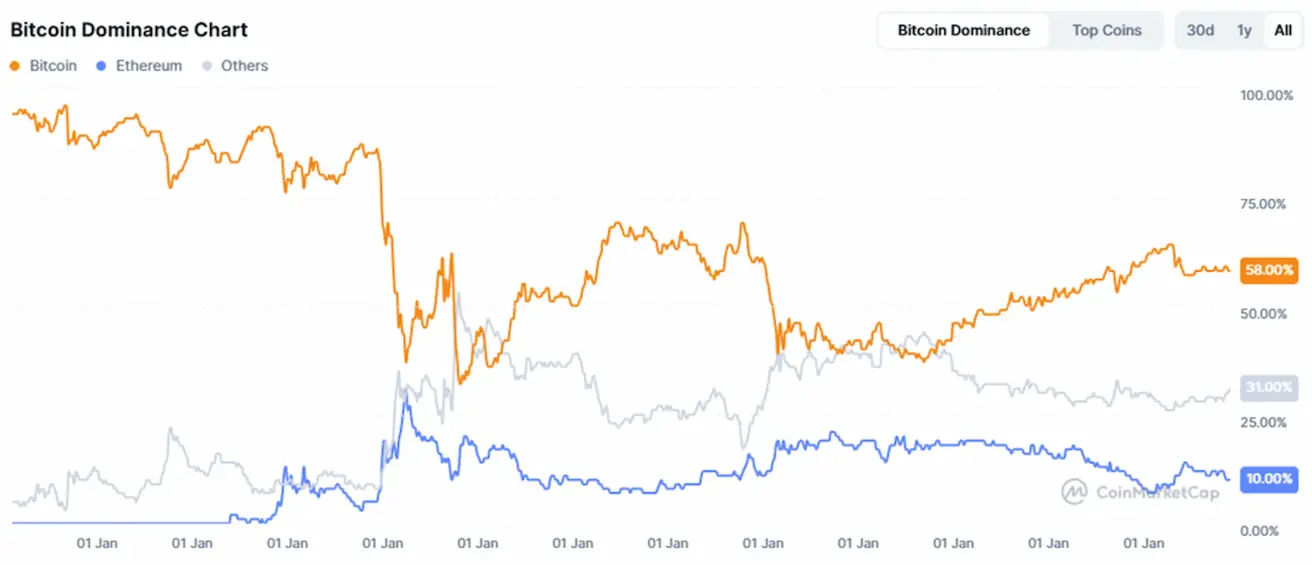
Crypto asset shares
- Bitcoin: 58,5% (58,5%;
- Ethereum:10,4% (10,4%;
- others: 31.1% (31.1%).
ETF Net Flows Chart: