Русский
 Қазақша
 Eesti
EestiJuly 07 – July 12, 2026: Weekly economic update
Key market updates

Key Takeaways:
- The policy rate remains unchanged, while the Fed’s rhetoric remains cautious;
- monetary policy remains moderately restrictive;
- U.S. macroeconomic data continue to support a soft-landing scenario: inflation risks are increasing, the labor market is cooling without signs of recession, and current conditions do not yet warrant a rate cut.
Inflation: Consumer Price Index (May)
- Core CPI: (MoM) 0.2% (previous: 0.4%); (YoY) 2.9% (previous: 2.8%);
- CPI: (MoM) 0.5% (previous: 0.6%); (YoY) 4.2% (previous: 3.8%).
Producer Price Index (May)
- PPI (MoM): 1.1% (previous: 1.4%);
- Core PPI (MoM): 0.4% (previous: 1.0%).
Inflation Expectations (Michigan) (June)
- 12-month Inflation Expectations: 4.6% (previous: 4.8%);
- 5-Year Inflation Expectations: 3.3% (previous: 3.9%).
GDP (U.S. Bureau of Economic Analysis, BEA): Q1 2025 annualized growth rate, third estimate: +2.1% (Q4 2025: +0.5%); forecast: +1.6%; second estimate: 2.0%.
GDPNow (the Atlanta Fed’s real-time estimate of official GDP growth ahead of release): 1.4% (previous: 1.2%).
Labor Market (BLS) (May/June)
- Unemployment Rate: 4.2% (previous: 4.3%);
- Continued Jobless Claims: 1.814K (previous: 1.806K);
- Initial Jobless Claims: 215K (previous: 215K);
- Nonfarm Payrolls (NFP): 57K (previous: 129K);
- Private Nonfarm Payrolls: 49K (previous: 97K);
- Average Hourly Earnings (YoY): 3.5% (previous: 3.4%);
- JOLTS Job Openings: 6.866 million (previous: 6.922 million).
Business Activity Index (PMI) (May)
Above 50 indicates expansion; below 50 indicates contraction.
- Services PMI: 51.2 (previous: 51.3);
- Manufacturing PMI: 53.9 (previous: 55.1);
- Composite PMI: 51.9 (previous: 51.5).
Monetary Policy
Effective Federal Funds Rate (EFFR): 3.50%–3.75%.
Federal Reserve Balance Sheet: $6.735 trillion, +3.06% since the suspension of quantitative tightening (QT), when the balance sheet stood at $6.535 trillion.
Fedwatch
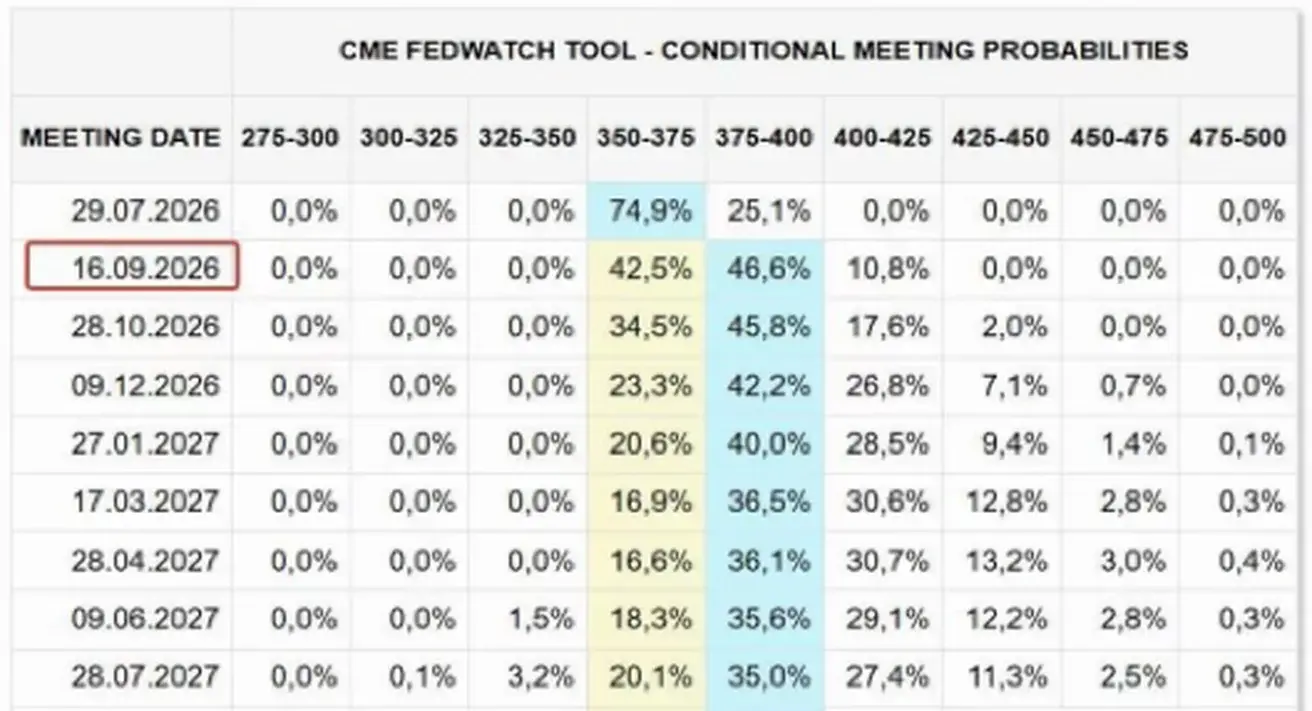
For the next FOMC meeting (July 29), the implied market probability of a rate hike has increased to 34.21% (week ago: 25.1%):
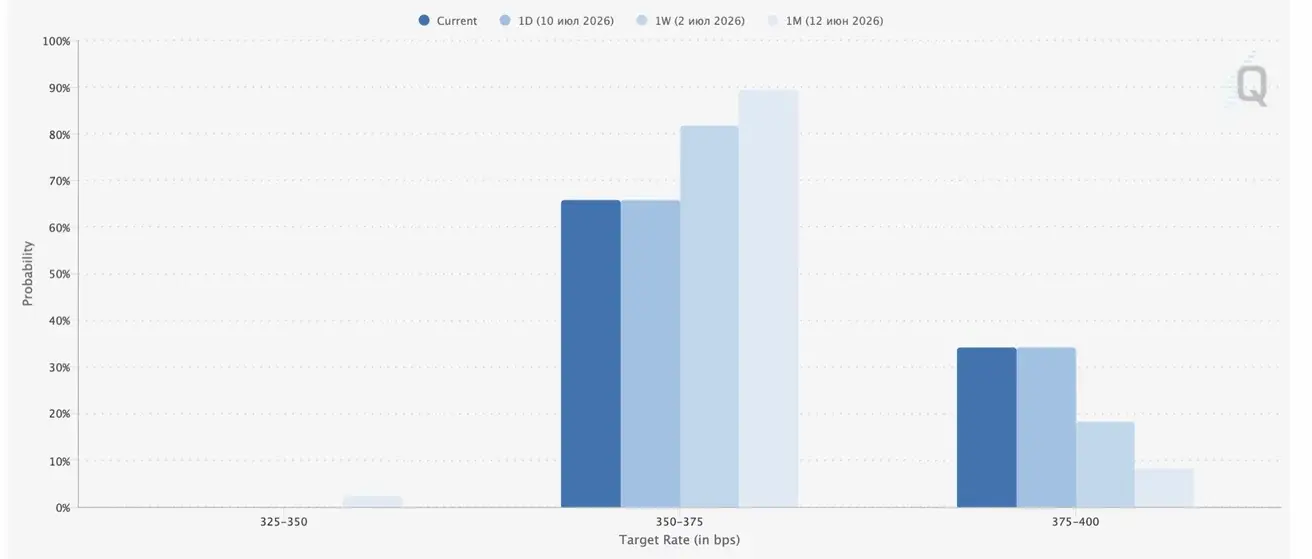
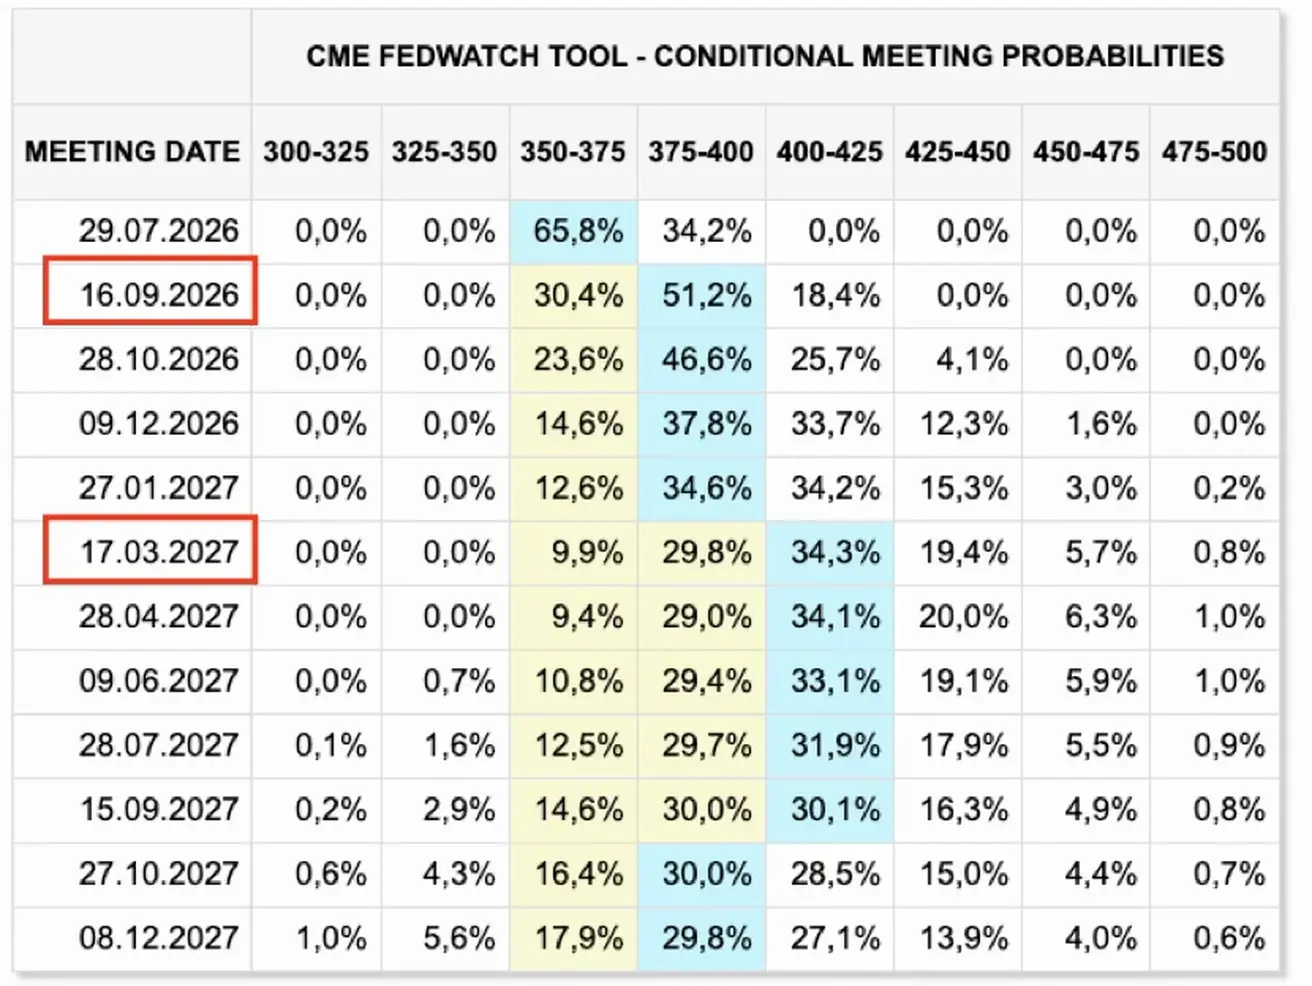
Over the next 12 months, the market is pricing in one 25-basis-point rate hike in September this year, bringing the federal funds rate to a target range of 4.00–4.25%.
Today:
A week earlier:
Federal Reserve Monetary Policy Report
Key takeaways from the U.S. Federal Reserve’s Monetary Policy Report of July 10, 2026:
- The policy rate has been held in the 3.50–3.75% range since the start of the year, yet the rhetoric remains focused on fighting inflation: the FOMC explicitly underscores its commitment to restoring price stability;
- inflation has once again become a key concern. Over the 12 months to May, the headline PCE index rose 4.1%, while core PCE increased 3.4% — well above the Fed’s 2% target. The price increases stem from several factors: an energy shock driven by the conflict in the Middle East, legacy tariffs, and elevated demand for the high-tech goods required for AI infrastructure;
- the labor market, according to the Fed’s assessment, remains resilient and close to balance. Unemployment stood at 4.2% in June, layoffs remain low, job openings have broadly stabilized, and private-sector employment growth has picked up following a weak second half of last year. This weakens the case for near-term policy easing;
- the U.S. economy continues to grow at a moderate pace, with real GDP expanding at an annualized rate of 2.1% in the first quarter. However, financial conditions have tightened: Treasury yields have risen, particularly at the short end, and expectations for the Fed’s rate path have shifted higher. That said, credit remains broadly available, and the financial system is assessed as resilient. Equity markets, meanwhile, continued to advance, even as asset valuations remain above historical norms;
- a separate key point in the report is that AI-related investment has become one of the main drivers of economic resilience. The Fed notes strong growth in high-tech capital investment, with manufacturing supported by demand for data centers, computers, electronics, metals, and equipment. At the same time, the AI boom is a double-edged factor: it is bolstering growth while also adding to inflationary pressure through demand for components, semiconductors, and industrial metals.
For equity markets, the Fed’s report is, on balance, slightly negative to neutral. A more important point to highlight, however, is that the report does not signal stress.
To summarize the main signal: the U.S. economy remains reasonably resilient and the labor market stable, but inflation is once again above a comfortable level. This reduces the likelihood of near-term rate cuts and supports a longer period of tight financial conditions. The key risk for equities is pressure on multiples, particularly in growth segments, where valuations are already historically elevated and highly sensitive to expectations of future cash flows.
Source: Federal Reserve — Monetary Policy Report, July 10, 2026
Market
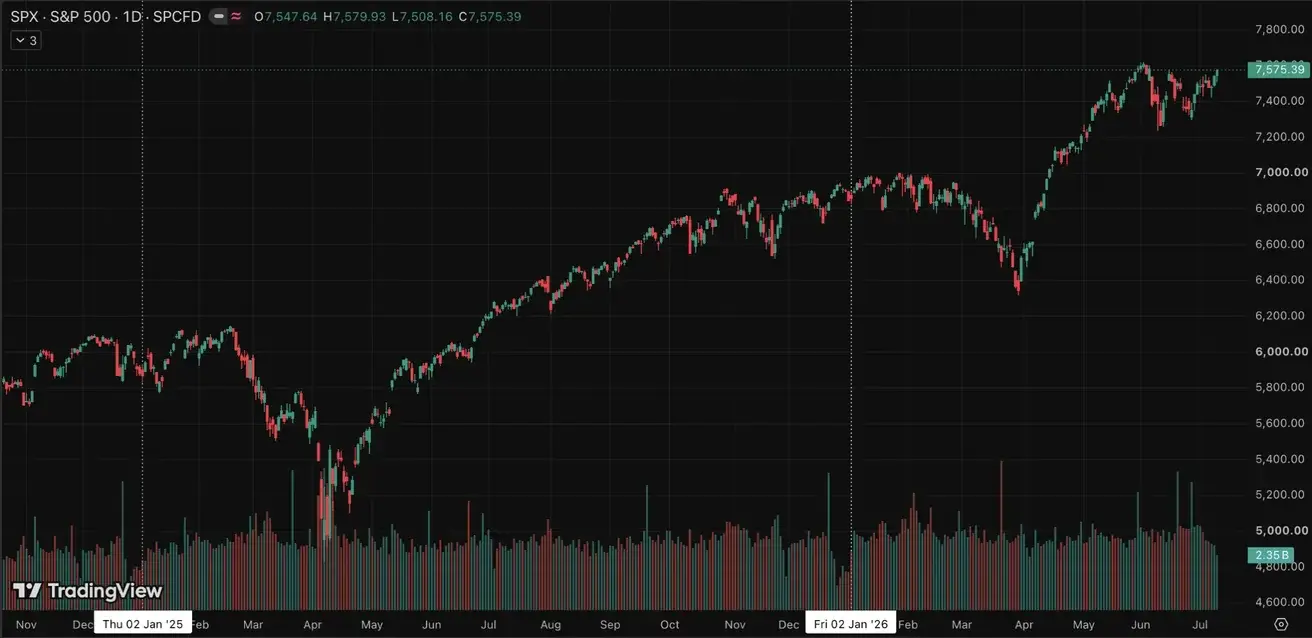
S&P 500
Weekly performance: +1.23% (week-end close: 7,575.39); year-to-date: +10.66%.
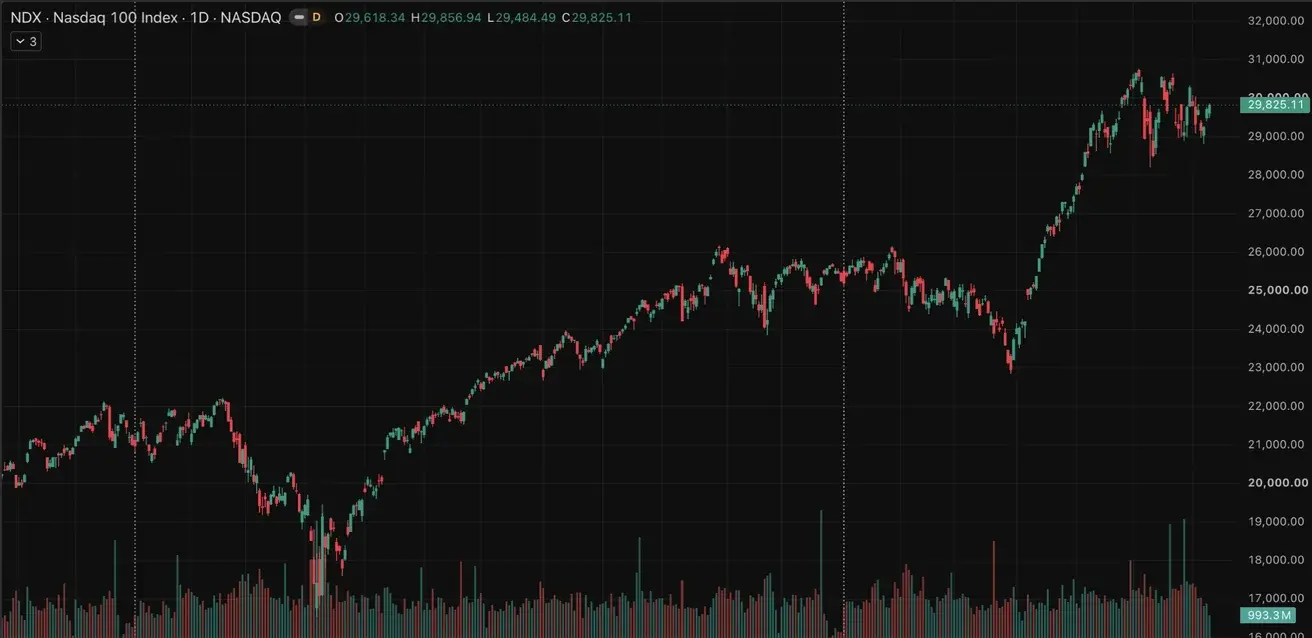
Nasdaq100
Weekly performance: +1.69% (week-end close: 29,825.11); year-to-date: +18.12%.
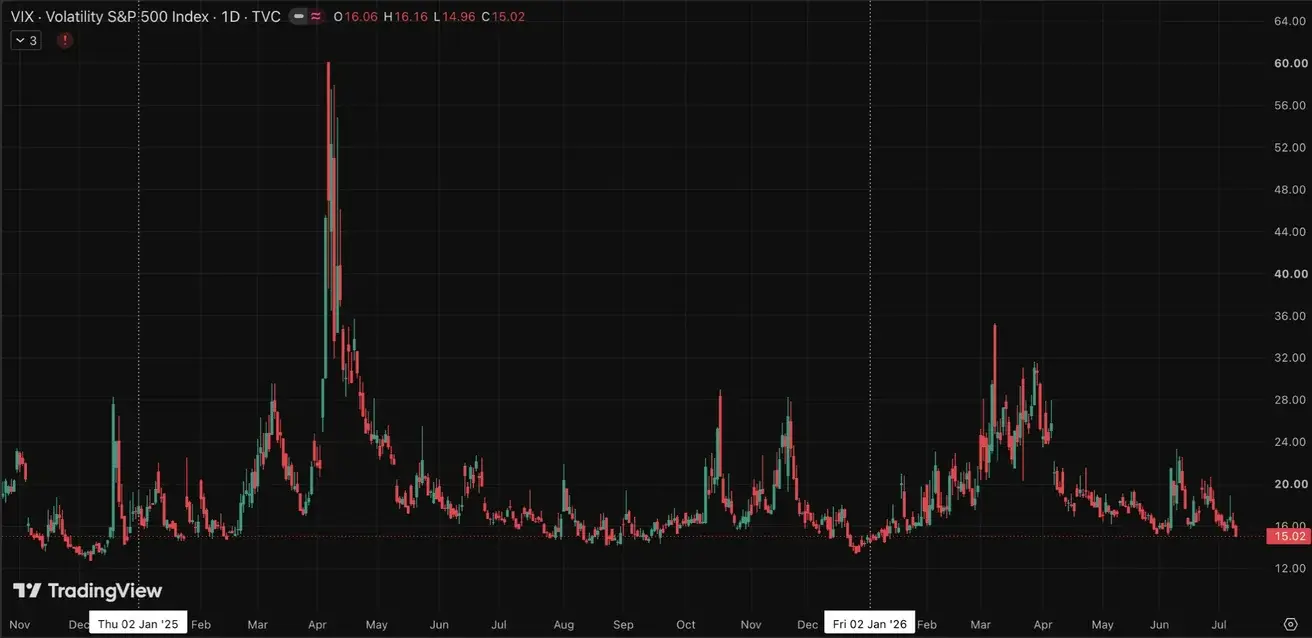
VIX
VIX (volatility index): week-end close at 15.02 points.
Eurozone
Key Takeaways:
- the ECB raised interest rates, while maintaining a hawkish stance as inflationary risks continue to increase;
- against the backdrop of the conflict in the Middle East, the ECB revised its GDP forecasts downward and raised its inflation projections for the coming years.
Interest Rates
- Deposit Facility Rate: 2.25% (previous: 2.0%);
- Marginal Lending Facility Rate: 2.65% (previous: 2.4%) — the rate at which banks can obtain overnight funding from the central bank;
- Main Refinancing Rate (Policy Rate): 2.40% (previous: 2.15%).
Inflation: Consumer Price Index (CPI) (June, Preliminary Estimate)
- Core CPI (YoY): 2.4% (previous: 2.6%);
- Headline CPI: -0.1% (MoM) (previous: 0.1%); 2.8% (YoY) (previous: 3.2%).
GDP (Q1 Preliminary Estimate)
- QoQ: -0.2% (previous: 0.1%);
- YoY: 0.3% (previous: 1.2%).
Unemployment Rate (June)
6.2% (previous: 6.3%).
Industrial Production (June)
- MoM: 0.1% (previous: 0.9%);
- YoY: 1.67% (previous: 1.37%).
Purchasing Managers’ Index (PMI) (May)
- Services PMI: 49.4 (previous: 47.7);
- Manufacturing PMI: 51.4 (previous: 51.6);
- S&P Global Composite PMI: 50.0 (previous: 48.5).
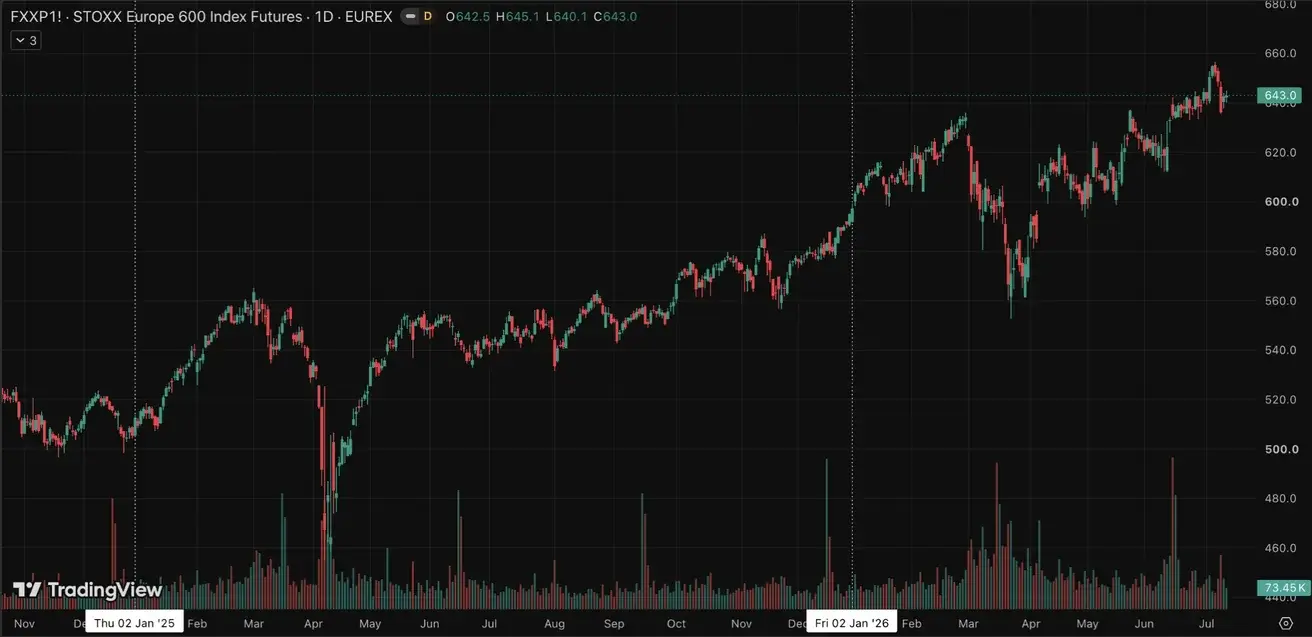
Euro Stoxx 600 (FXXP1!)
Weekly performance: -1.08% (week-end close: 643); year-to-date: +8.25%.
China
China’s economy continues to stabilize, supported by strong export performance, while domestic demand and investment are gradually recovering. Policymakers remain measured and targeted in their approach to economic stimulus.
- Interest rates remain unchanged;
- monetary policy remains accommodative;
- China reaffirmed its commitment to fiscal support for economic growth under its 2026 plan, including measures to stimulate domestic demand, optimize tax incentives and subsidies, and modernize industrial capacity.
Interest Rates
- 1-Year Loan Prime Rate (medium-term lending): 3.00%;
- 5-Year Loan Prime Rate (benchmark for mortgage lending): 3.50%.
Inflation Indicators (May)
- Consumer Price Index (CPI): -0.3% MoM (previous: -0.1%); 1.0% YoY (previous: 1.2%);
- Producer Price Index (PPI): 4.1% YoY (previous: 3.9%).
Trade Data (May)
- Imports: 27.4% YoY (previous: 25.3%);
- Exports: 19.4% YoY (previous: 14.1%);
- Trade Balance (USD): $105.43 billion (previous: $84.80 billion).
GDP (Q1 2026)
- QoQ: 1.3% (previous: 1.2%);
- YoY: 5.0% (previous: 4.5%).
Labor Market
Unemployment Rate (May): 5.1% (previous: 5.2%).
Industrial Activity
Industrial Production (May, YoY): 4.5% (previous: 4.1%).
Fixed Asset Investment
May, YoY: -4.1% (previous: -1.6%).
Retail Sales
May, YoY: 0.9% (previous: 1.3%).
Purchasing Managers’ Indices (PMI) (May)
- Manufacturing PMI: 50.3 (previous: 50.0);
- Non-Manufacturing PMI: 50.2 (previous: 50.1);
- Composite PMI: 50.6 (previous: 50.5).
CSI 300 Index (000300.HK)
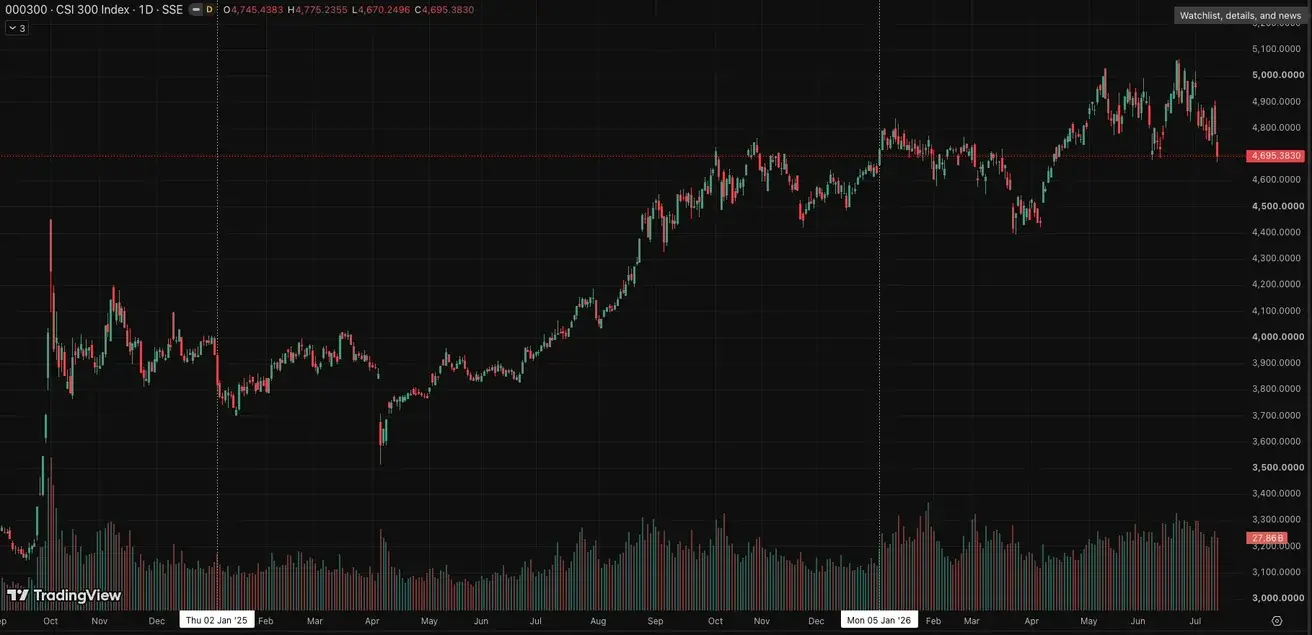
Weekly performance: -1.26% (week-end close: 4,780.78); year-to-date: +2.56%.
U.S. Bond Market
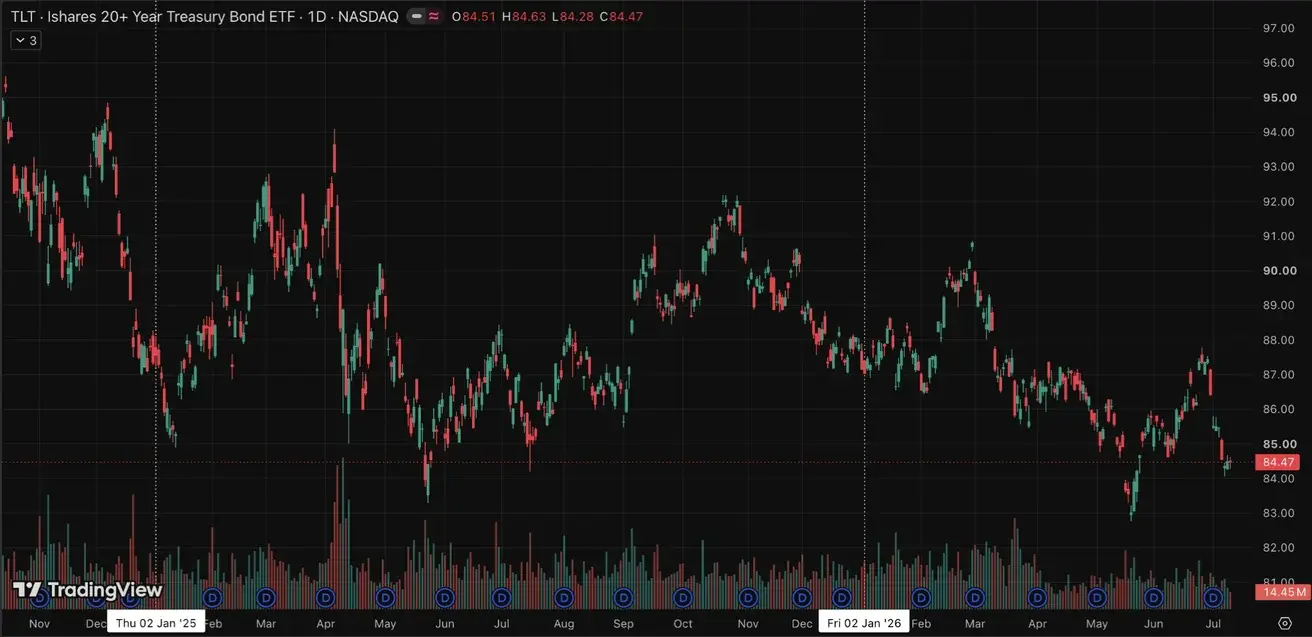
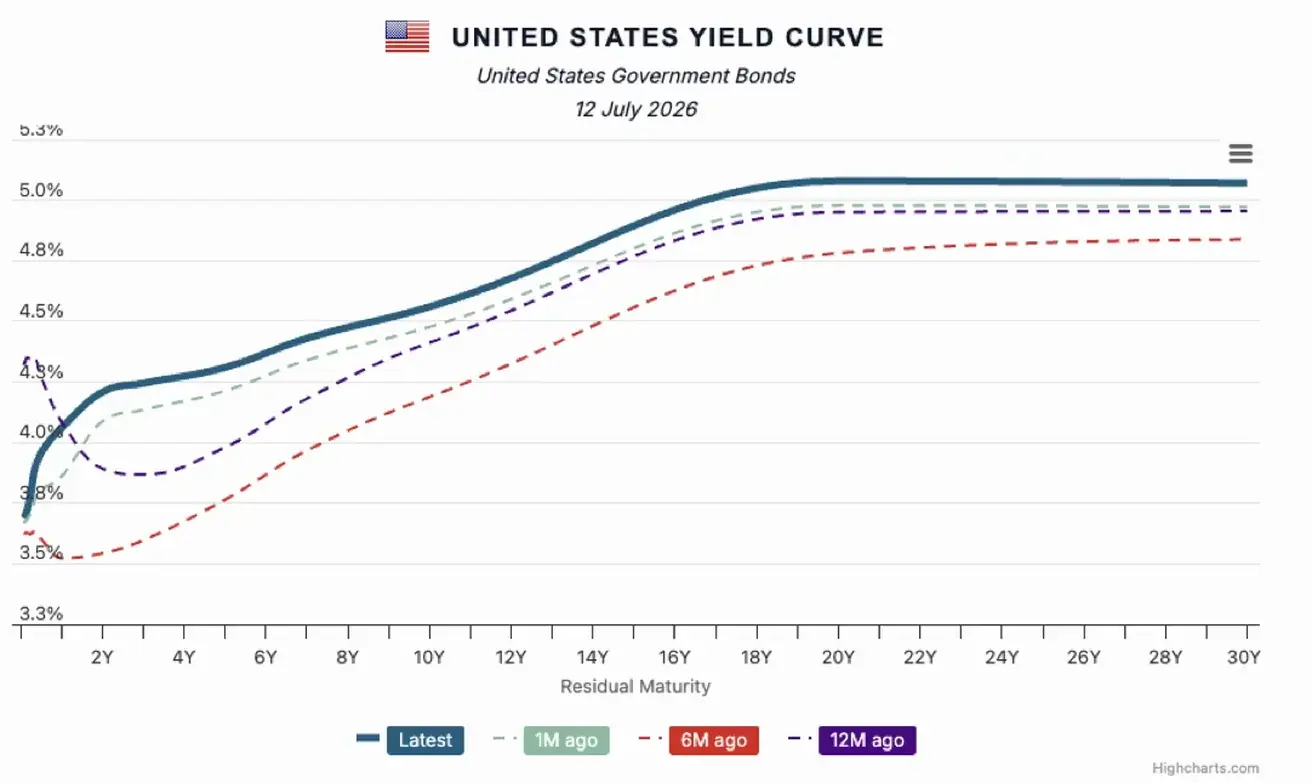
Treasury markets saw yields advance throughout the curve, with the most pronounced shifts occurring in 2-year maturities. This movement reflects a recent adjustment in market pricing to account for heightened expectations regarding inflationary pressure.
U.S. Treasury Bonds 20+ Years (TLT ETF): -3.29% for the week (weekly close: 84.47); -3.09% year-to-date.
Yields and Spreads
- Market Yield on U.S. Treasury Securities at 10-Year Constant Maturity: 4.56% (previous: 4.47%);
- 2-Year U.S. Treasury Yield: 4.21% (previous: 4.12%);
- ICE BofA BBB US Corporate Index Effective Yield: 5.45% (previous: 5.38%).
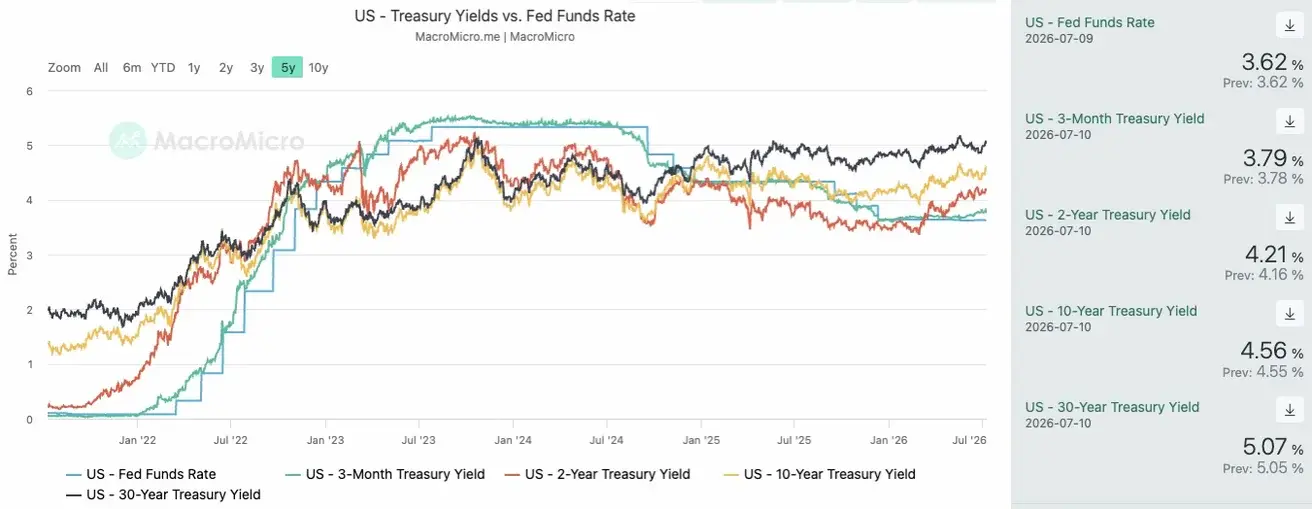
- The yield spread between 10-year and 2-year U.S. Treasury securities stands at 35 basis points (previous: 27 bps);
- the yield spread between 10-year and 3-month U.S. Treasury securities stands at 77 basis points (previous: 61 bps).
U.S. Treasury Yield Curve
The cost of a 5-year U.S. Credit Default Swap (CDS) — a market-based measure of sovereign default insurance — rose to 38.20 basis points, compared with 38.22 basis points a week earlier.
Commodities
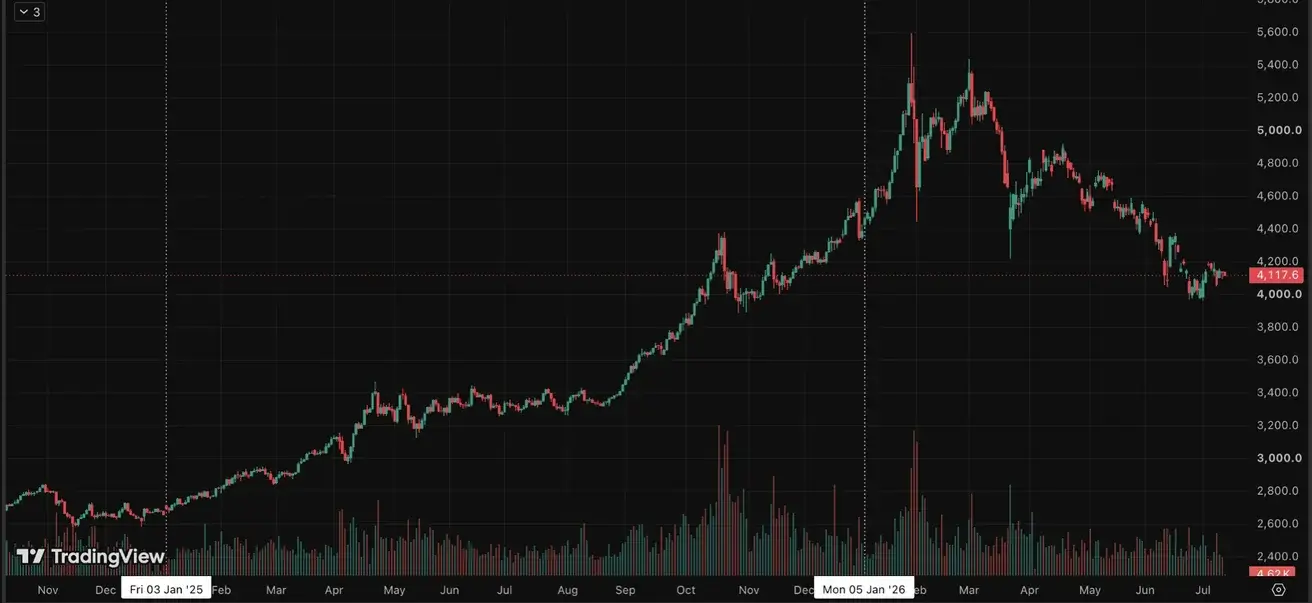
Gold Futures (GC)
Weekly performance: +1.54% (week close: $4,117.60 per troy oz); year-to-date: -4.95%.
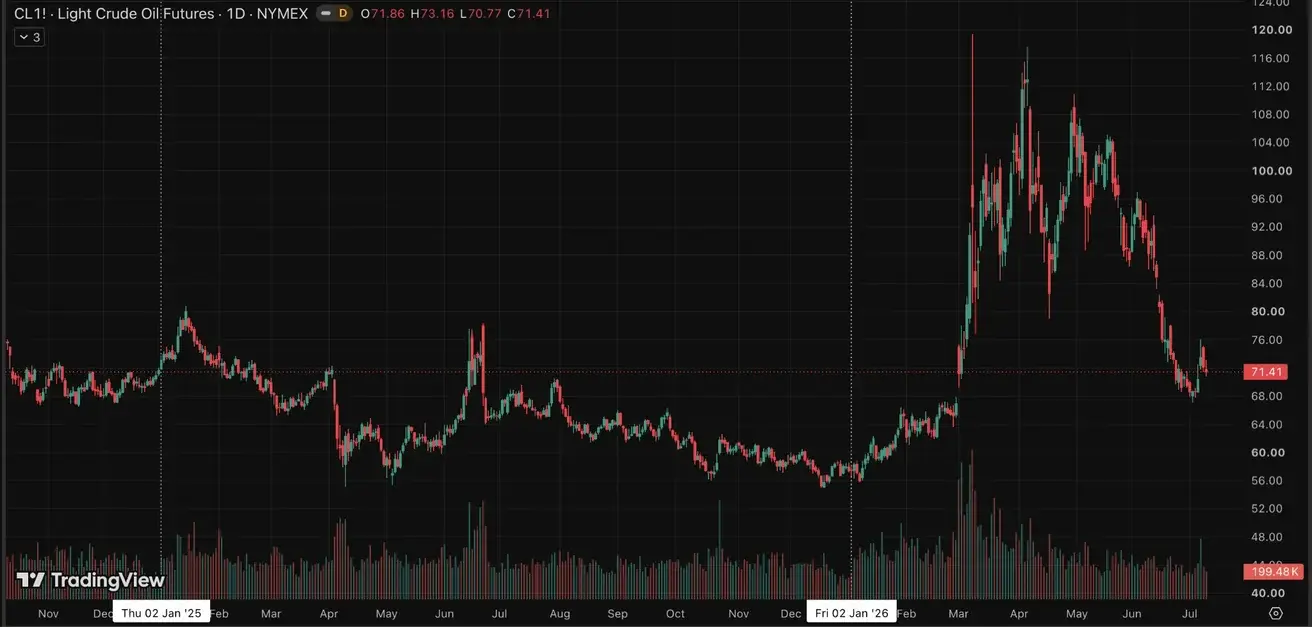
Oil Futures
Weekly performance: +3.96% (week close: $71.41 per barrel); year-to-date: +24.49%.
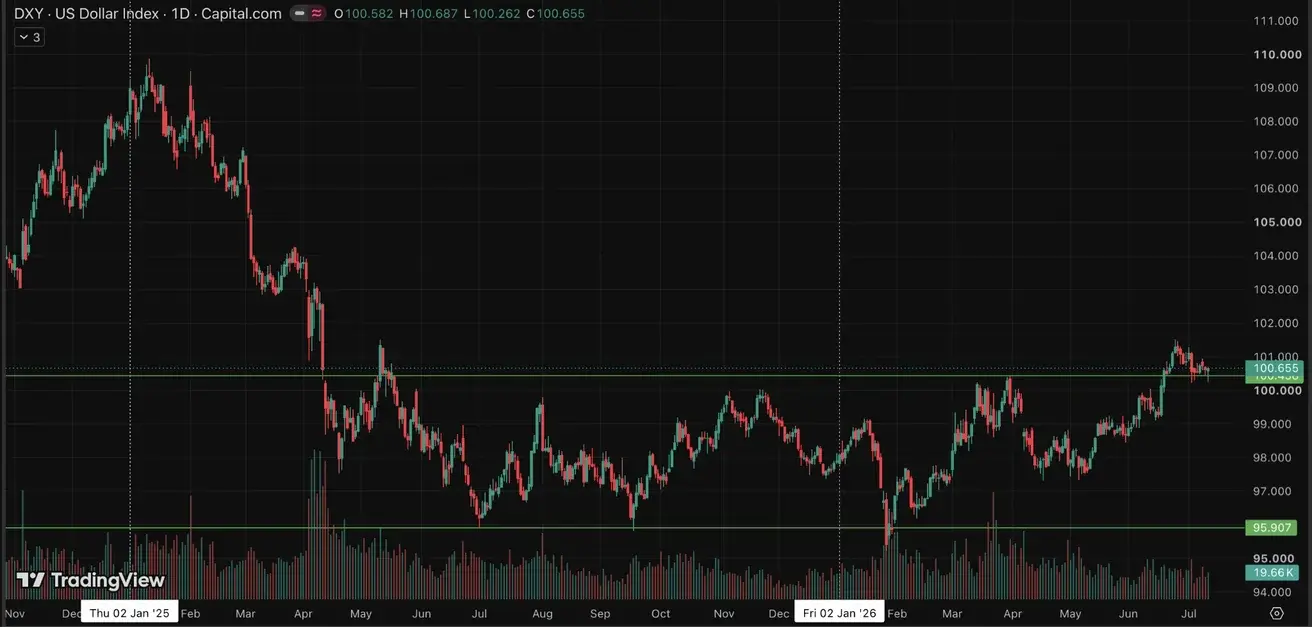
Dollar Index Futures (DX)
Weekly performance: +0.03% (week close: 100.572); year-to-date: +2.63%.
Cryptocurrencies
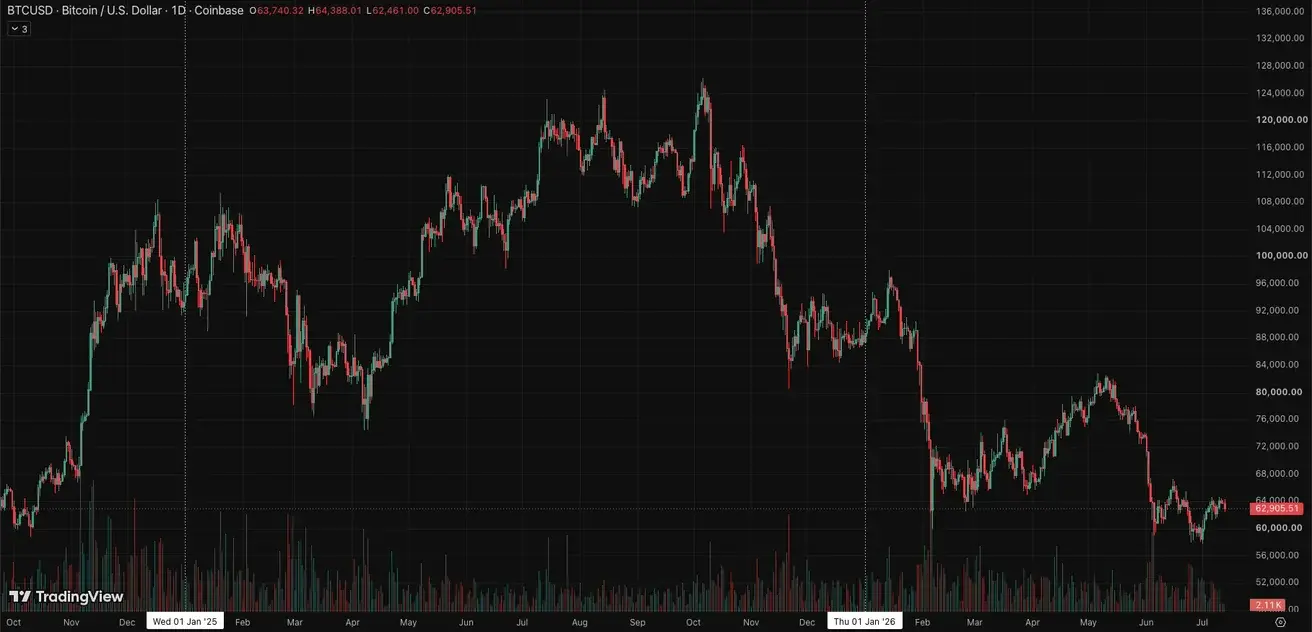
BTC Futures
Weekly performance: +0.25% (week close: $63,740.32); year-to-date: -27.34%.
ETH Futures
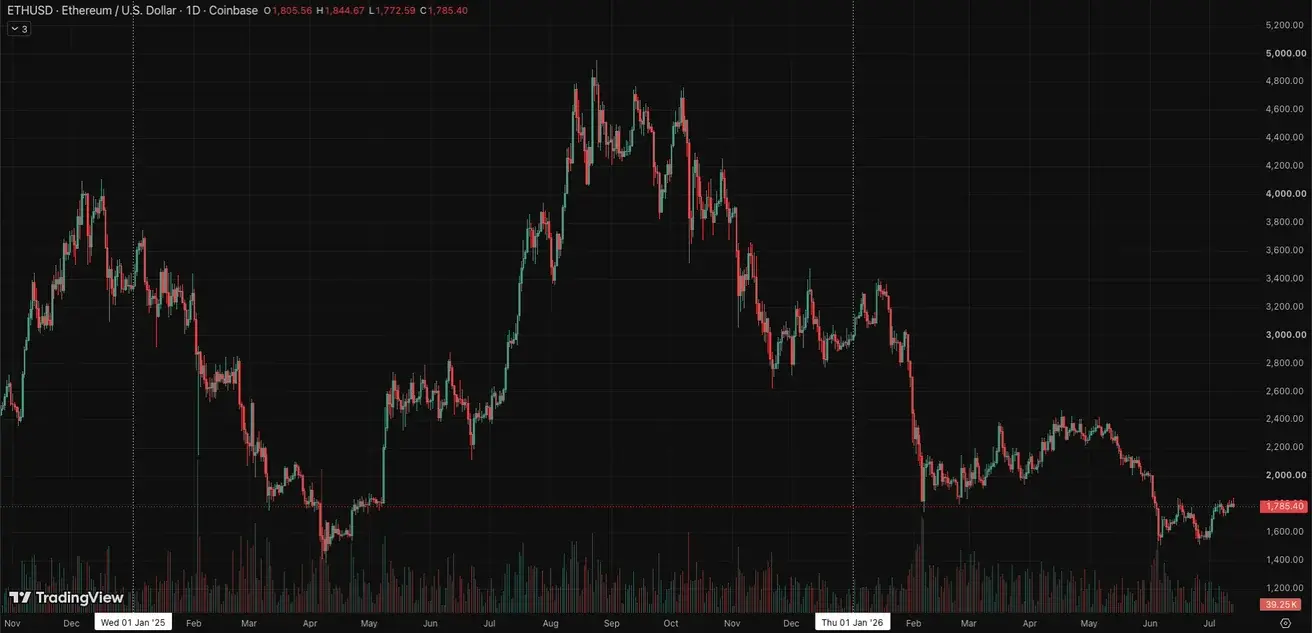
Weekly performance: +1.19% (week close: $1,805.51); year-to-date: -39.53%.
Total Cryptocurrency Market Capitalization
Total crypto market capitalization: $2.17 trillion (vs $2.18 trillion a week earlier) (coinmarketcap.com).
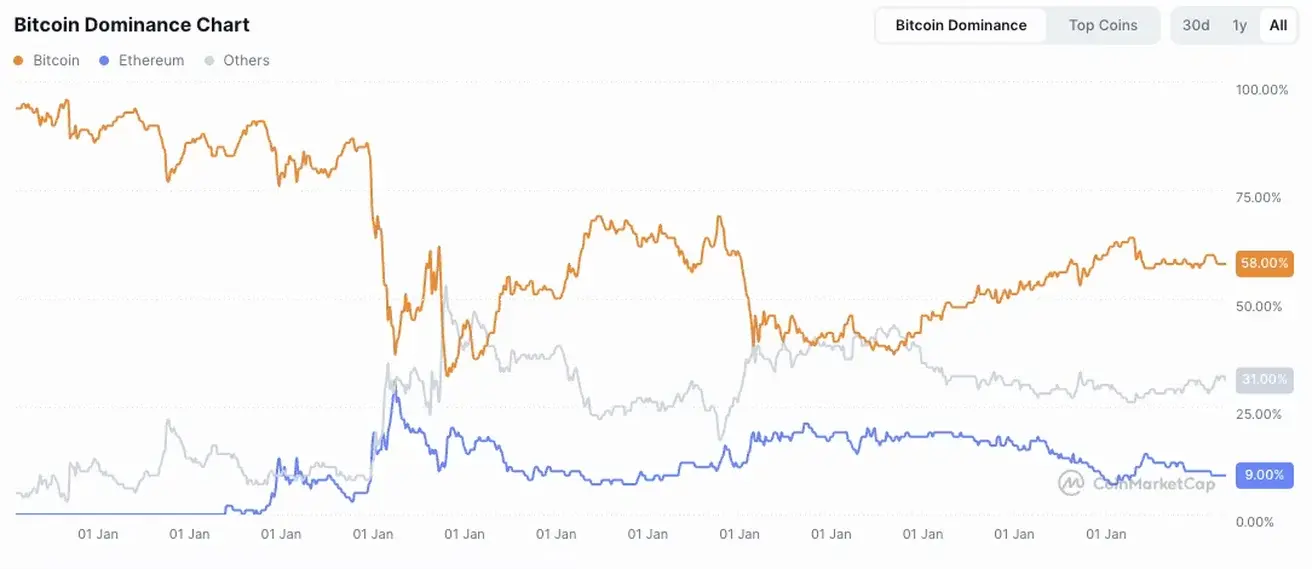
Crypto asset market shares:
- Bitcoin: 58.3% (previous: 58.11%);
- Ethereum: 9.9% (previous: 9.8%);
- Others: 31.8% (previous: 32.1%).
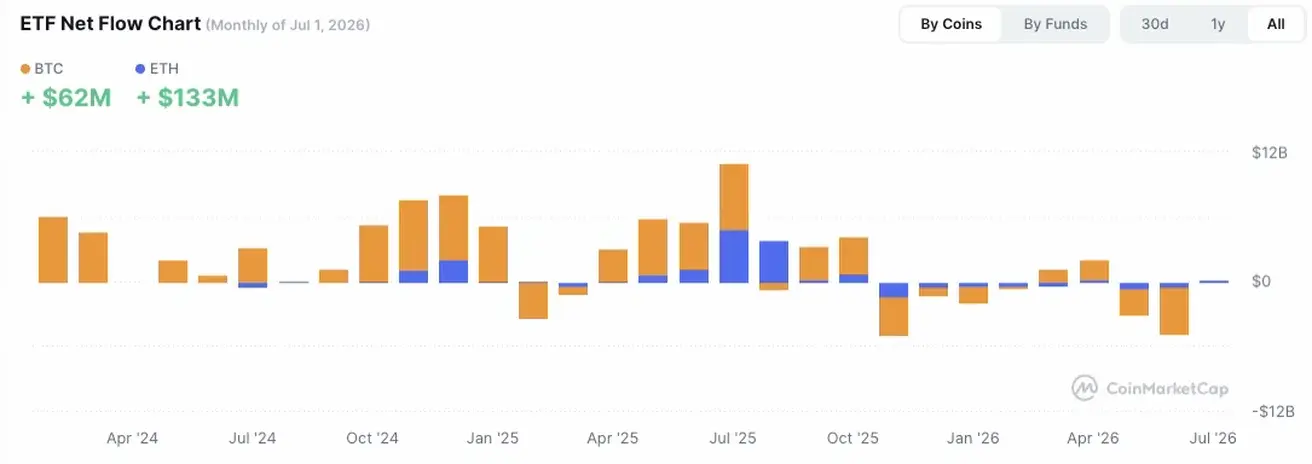
ETF Net Flows Chart: