 Lietuvių
 Русский
 Қазақша
 Eesti
EestiJuly 1-5: Economic Overview
Key market insights

Weekly economic update from Raison. In our weekly economic update for July 1-5 we have gathered key macroeconomic indicators, including inflation rates, GDP, and labor market statistics.
Macroeconomic statistics
INFLATION
- Core Consumer Price Index (CPI) (YoY) (April): 3.4%
- Consumer Price Index (CPI) (YoY) (April): 3.3%
THE FED'S INFLATION TARGET
- Core personal consumption expenditures price index (YoY) (Apr): 2.6% (pre: 2.8%)
- Personal consumption expenditures price index (YoY) (Mar): 2.6%, (pre: 2.7%)
INFLATION EXPECTATIONS
- 12-month expected inflation (June): 3.0%, pre: 3.3%
- 3-year expected inflation (June): 2.9% (prev: 2.8%)
- 5-year expected inflation (June): 2.8% (prev: 3.0%)
GDP (q/q) (Q1) (third estimate): 1.4% (second: 1.3%)
GDP Deflator (q/q) (Q1): 3.1% (prev: 1.7%)
Business Activity Index (PMI)
- Services Sector (June): 55.3 (prev: 51.8)
- Manufacturing Sector (S&P Global Composite) (June): 54.8 (prev: 54.5)
LABOR MARKET
- Unemployment rate (April): 4.1% (prev: 4.0%)
- Change in the number of people employed in the private non-agricultural sector (April): 136K, (prev: 193K)
- Average Hourly Earnings (June, y/y): 3.9% (prev: 4.1%)
- Total initial applications to unemployment benefits: 238K (prev: 234K)
UNEMPLOYMENT RATE
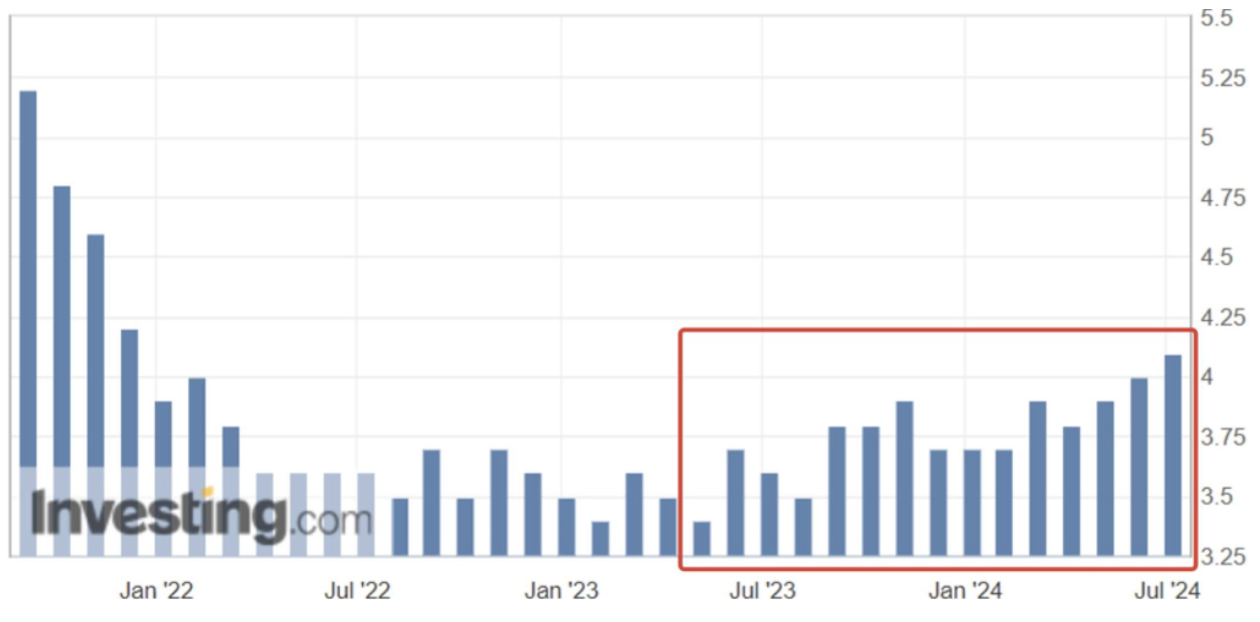
Last week's statistics showed a slowdown in the labor market. The unemployment rate in the United States rose to 4.1%, the highest figure in three years since November 2021. Judging by the chart, an upward trend is emerging. Given the restrictive policies that the Fed is conducting, this trend of rising unemployment will continue.
Increasing unemployment leads to reduced overall consumption, which typically results in a GDP contraction (recession). Historically, stock markets have reacted to such trends with declines. However, current wage dynamics and rising unemployment may bring some medium-term optimism. As Powell mentioned in his recent press conference, this is positive data for the Fed to ease monetary policy.
MONETARY POLICY
Last week, the Federal Open Market Committee (FOMC) released the minutes of their June 11-12, 2024, meeting (on July 3).
Economic Situation Overview
The available data at the time suggested that US economic activity grew steadily this year. Labor market conditions remained robust. Job growth continued, while the unemployment rate slightly increased but remained low. Consumer price inflation was significantly lower than a year ago, but further progress towards the Committee's 2% inflation target had been modest in recent months.
Real GDP grew modestly in the first quarter, constrained by substantial negative contributions from inventory investment and net exports, typically volatile components. In contrast, private domestic final purchases (PDFP), which include PCE and private fixed investment and often provide a better signal than GDP of underlying economic dynamics, grew solidly, as they did last year. Recent spending data showed that GDP and PDFP grew solidly in the second quarter.
Between meetings, the market trajectory of the federal funds rate beyond the next few months declined. Interest rate futures options suggested that market participants saw higher odds of policy easing by early 2025 than just before the April FOMC meeting. In line with a slight downward shift in the implied policy trajectory, the nominal yield of Treasury bonds across all maturities also declined moderately, mainly due to a decrease in the real yield of Treasury bonds.
ECONOMIC FORECAST
The economy is expected to maintain a high level of resource utilization over the next few years, with real GDP growth projected to be roughly in line with the staff's estimate of potential output growth. The unemployment rate is expected to decrease slightly for the rest of this year and next year, then remain about the same through 2026.
Overall and core PCE inflation are projected to be lower at the end of this year than at the end of last year. The staff's inflation forecasts for this year, which incorporated a preliminary response to the May CPI data, were largely unchanged from the inflation forecast at the time of the previous meeting.
When considering monetary policy at this meeting, participants noted that incoming data indicated continued solid economic activity growth and a strong labor market, as well as modest further progress towards the Committee's 2% inflation goal in recent months.
In discussing the outlook for monetary policy, participants noted that progress in reducing inflation this year had been slower than they expected last December. They emphasized that they did not expect it would be appropriate to reduce the target range for the federal funds rate until additional information provided greater confidence that inflation was moving sustainably towards the Committee's 2% goal.
Annual Bank Stress Test by the Fed
Results of this stress test showed that while large banks would incur higher losses than in last year's test, they are well-prepared to weather a severe recession and remain above current capital requirements.
(*a severe recession is not the regulator's baseline scenario but a simulation of extreme conditions).
Conclusion
Raising capital requirements is one of the monetary policy tools directly affecting lending and, consequently, business activity. Currently, the Fed does not see the need for further tightening monetary policy regarding reducing the current level of lending.
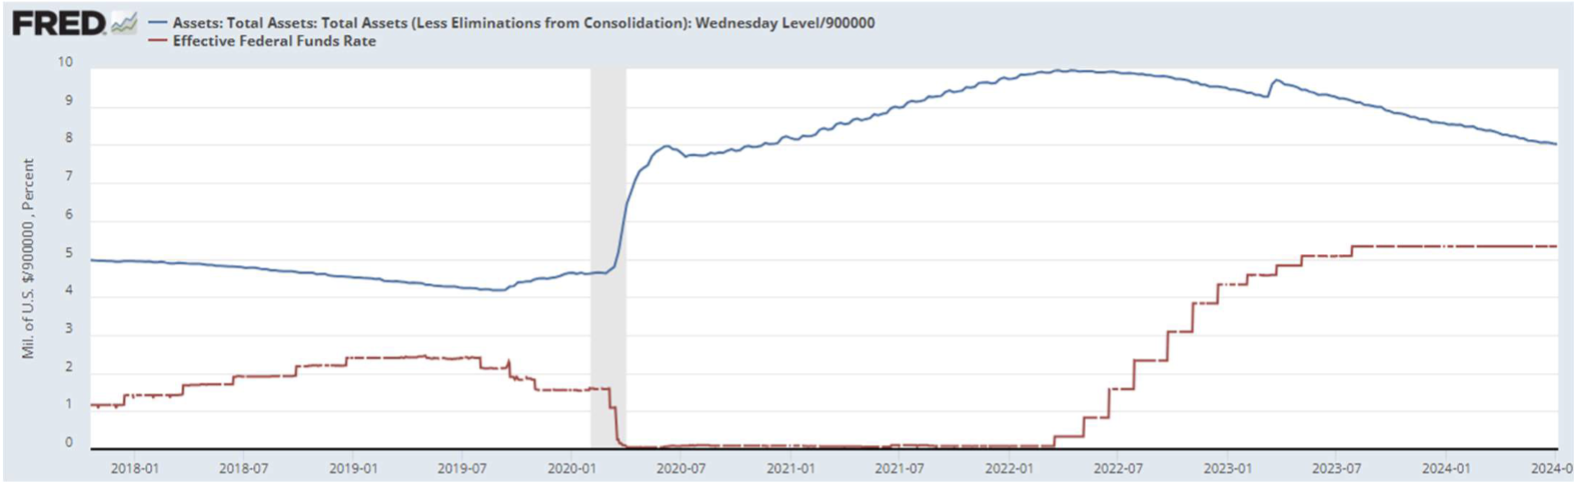
Federal Funds Rate (EFFR): 5.50% (in red).
Fed Balance Sheet: down from peak ($8.965 trillion) by -$1.744 trillion (-19.45%) (in blue).
Fed Representatives' Rhetoric
Remains unchanged - one rate cut towards the end of the year. Fed Chairman Powell: "Prices show signs of resuming a disinflationary trend," referring to the latest core PCE report. However, since the US economy is strong, we can afford to take our time."
(*Powell's statement was made before the labor market data was released).
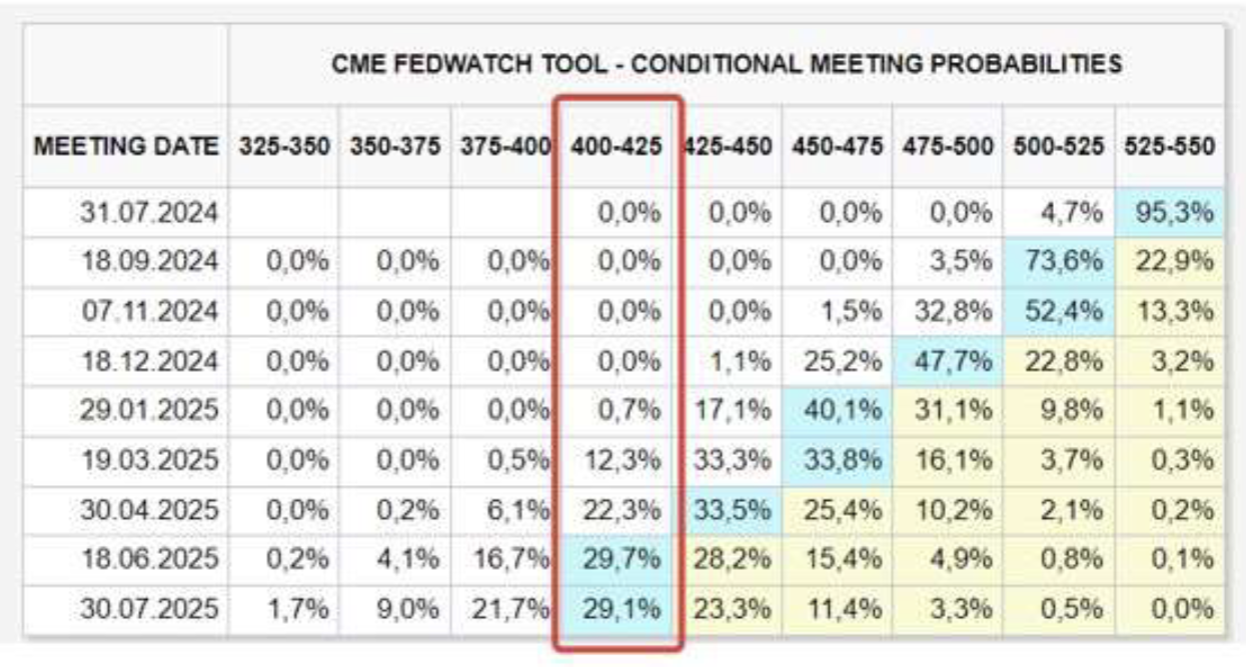
Market Rate Forecast (FedWatch)
- For December this year: unchanged at 4.75%-5.00% (two cuts expected by December 2024).
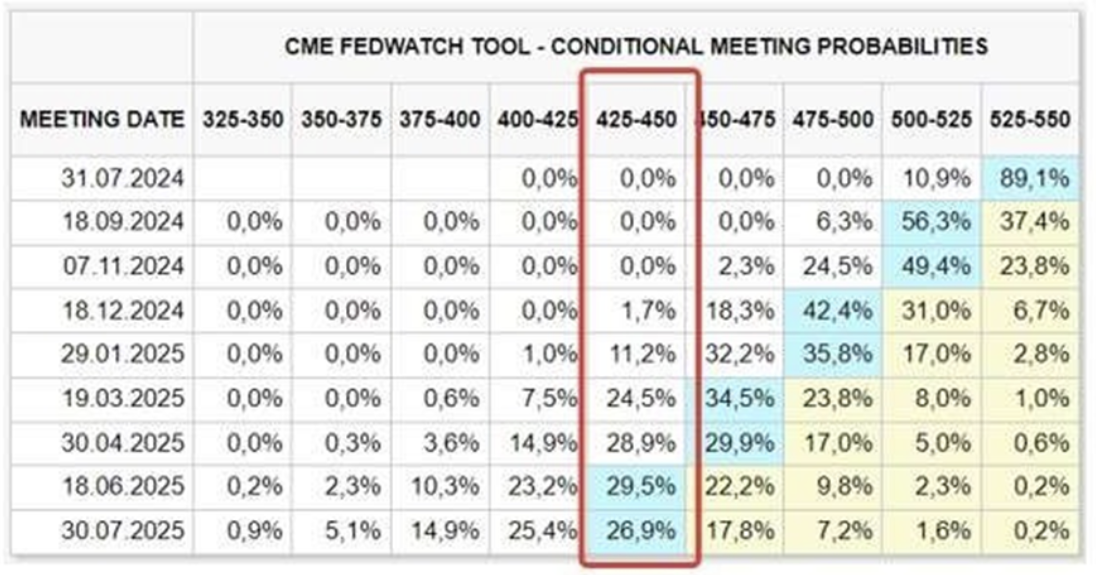
- Long-term expectations: (one year ahead) improved, with a decrease to 4.00-4.25%.
Today:
A week ago:
Monetary Policy Summary
The regulator does not yet provide clear signals for easing monetary policy. The focus is on the next Fed meeting, scheduled for July 31, 2024. Meanwhile, statistical data is quite mixed – the labor market is slowly cooling following the trend. Business activity indices (PMI) do not yet show significant economic slowdown. However, leading indicators are at levels that usually correlate with a recession. Inflation is decreasing, but the risk of a new surge remains.
One inflation indicator – the cost of sea freight.
Freight costs (see chart below) have been steadily rising since January this year. Increased logistics costs always affect the prices of all goods.
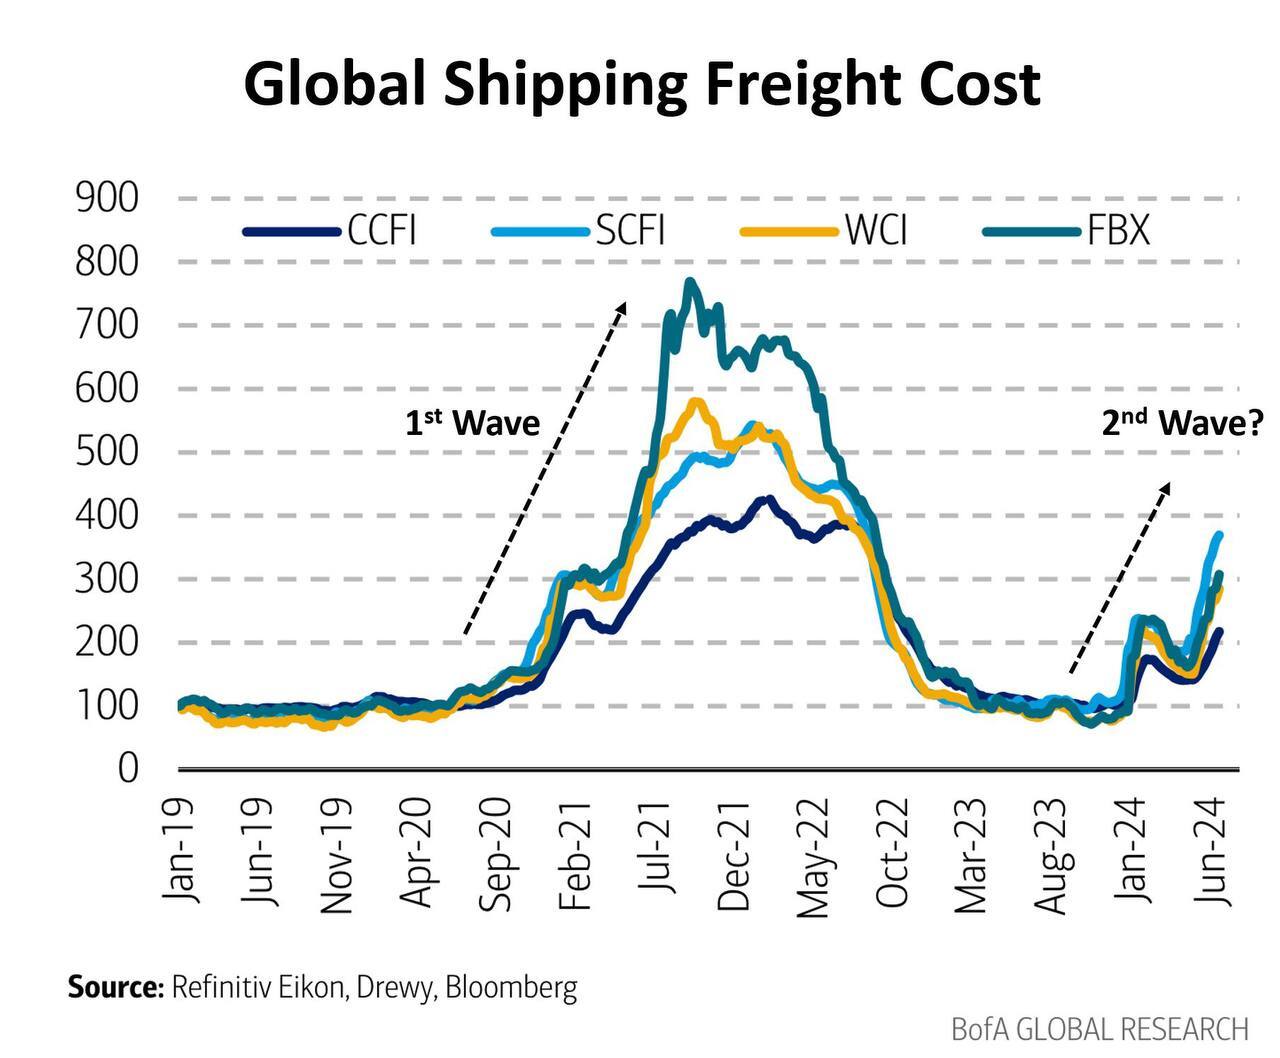
Moreover, if oil prices continue to rise (due to various geopolitical reasons), inflation may start to increase. Rising inflation, even slightly, in the context of restrictive monetary policy, will negatively impact stock markets and the bond market.
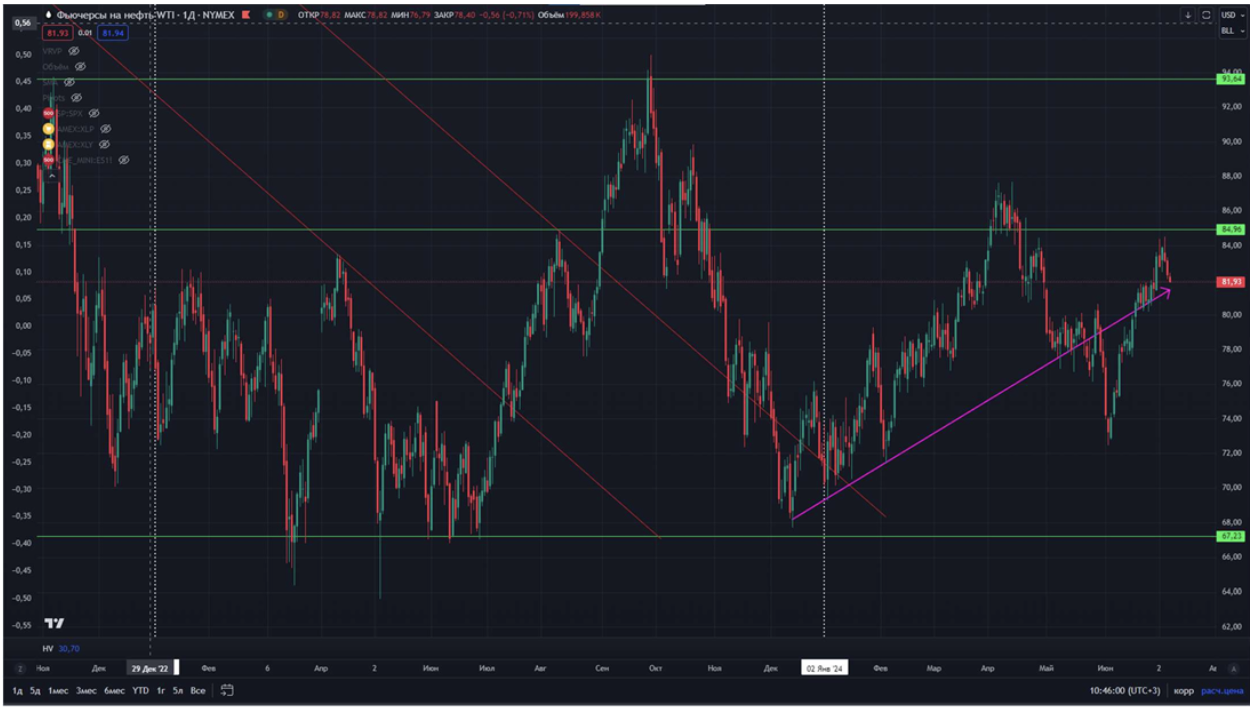
Oil futures rose by 20% over the same period.
STOCK MARKET
SP500
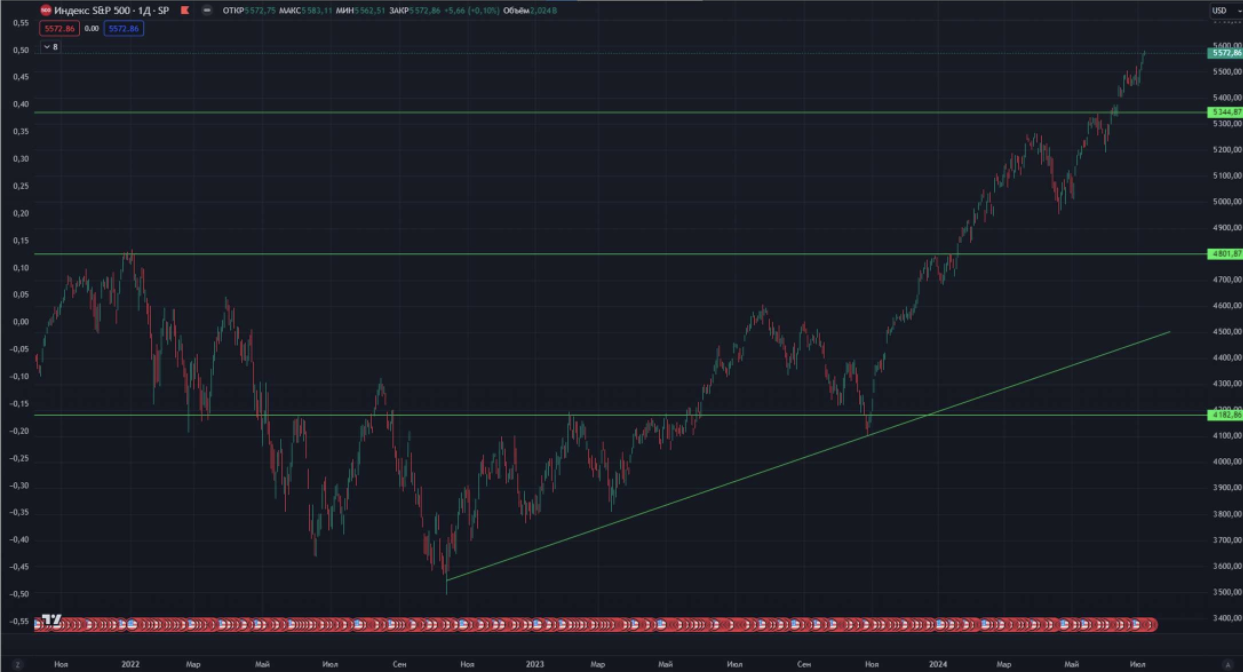
The S&P 500 index continues to hit historical highs despite everything. The growth last week was 1.86%, and after the April correction, the growth was 12.5%.
For comparison, the average annual return of the S&P 500 over 53 years from 1970 to 2023 was 8.9%.
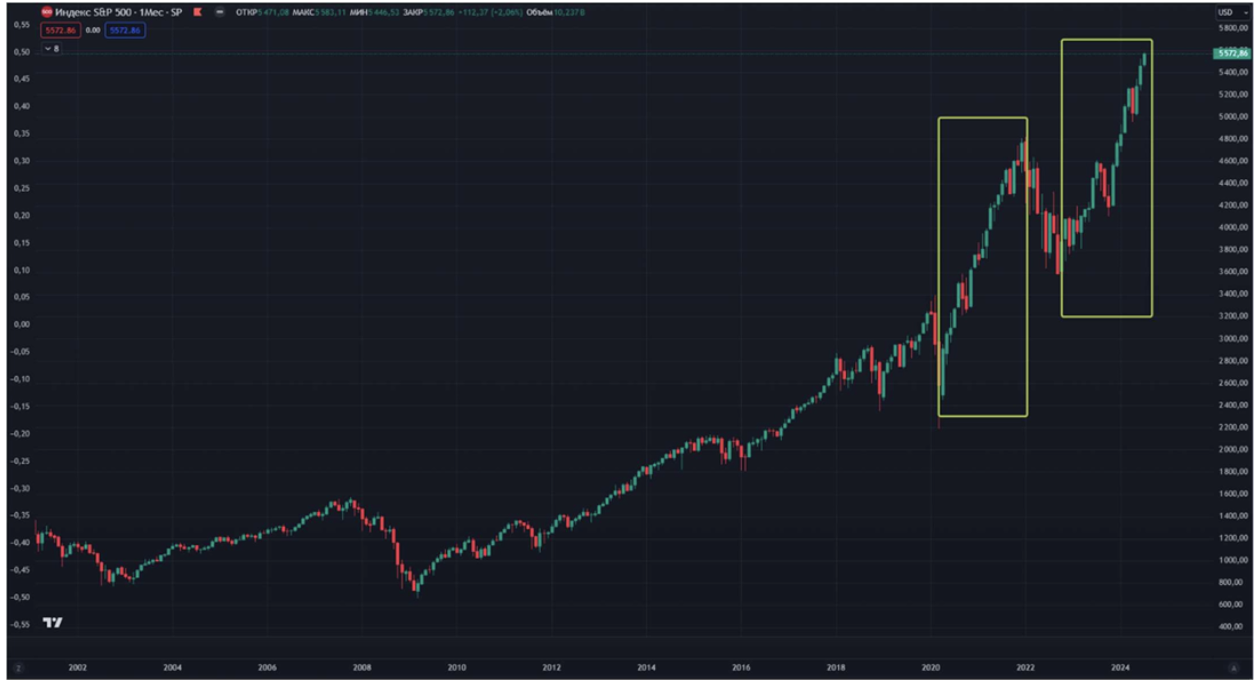
When looking at the index globally (monthly candles), it can be seen that since October 2022, during a period of high rates, the SP500 has been growing at the same maximum pace as during the unprecedented COVID-19 economic stimulus – when massive liquidity of over $4.5 trillion and zero rates were injected. The entire index's growth is structurally shifted towards mega-cap tech companies.
The reporting season starts this week. The further dynamics of stock indices will depend on the results of the income of the Magnificent 7. If reports and, most importantly, management forecasts remain positive, we will see new highs in the indices. However, it is important to understand that future expectations are already priced in, and strong previous income dynamics cannot continue indefinitely. If reports show income growth but below forecasts, the indices will enter a correction. But at the moment, investor sentiment is positive.
Short Positions on the Nasdaq Index
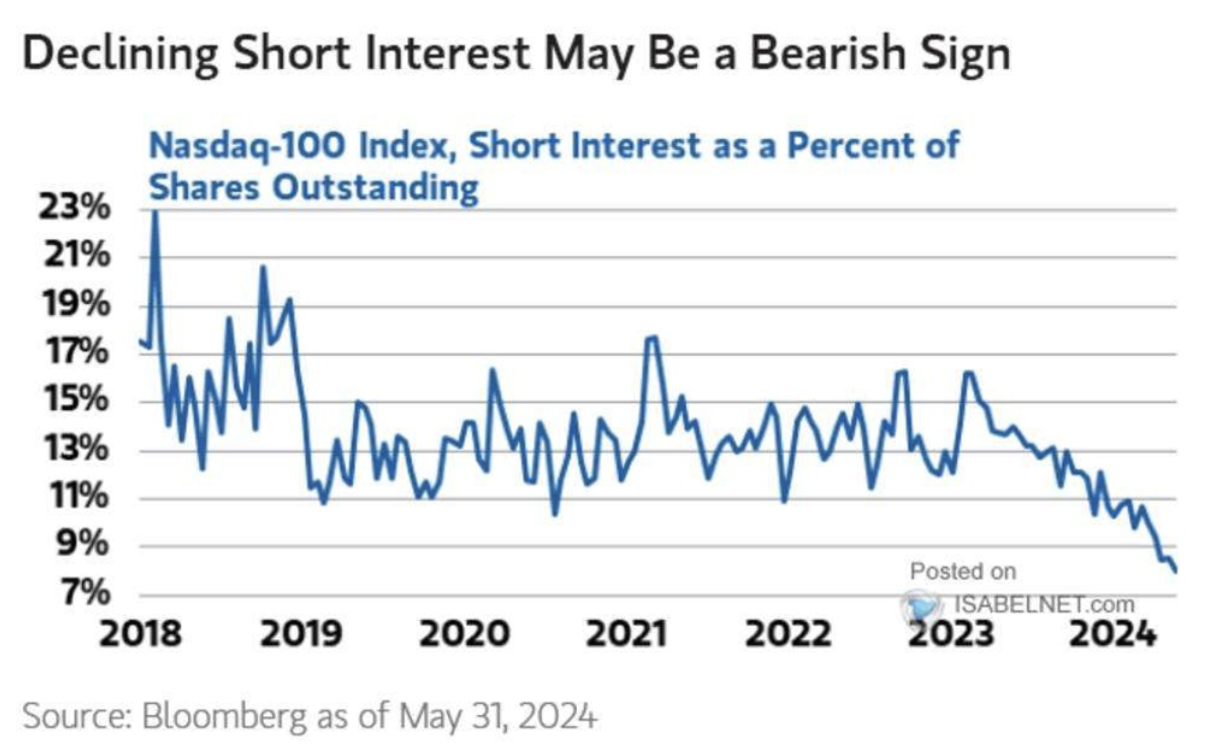
*Short interest is the ratio of shares sold short to the total number of shares outstanding. The lower the indicator, the more bullish the market sentiment.
Short interest continues to decline, reaching historic lows. Currently, only 8% of shares in the tech index are in short positions, which is historically low. On the one hand, it can be said that fewer players believe in a market decline; on the other hand, extreme lows can be seen as a bearish signal. But this is an election year, and markets statistically tend to be positive during such periods.
Leading US Banks Increase Dividends and Launch Buybacks after Successful Fed Stress Tests
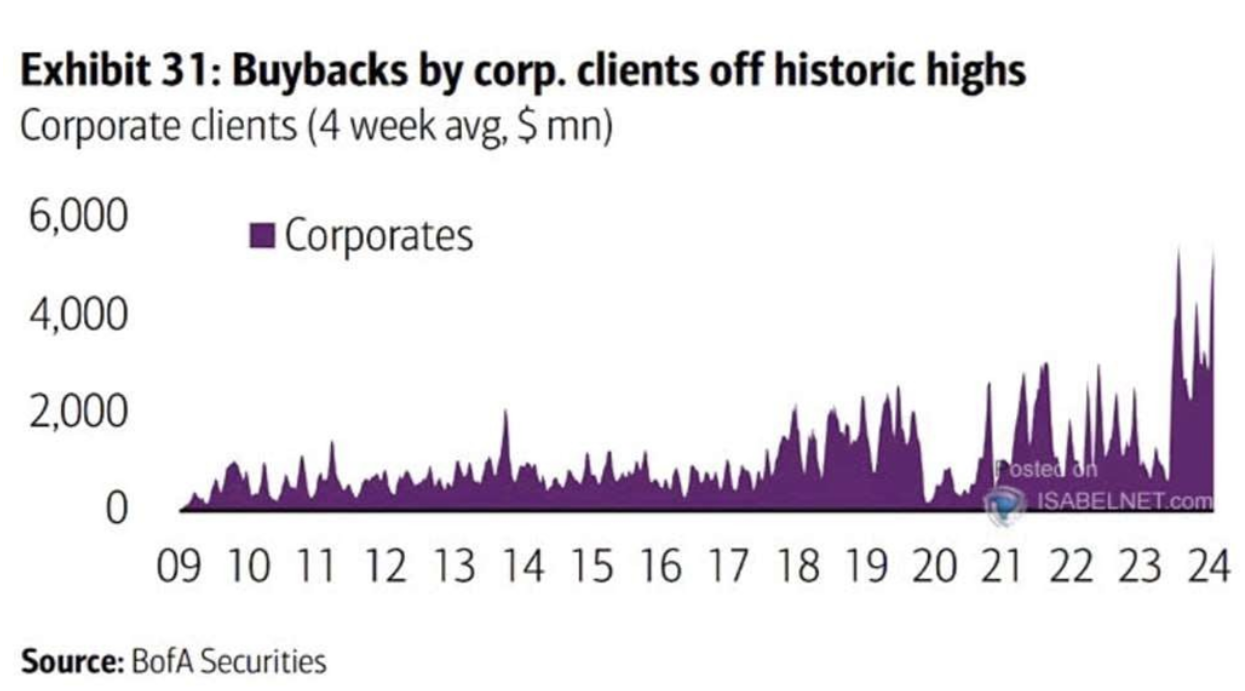
The largest US bank, JPMorgan, approved a new buyback program of up to $30 billion; Morgan Stanley confirmed an open-ended buyback program of up to $20 billion.
DIVIDENDS
- JPMorgan Chase & Co. plans to raise its quarterly dividend to $1.25 from $1.15 per share (by 8.7%).
- Morgan Stanley - up 92.5 cents from 85 cents (up 8.8%).
- Goldman Sachs Group - up to $3 from $2.75 (by 9.1%).
- Citigroup - up to 56 cents from 53 cents (by 5.7%).
- Bank of America Corp. - up to 26 cents from 24 cents (by 8.3%).
- Wells Fargo & Co. - up to 40 cents from 35 cents (by 14.3%).
LONG-TERM TREASURY BONDS
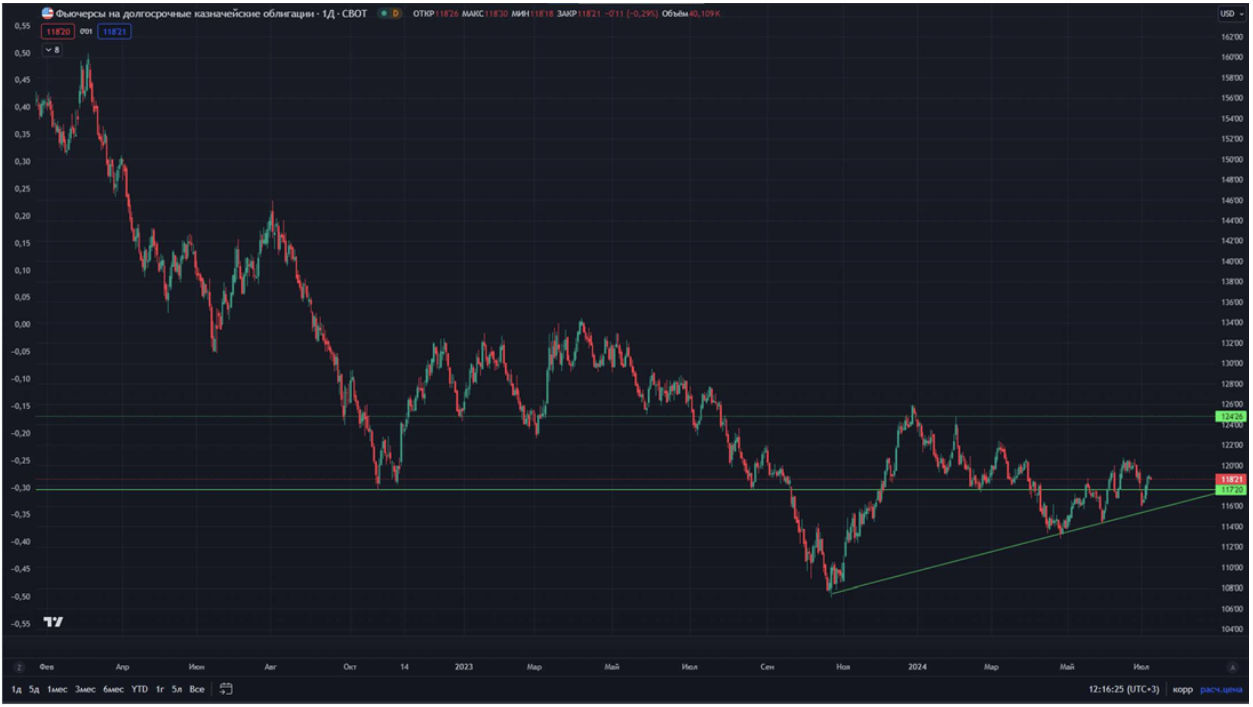
Last week, long-term US Treasury bonds showed an increase of 1.18%, closing the week above the support level. This dynamic is related to Powell's rhetoric that the regulator sees a continued slowdown in inflation and labor market statistics.
US DOLLAR
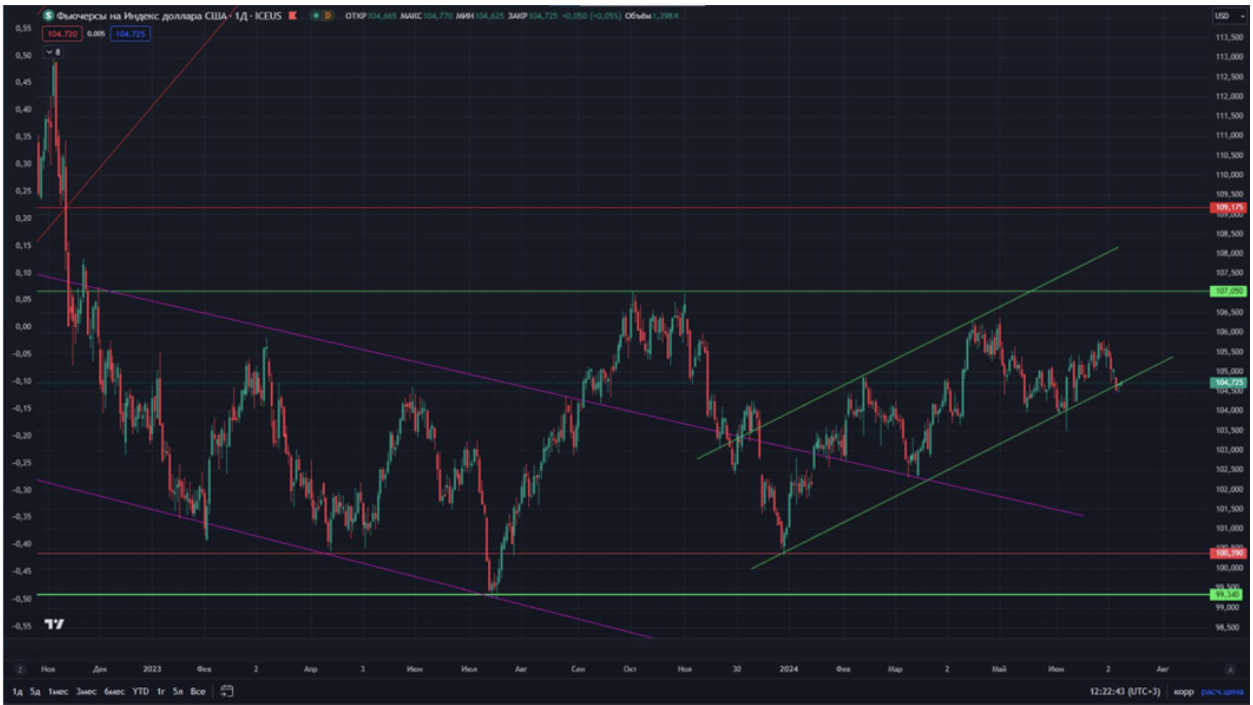
The dollar index is testing the lower boundary of the upward channel. Monetary policy determines the overall dynamics of the US currency. Maintaining the current rate will support the dollar.
BTC
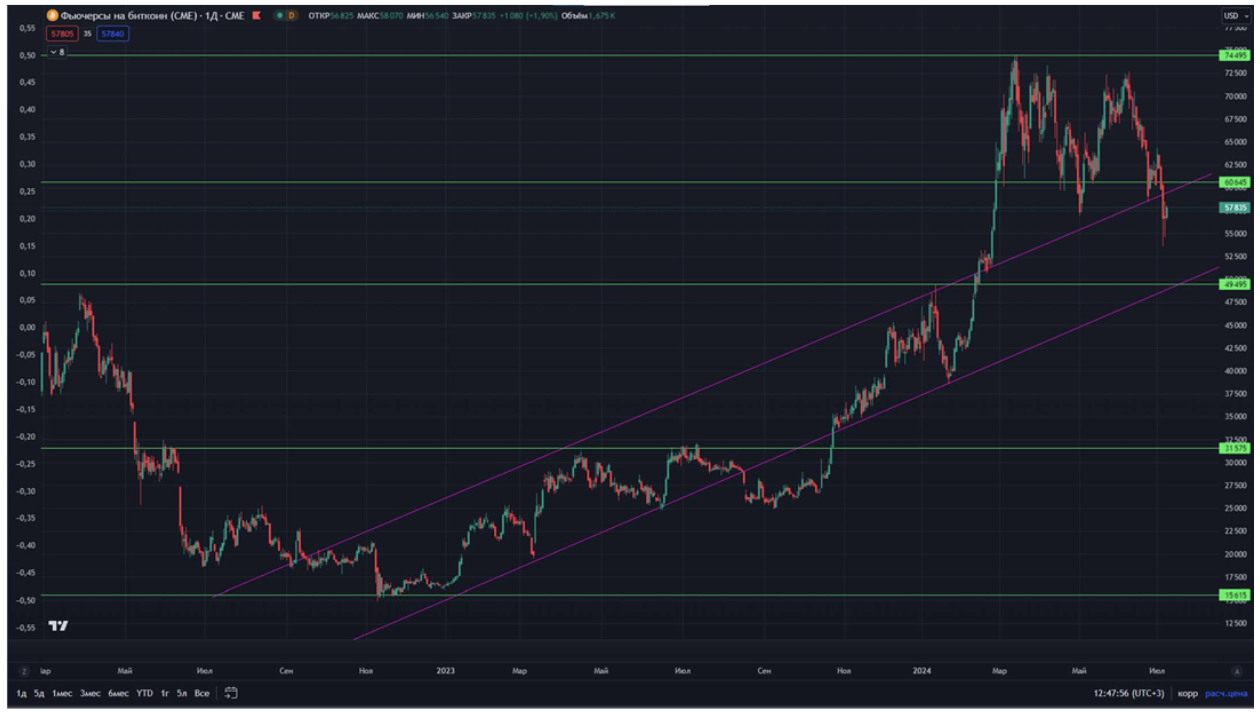
Bitcoin's value continues to decline amid uncertainty related to payouts being prepared for investors affected by the bankruptcy of the Mt. Gox crypto exchange. There are concerns that creditors, who have been waiting for compensation for ten years, may sell their coins once they receive them, negatively impacting prices. In 2014, when the platform was hacked, Bitcoin was worth around $600, whereas today its value is approximately $57,000.
FINANCING ARTIFICIAL INTELLIGENCE STARTUPS
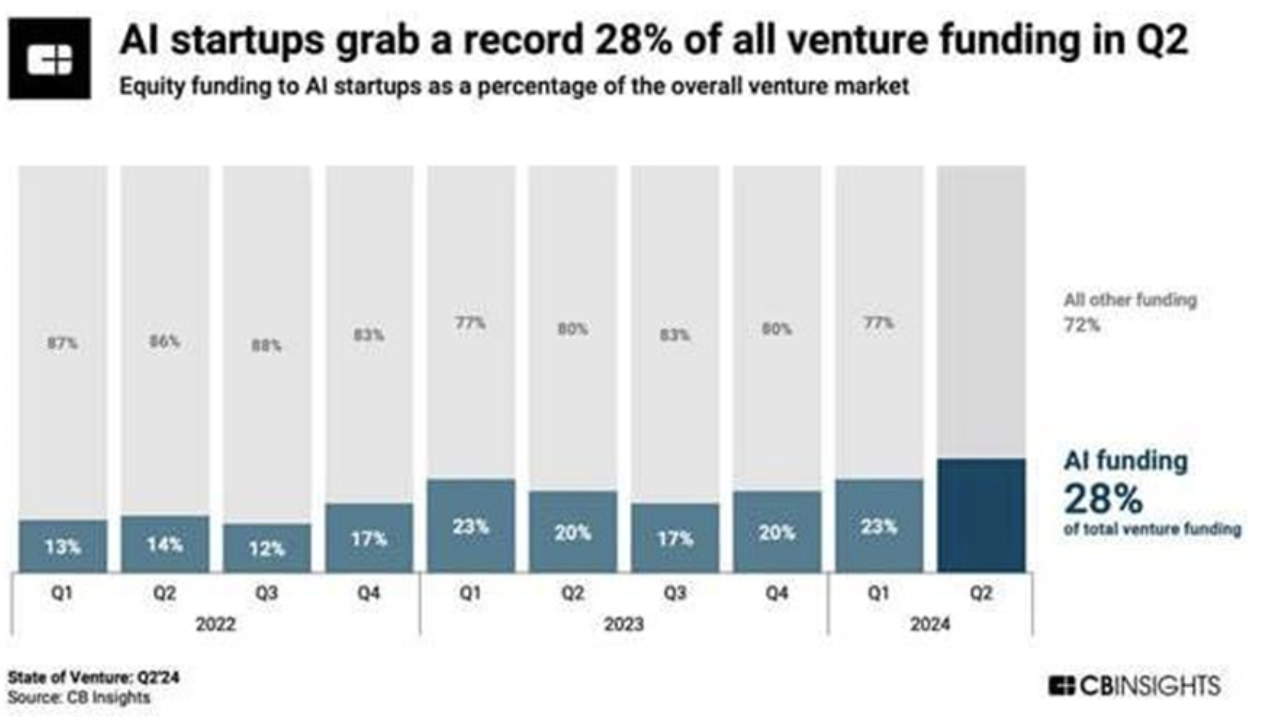
Of the $65.7 billion raised by startups during 2Q24, 28% went to artificial intelligence projects. For AI companies, this is the highest indicator of the share of quarterly capital financing in the amount of $18.3 billion. The AI sector continues to attract significant investments.
Interested in buying private tech companies' shares with us? Check out our Wealth and Growth account plans, which provide you access to exclusive venture capital deals!
Disclaimer: “The use of the trademark is for informational purposes only and does not imply endorsement or affiliation. Additionally, the information in this communication is for informational purposes only and is neither an offer to purchase, nor a solicitation of an offer to sell, subscribe for or buy any securities.”