Lietuvių
 Русский
 Қазақша
 Eesti
EestiJune 1 – 7, 2026: Weekly economic update
Key market updates

Key takeaways:
- Rates remain unchanged, with a cautious policy stance;
- The monetary policy framework remains moderately restrictive;
- U.S. macroeconomic data continue to support the soft-landing scenario. Inflation risks are increasing, while the labor market is cooling without showing signs of recession and, at this stage, does not warrant a rate cut.
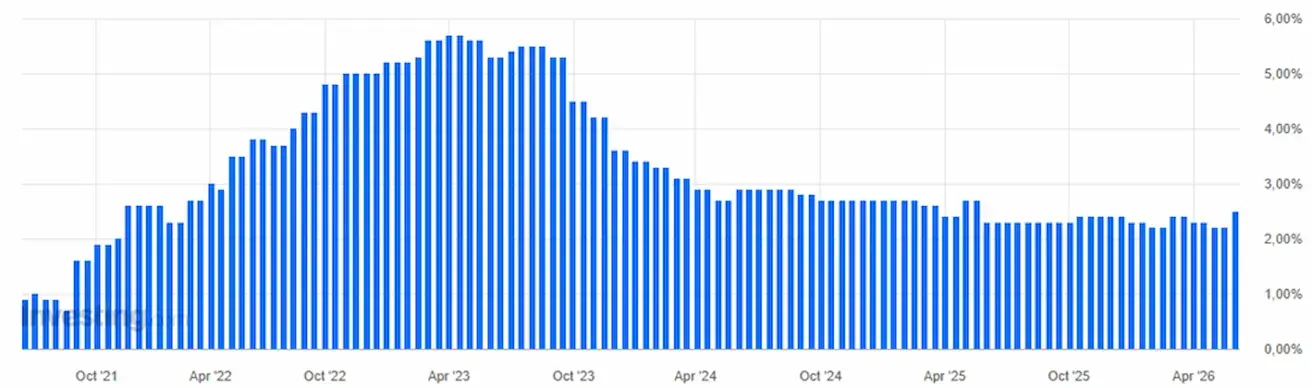
INFLATION: CONSUMER PRICE INDEX (APRIL):
- Core CPI: (MoM) 0.4% (prev.: 0.2%); (YoY) 2.8% (prev.: 2.6%).
- CPI: (MoM) 0.6% (prev.: 0.9%); (YoY) 3.8% (prev.: 3.3%).
PRODUCER PRICE INDEX (APRIL):
- PPI (MoM): 1.4% (prev.: 0.7%, revised).
- Core PPI (MoM): 1.0% (prev.: 0.2%, revised).
INFLATION EXPECTATIONS (MICHIGAN) (MAY):
- 12-month inflation expectation: 4.8% (prev.: 4.7%);
- 5-year inflation expectation: 3.9% (prev.: 3.5%).
GDP (U.S. Bureau of Economic Analysis, BEA) (Q1 2025 annualized, second estimate): +2.0% (Q4 2024: +0.5%); forecast: 2.0%.
GDPNow indicator (the Federal Reserve Bank of Atlanta’s real-time estimate of official GDP growth prior to publication): 3.0% (prev.: 3.8%).
BUSINESS ACTIVITY INDEX (PMI) (MAY, PRELIMINARY DATA):
(Above 50 indicates expansion; below 50 indicates contraction)
- Services sector: 50.7 (prev.: 50.9);
- Manufacturing sector: 55.1 (prev.: 54.5);
- Composite: 51.5 (prev.: 51.7).
LABOR MARKET (BLS) (MAY)
- Unemployment rate: 4.3% (prev.: 4.3%);
- Total number of individuals receiving unemployment benefits in the U.S.: 1,786K (prev.: 1,782K);
- Initial jobless claims: 225K (prev.: 215K);
- Change in nonfarm payrolls: 172K (prev.: 179K);
- Change in private nonfarm payrolls: 120K (prev.: 177K);
- Average hourly earnings (YoY): 3.4% (prev.: 3.6%);
- JOLTS job openings: 6.866M (prev.: 6.922M).
MONETARY POLICY
- Federal Reserve Board members’ rhetoric has shifted in a more hawkish direction.
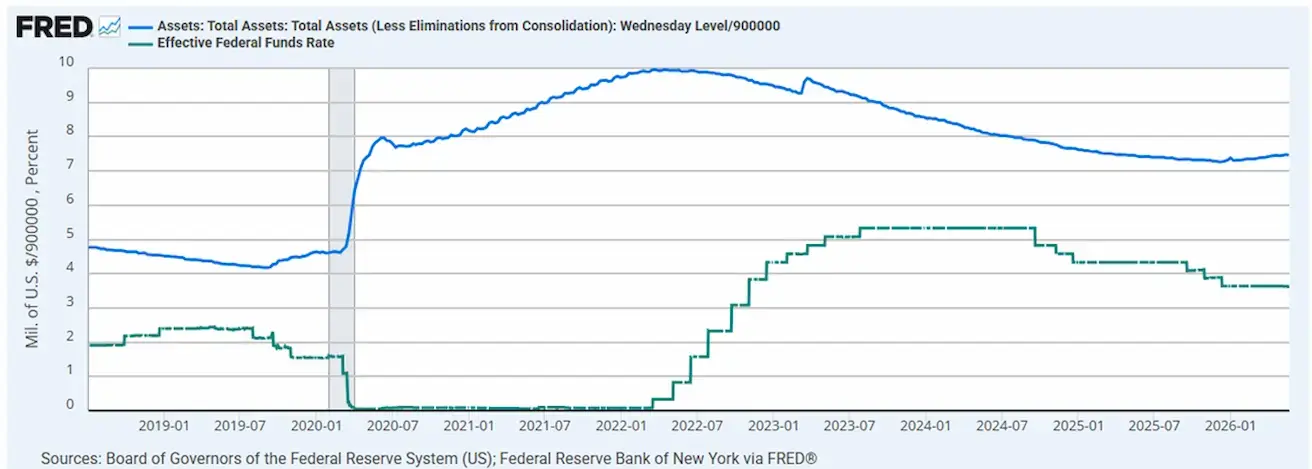
- Effective Federal Funds Rate (EFFR): 3.50%–3.75%;
- Federal Reserve balance sheet: $6.711 trillion, up 2.69% since the suspension of quantitative tightening (QT) ($6.535 trillion).
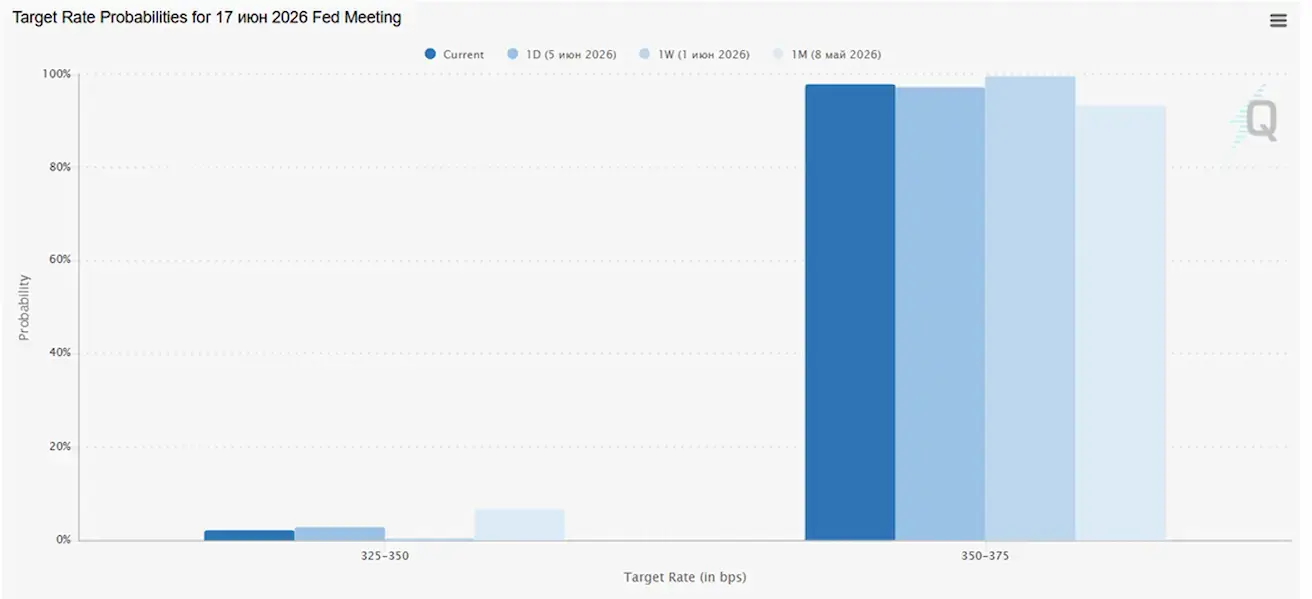
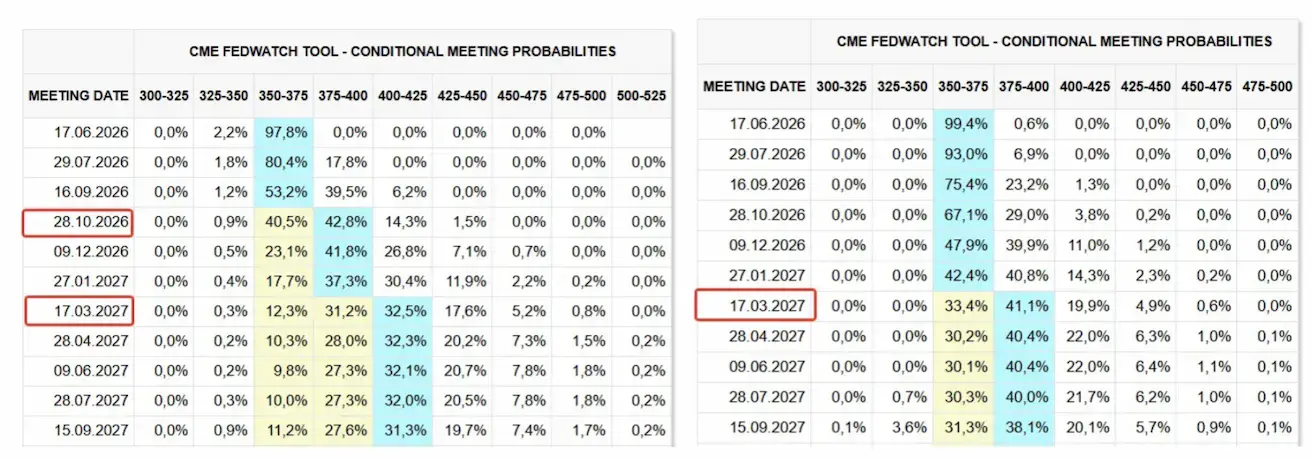
MARKET FORECAST FOR RATE (FEDWATCH)
At the next meeting (June 17), the estimated probability of the rate remaining unchanged stands at 97,83%.
Over the next 12 months, the market is pricing in two 25-basis-point rate hikes, bringing the target range to 4.00–4.25%, with increases expected in October and March 2027.
Today and a week earlier:
Market
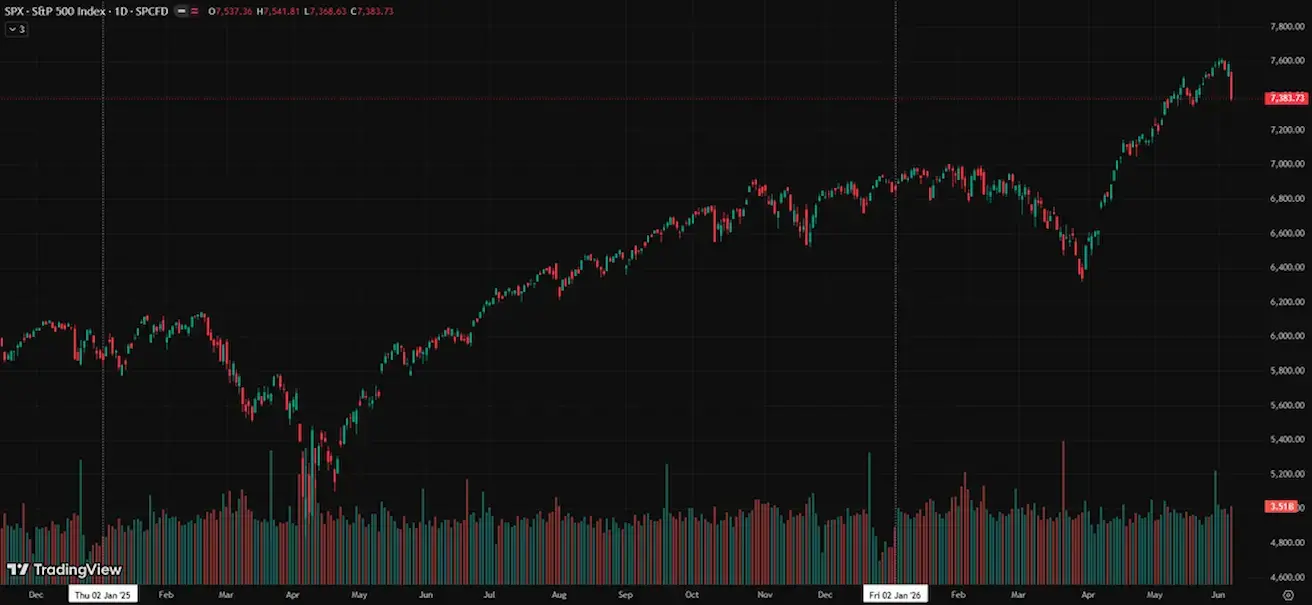
SP500
Weekly performance: -2,59% (week-end close: 7383,73); year-to-date: +7,86%.
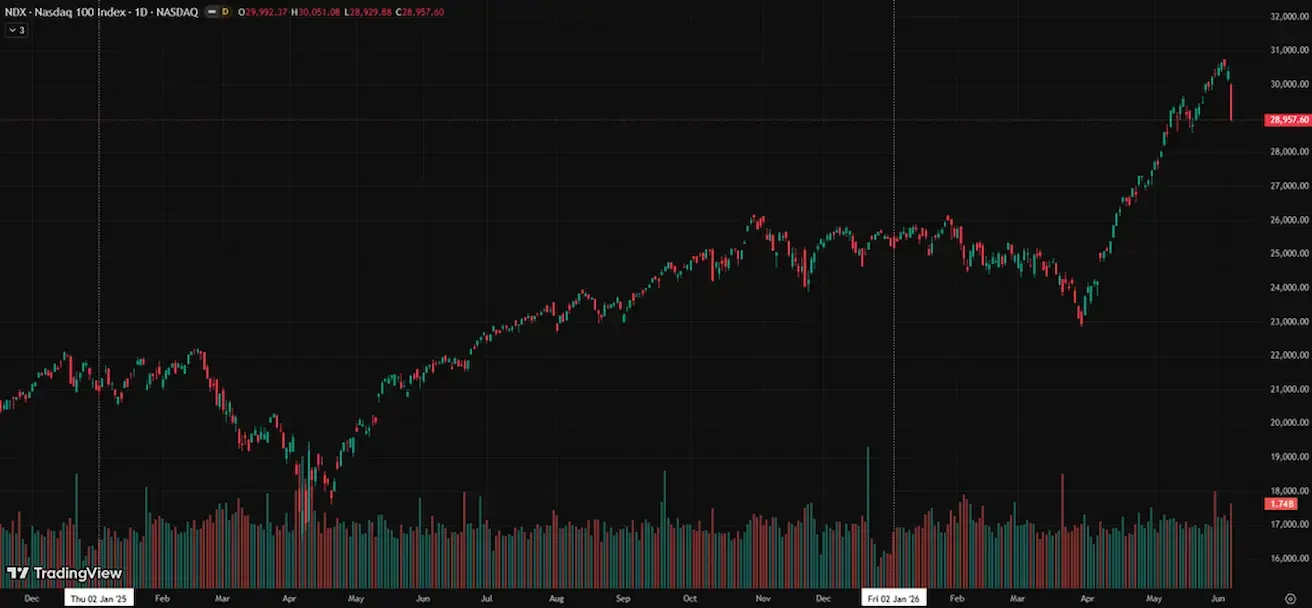
NASDAQ100
Weekly performance: -4,53% (week-end close: 28957,60); year-to-date: 14,68%.
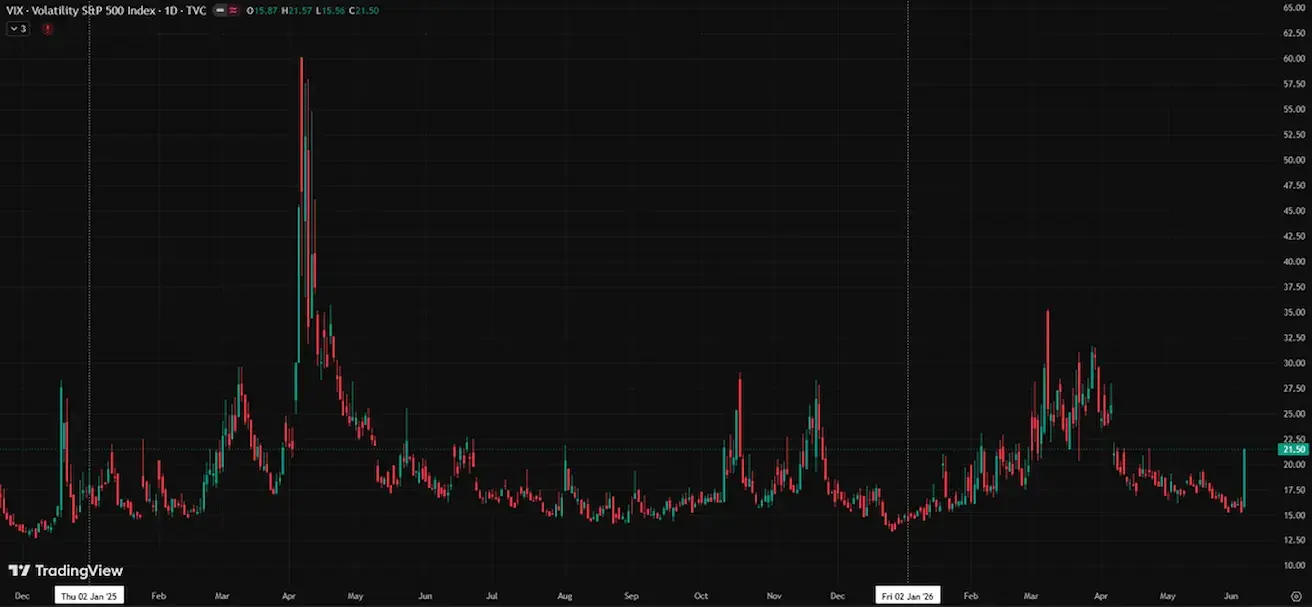
VIX
VIX (volatility index): week closing at 21,50 points.
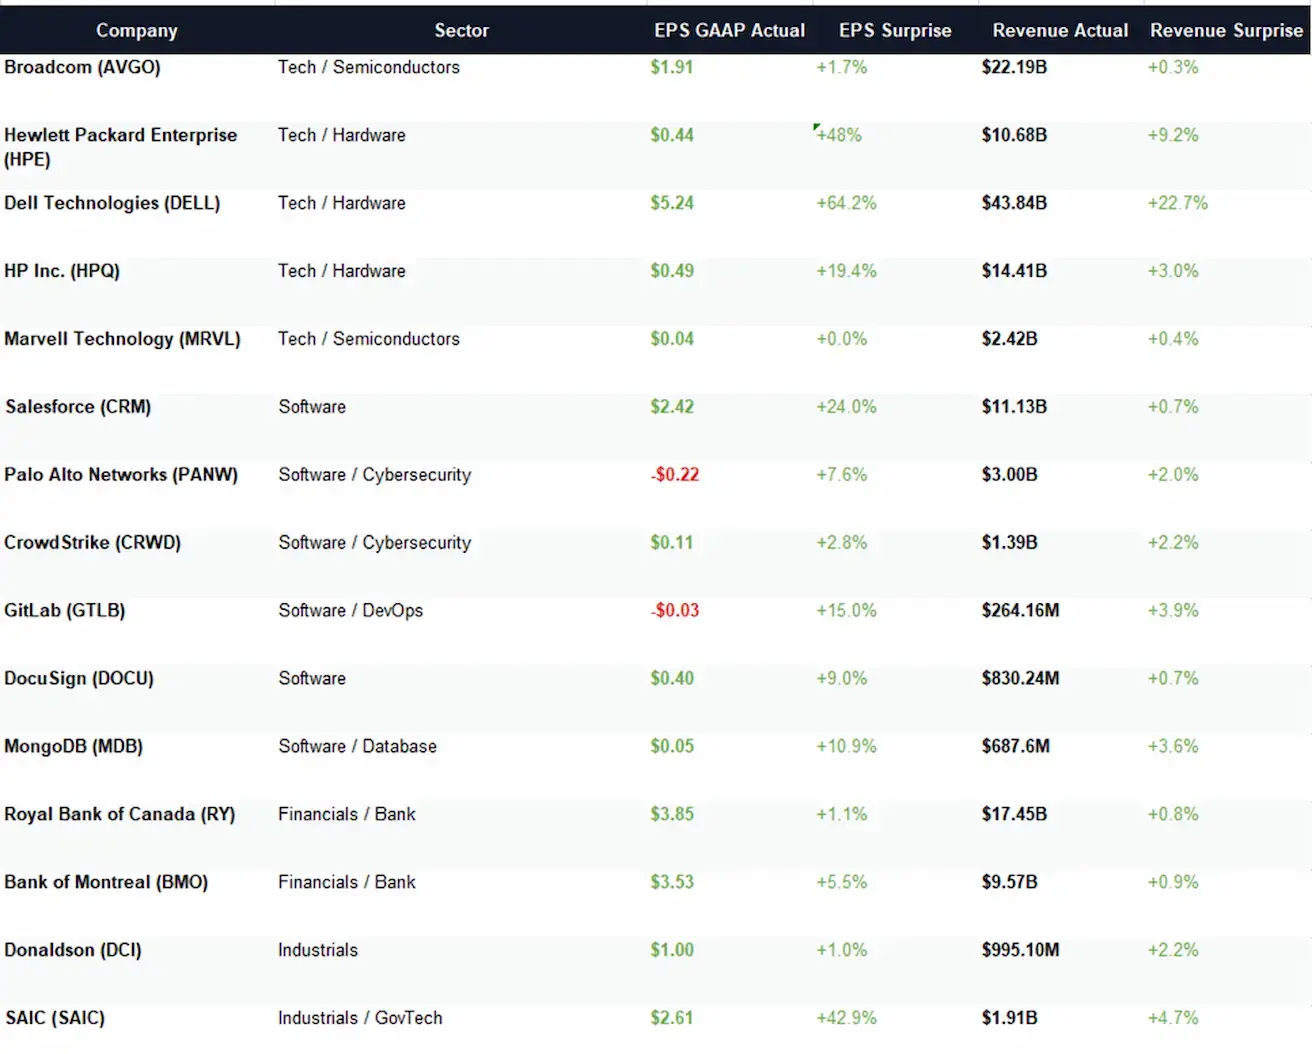
Selected corporate earnings reports from the past week:
Sector Commentary
Technology Sector
The technology sector performed better than expected: Dell and HPE delivered particularly strong earnings surprises, while Broadcom and HP posted more moderate outperformance. Marvell confirmed steady, though not explosive, demand.
Software
The software segment also showed a positive picture: Salesforce, GitLab, MongoDB, and CrowdStrike exceeded expectations. However, revenue surprises were modest, suggesting a normalization of growth rates.
Financial Sector
The financial sector remained resilient: Canadian banks slightly outperformed expectations, though without any significant acceleration in growth.
Industrial Sector
The industrial sector delivered mixed but generally positive results: Donaldson remained stable, while SAIC performed notably above consensus estimates.
Overall Conclusion
Overall, earnings reports supported risk appetite, though without triggering a broad-based wave of euphoria. Investors continued to favor companies with visible demand drivers tied to AI, infrastructure, and corporate spending more broadly.
Eurozone
- Policy rates remain unchanged for now, but inflation risks are rising;
- The monetary policy stance is neutral, although the balance of risks has shifted toward inflation;
- As the conflict in the Middle East escalated, the ECB revised its GDP growth forecasts downward and raised its inflation projections for the coming years.
Interest Rates
- Deposit facility rate: 2.0% (prev.: 2.0%);
- Marginal lending facility rate: 2.4% (prev.: 2.4%) (the rate at which banks can obtain overnight funding from the ECB);
- Main refinancing rate (key policy rate): 2.15% (prev.: 2.15%).
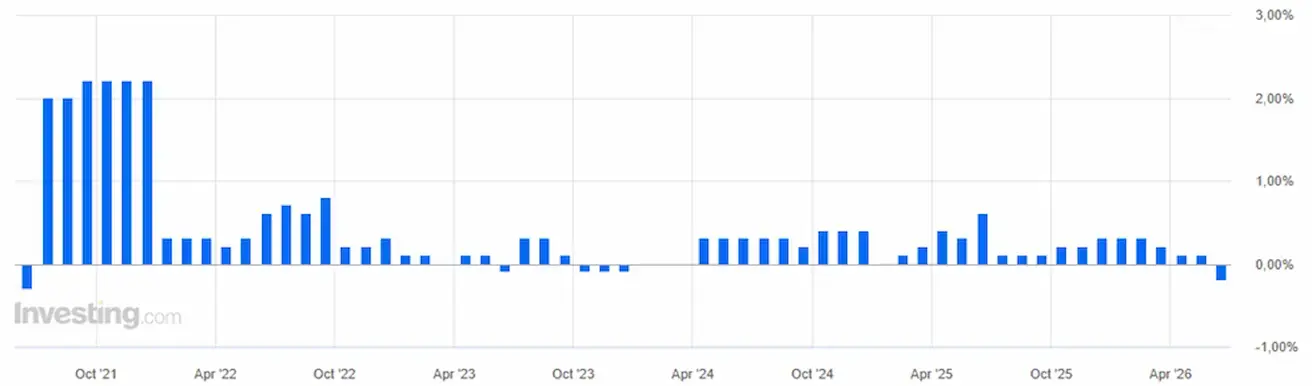
Inflation: Consumer Price Index (CPI) (May)
-
Core CPI (YoY): 2.5% (prev.: 2.2%).
-
CPI: (MoM) 0.1% (prev.: 1.0%); (YoY) 3.2% (prev.: 3.0%).
GDP growth (Q1, preliminary estimate): (QoQ) -0.2% (prev.: 0.1%):
GDP growth (YoY): 0.3% (prev.: 1.2%)
Unemployment rate (May): 6.3% (prev.: 6.3%).
Industrial production (MoM) (February): 0.4% (prev.: -0.8%).
Purchasing Managers’ Index (PMI) (May):
- Services sector: 47.7 (prev.: 47.6);
- Manufacturing sector: 51.8 (prev.: 52.2);
- S&P Global Composite: 48.5 (prev.: 48.8).
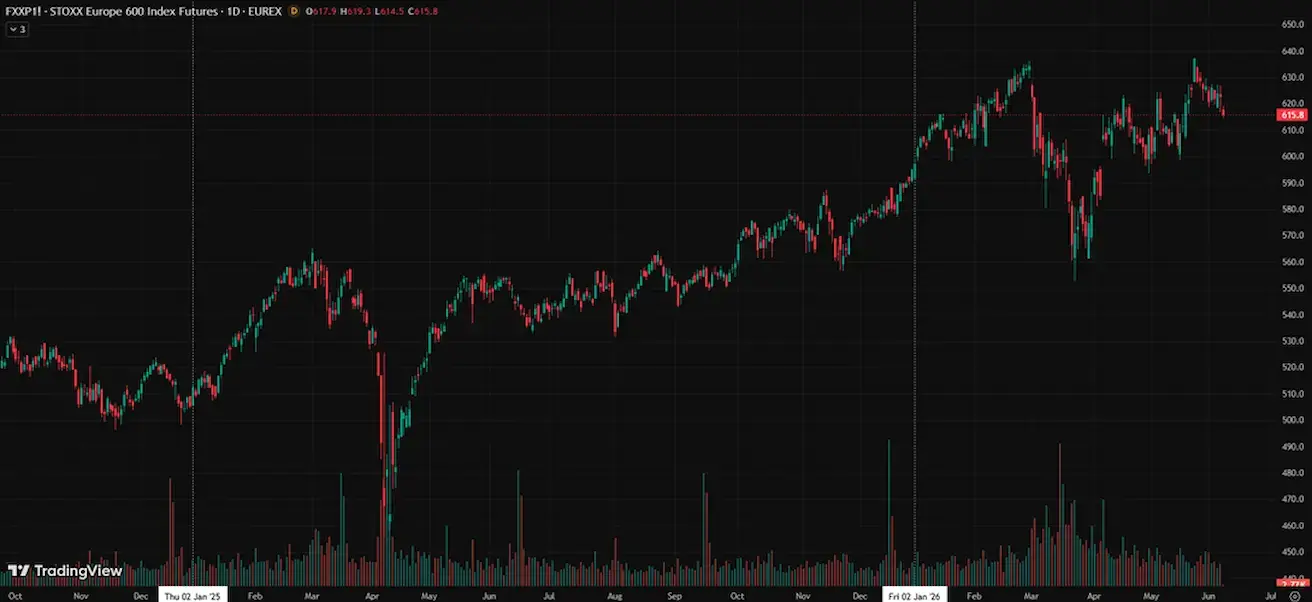
EURO STOXX 600 (FXXP1!)
Weekly performance: -1,72% (week-end close: 615,9); year-to-date: 3,69%.
China
The economy is stabilizing on the back of exports, while domestic demand and investment are gradually recovering; policy stimulus remains targeted and cautious.
- Interest rates remain unchanged;
- The monetary policy stance remains accommodative;
China reaffirmed its commitment to fiscal support for economic growth under its 2026 economic plan, including measures to stimulate domestic demand, optimize tax incentives and subsidies, and modernize industry.
Interest Rates:
- 1-Year Loan Prime Rate (medium-term lending rate): 3.00%;
- 5-Year Loan Prime Rate (benchmark rate influencing mortgage lending): 3.50%.
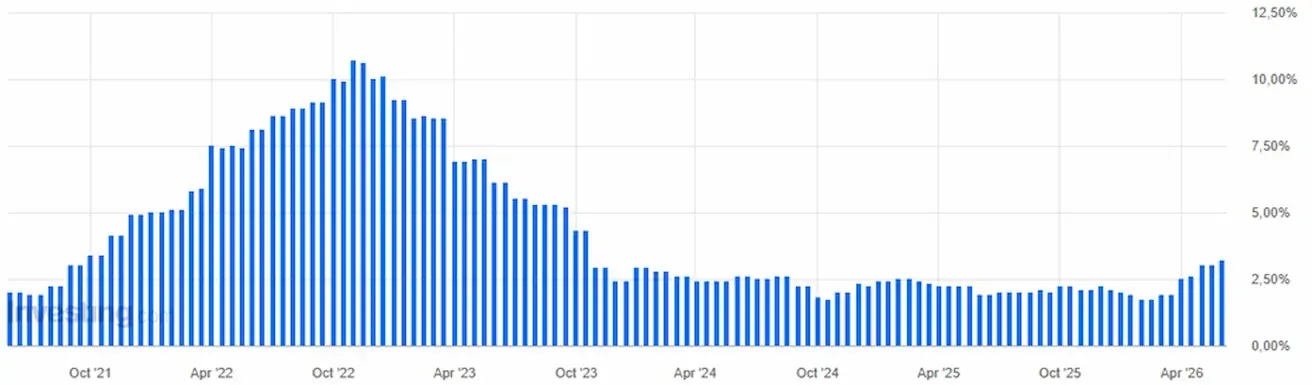
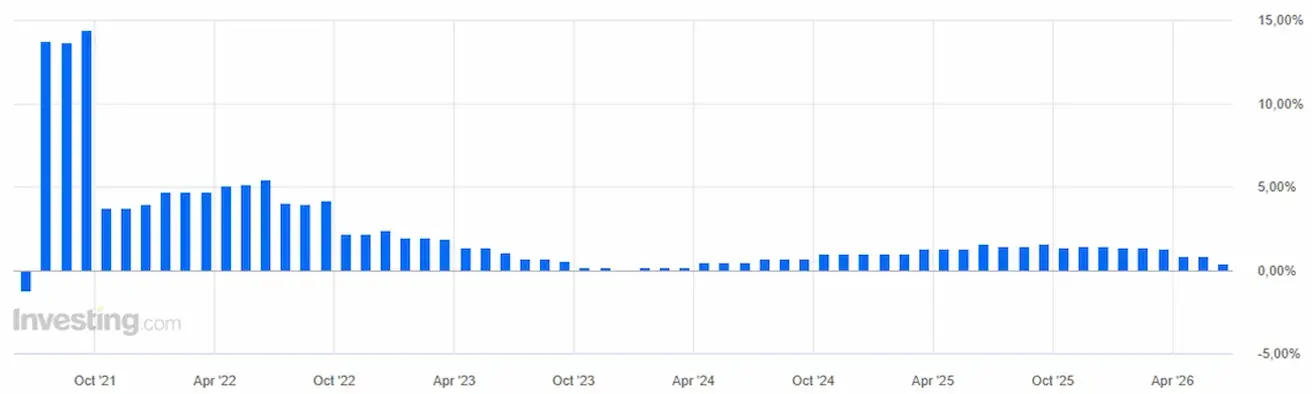
Inflation Indicators (April):
- Consumer Price Index (CPI): (MoM) +0.3% (prev.: -0.7%); (YoY) 1.2% (prev.: 1.0%);
- Producer Price Index (PPI): (YoY) +2.8% (prev.: -0.5%).
GDP (Q1 2026):
-
(QoQ) 1.3% (prev.: 1.2%);
-
(YoY) 5.0% (prev.: 4.5%).
-
Unemployment rate (April): 5.2% (prev.: 5.4%).
-
Industrial production (April, YTD YoY): 5.6% (prev.: 6.1%).
-
Fixed asset investment (April, YoY): -1.6% (prev.: 1.7%).
-
Retail sales (April, YoY): 0.9% (prev.: 1.3%).
-
Imports (April, YoY): 25.3% (prev.: 27.8%);
-
Exports (April, YoY): 14.1% (prev.: 2.5%).
-
Trade balance (April, USD, YoY): $84.80 billion (prev.: $51.13 billion).
Purchasing Managers’ Indices (PMI) (May):
- Manufacturing PMI: 50.0 (prev.: 50.3);
- Non-Manufacturing PMI: 50.1 (prev.: 49.4);
- Composite PMI: 50.5 (prev.: 50.1).
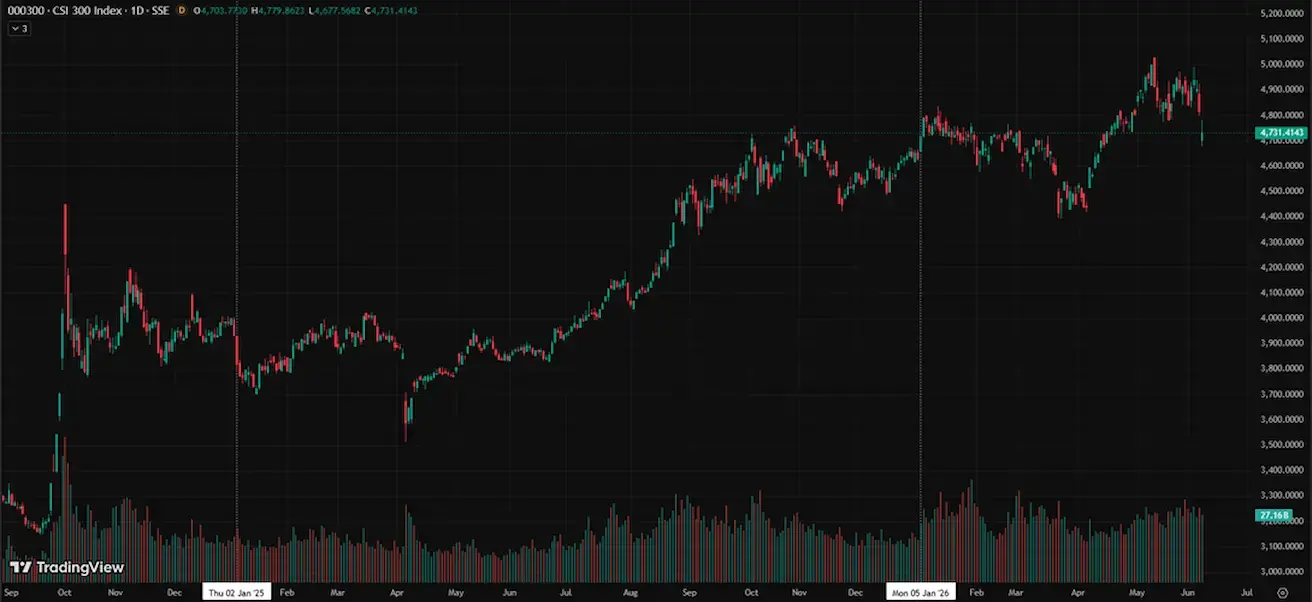
CSI 300 INDEX (000300.HK)
Weekly performance: -3,30% (week-end close: 4730,78); year-to-date: 1,48%.
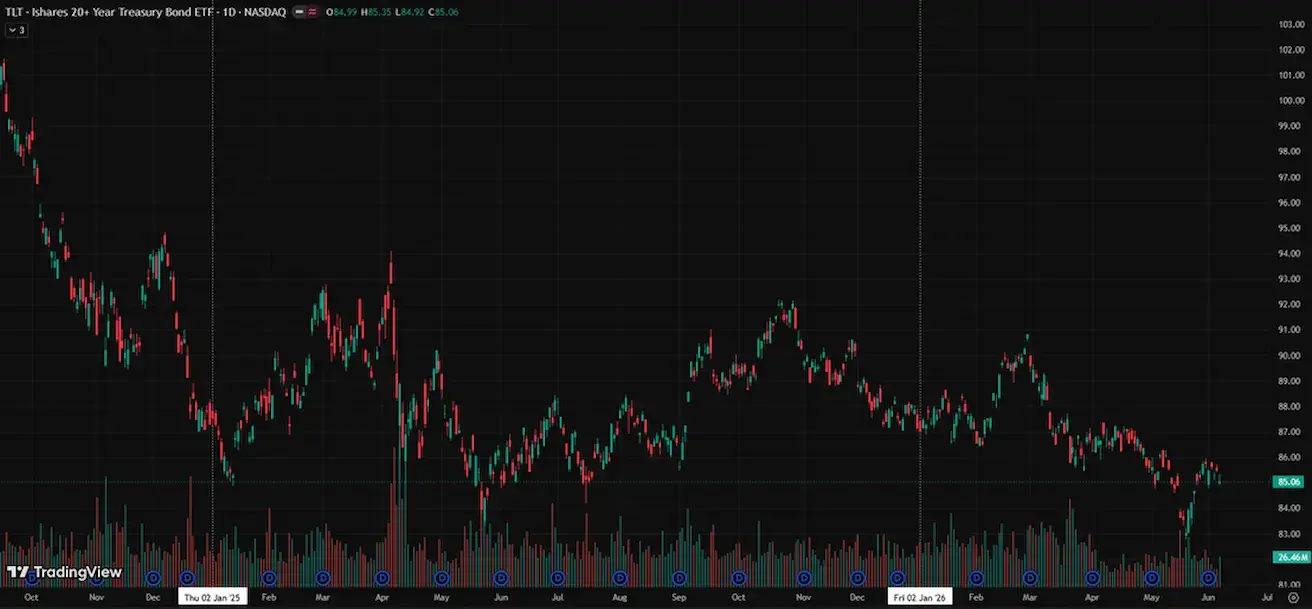
BOND MARKET
- U.S. Fixed Income Market – Rising Yields
- U.S. Treasury Bonds 20+ Years (TLT ETF): -0.82% for the week (weekly close: 85.06); -2.41% year-to-date.
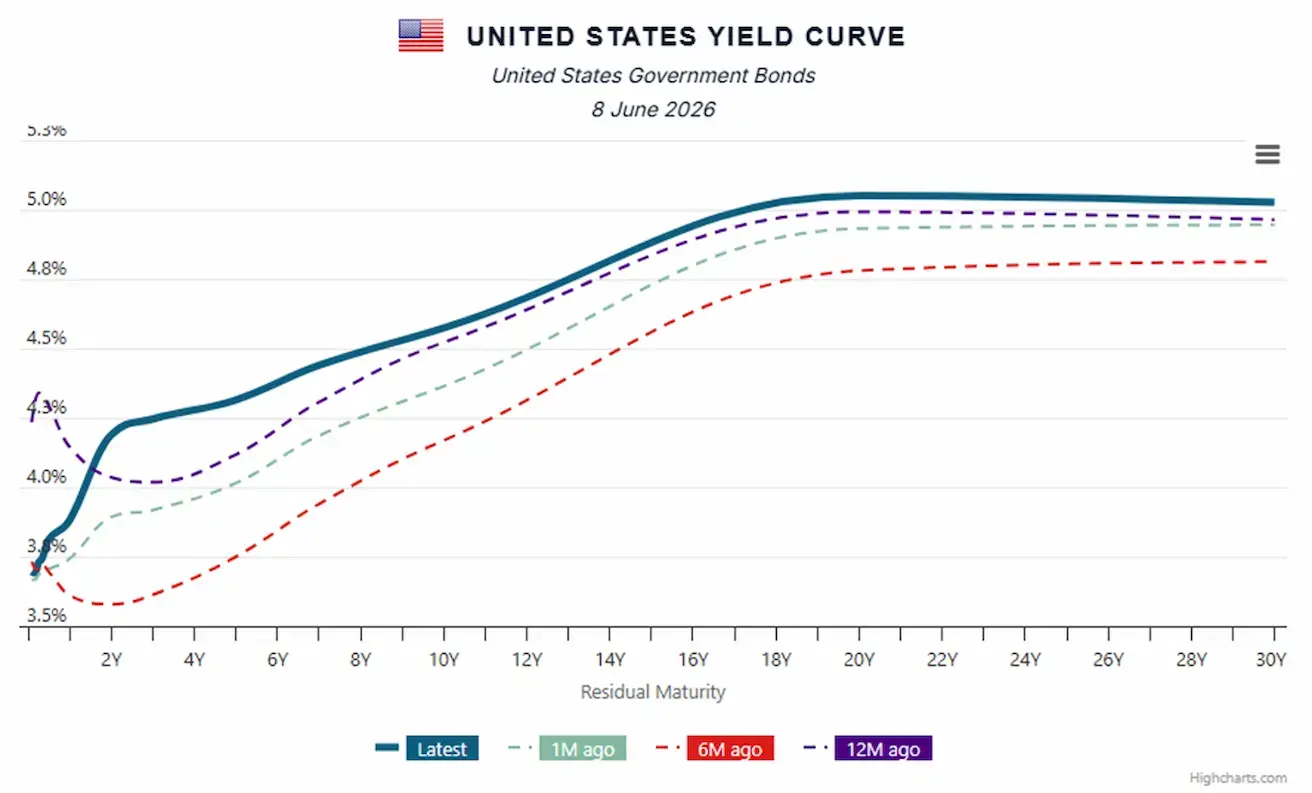
YIELDS AND SPREADS
- Market Yield on U.S. Treasury Securities at 10-Year Constant Maturity: 4.57% (prev.: 4.47%);
- Yield on 2-Year U.S. Treasury Notes: 4.19% (prev.: 4.03%);
- ICE BofA BBB U.S. Corporate Index Effective Yield: 5.34% (prev.: 5.30%).
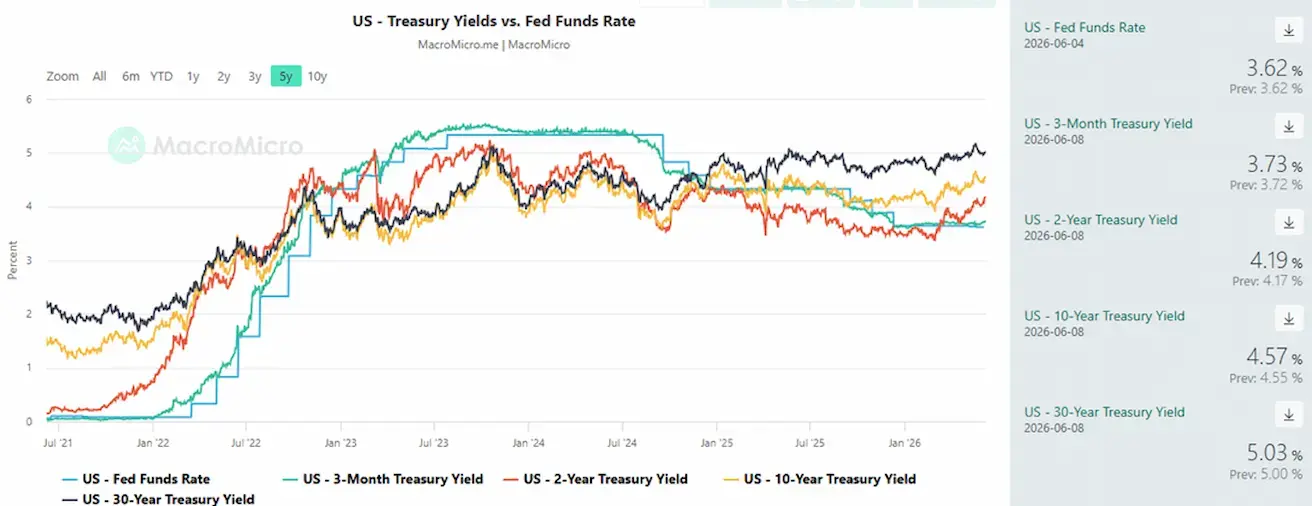
- The yield spread between 10-year and 2-year U.S. Treasury securities stands at 38 basis points (prev.: 44 bps);
- The yield spread between 10-year and 3-month U.S. Treasury securities stands at 84 basis points (prev.: 78 bps).
- The cost of a 5-year U.S. Credit Default Swap (CDS) — insurance against sovereign default — stands at 38.21 bps (vs. 38.20 bps last week).
U.S. Treasury yield curve:
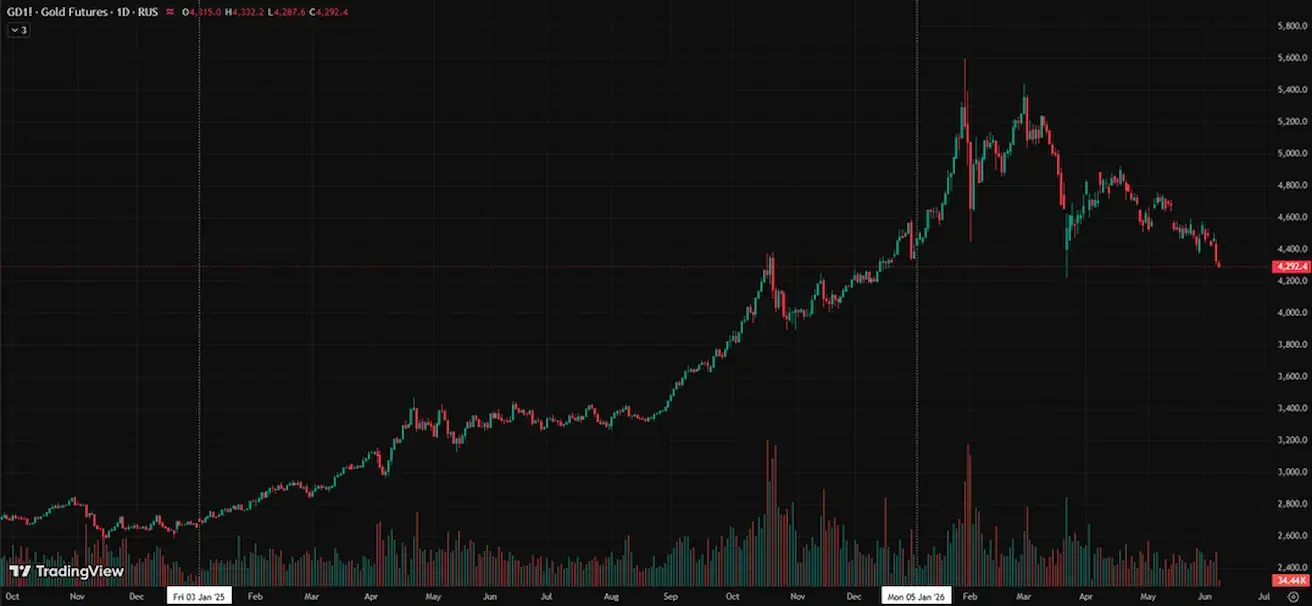
GOLD FUTURES (GC)
Weekly performance: -5,73% (week close: $4291 per troy oz); year-to-date: -0,95%
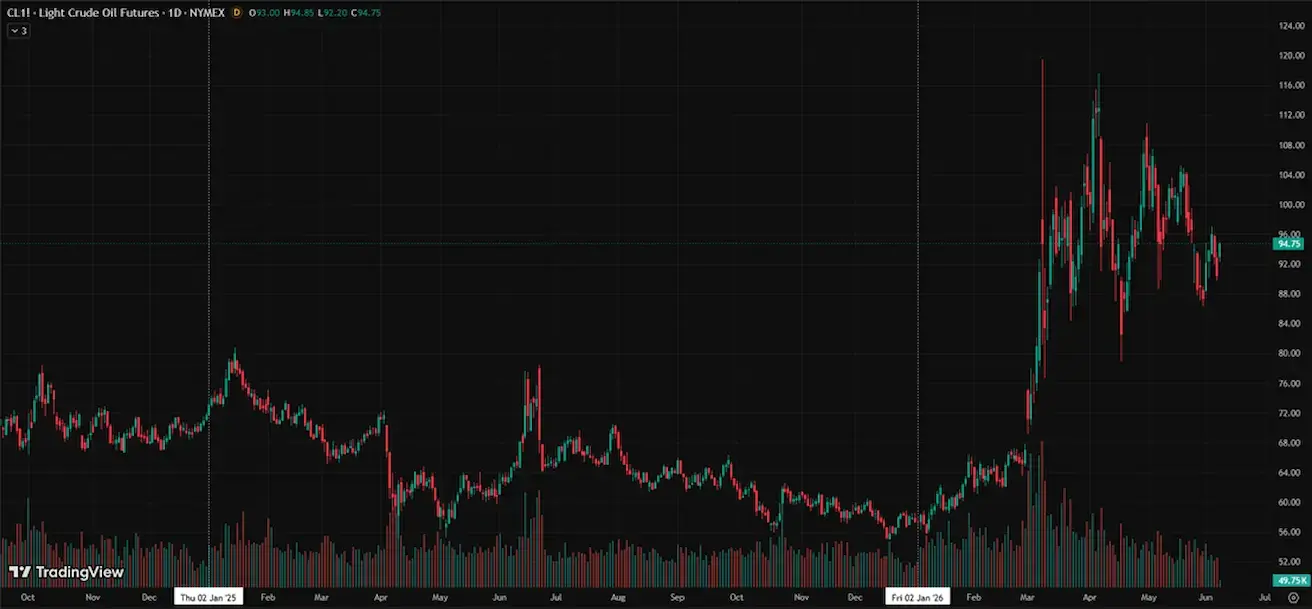
OIL FUTURES
Weekly performance: +3,64% (week close: $90,54 per barrel); year-to-date: +57,71%
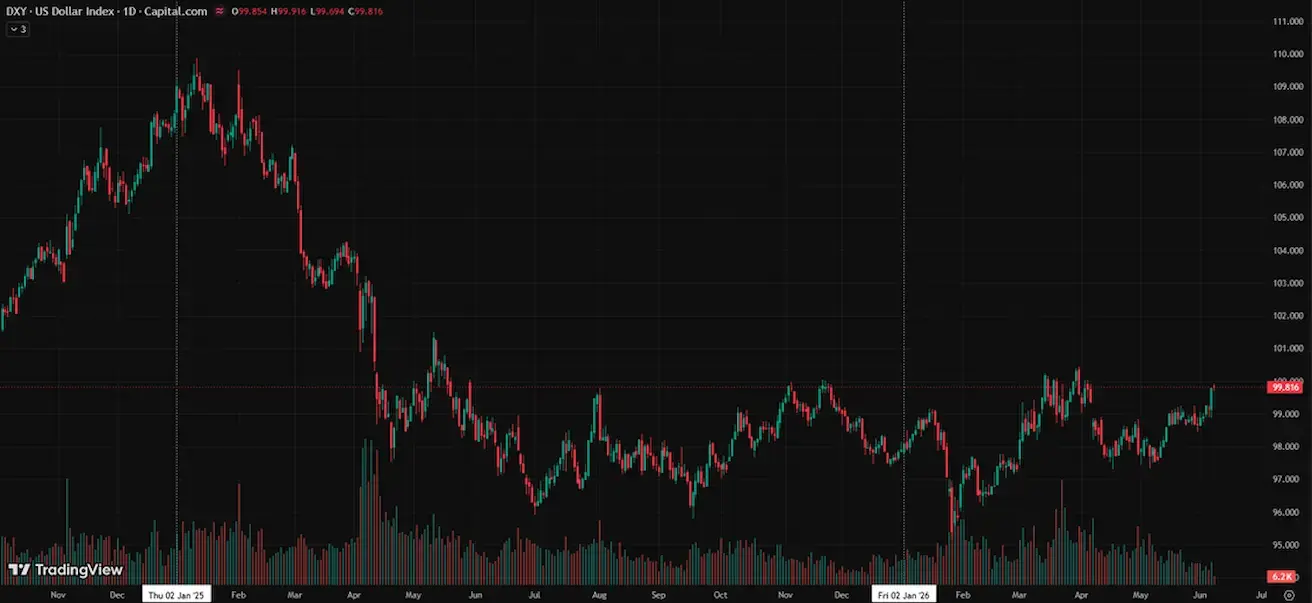
DOLLAR INDEX FUTURES (DX)
Weekly performance: +1,13% (week close: 99,785); year-to-date: +1,83%.
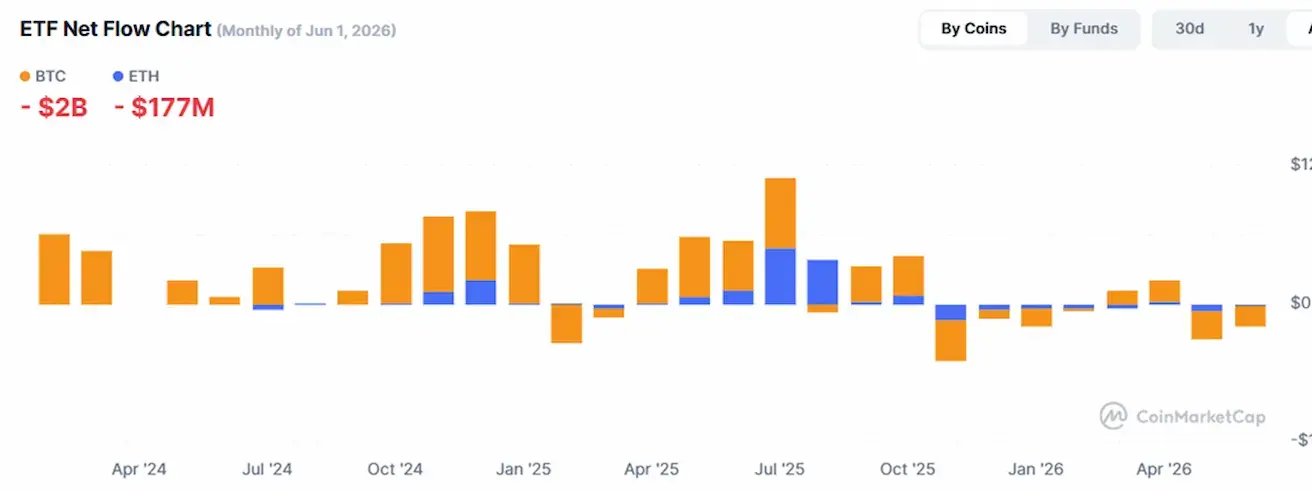
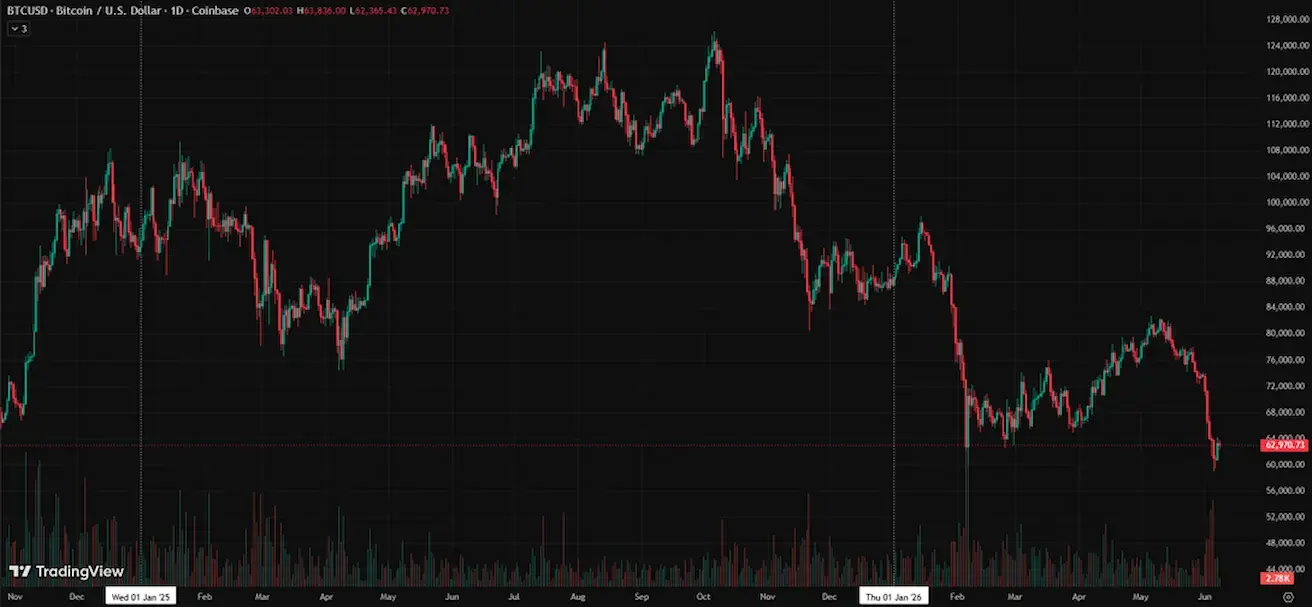
BTC FUTURES
Weekly performance: -13,95 (week close: $63302,7); year-to-date: -27,84%.
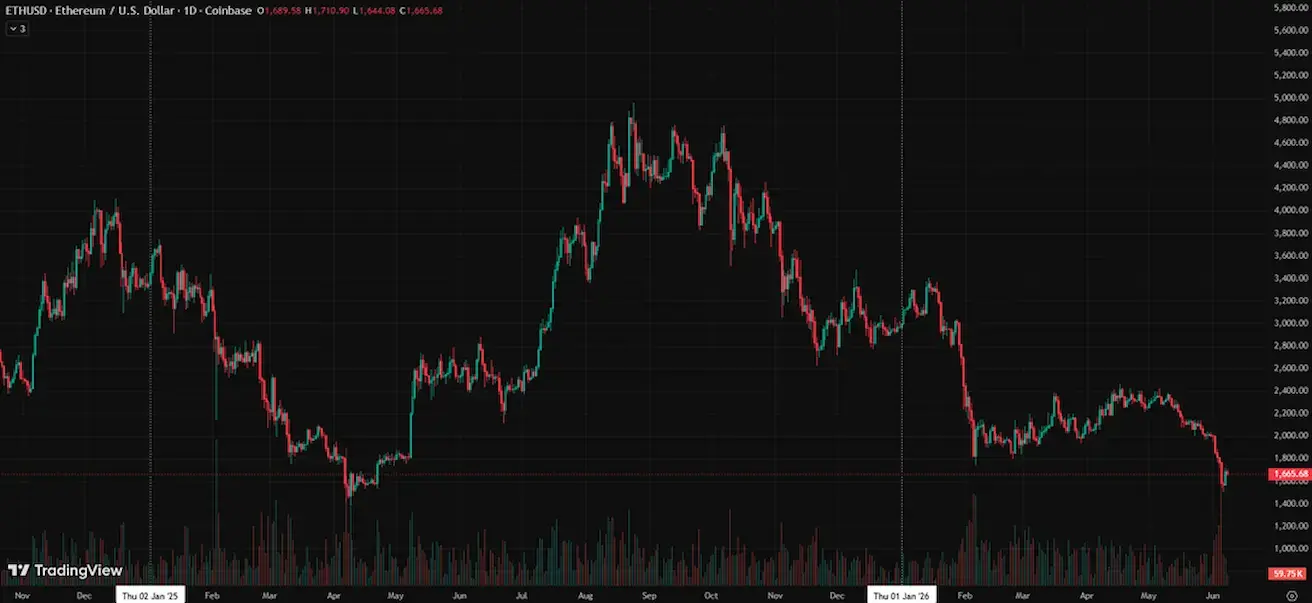
ETH FUTURES
Weekly performance: -15,68% (week close: $1689,75); year-to-date: -43,18%.
TOTAL CRYPTOCURRENCY MARKET CAPITALIZATION
Total crypto market capitalization: $2,1 trillion (vs $2,4 trillion a week earlier) (coinmarketcap.com).
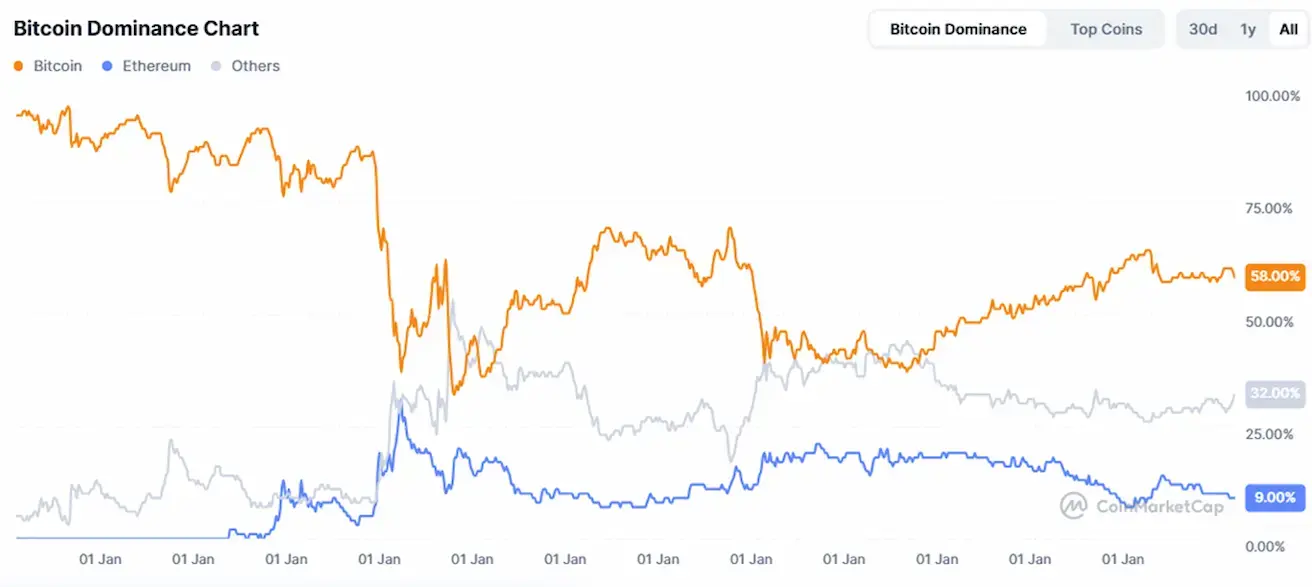
Crypto asset market shares:
- Bitcoin 58,4% (prev. (59,1%)
- Ethereum 9,3% (prev. 9,70%)
- Others 32,4% (prev. 31,2%)
ETF Net Flows Chart: