Lietuvių
 Русский
 Қазақша
 Eesti
EestiMay 24 – 31, 2026: Weekly economic update
Key market updates

Key takeaways:
- The rate remains unchanged, with cautious rhetoric;
- Monetary policy remains moderately restrictive;
- U.S. macroeconomic data continue to support the soft-landing scenario; inflation risks are rising, and the labor market is cooling without signs of a recession, but this does not yet warrant a rate cut.
Macroeconomic Statistics
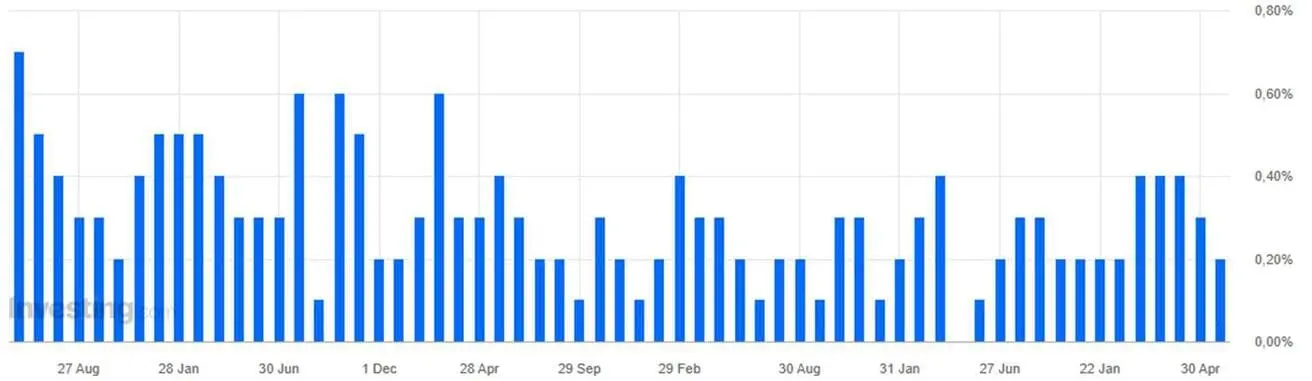
INFLATION: CONSUMER PRICE INDEX (APRIL):
- Core CPI: (MoM) 0.4% (prev: 0.2%); (YoY) 2.8% (prev: 2.6%).
- CPI: (MoM) 0.6% (prev: 0.9%); (YoY) 3.8% (prev: 3.3%).
PRODUCER PRICE INDEX (APRIL):
- PPI (m/m): 1.4%, prev: 0.7% revised.
- Core PPI (m/m): 1.0%, prev: 0.2% revised:
INFLATION EXPECTATIONS (MICHIGAN) (MAY):
- 12-month inflation expectations: 4.8% (prev: 4.7%);
- 5-year inflation expectations: 3.9% (prev: 3.5%).
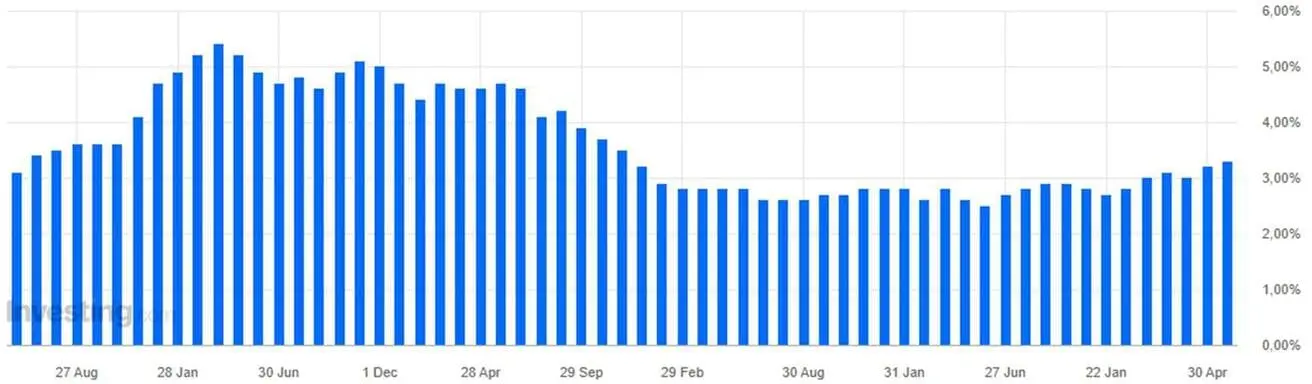
Fed's Inflation Target — Core Personal Consumption Expenditures Price Index (April):
MoM: 0.2%; forecast 0.3%; prev 0.3%:
YoY: 3.3%; forecast 3.3%; prev 3.2%:
GDP (U.S. Bureau of Economic Analysis, BEA) (Q1 2025, annualized, advance estimate): +2.0% (Q4 2025: +0.5%); forecast: 2,0%.
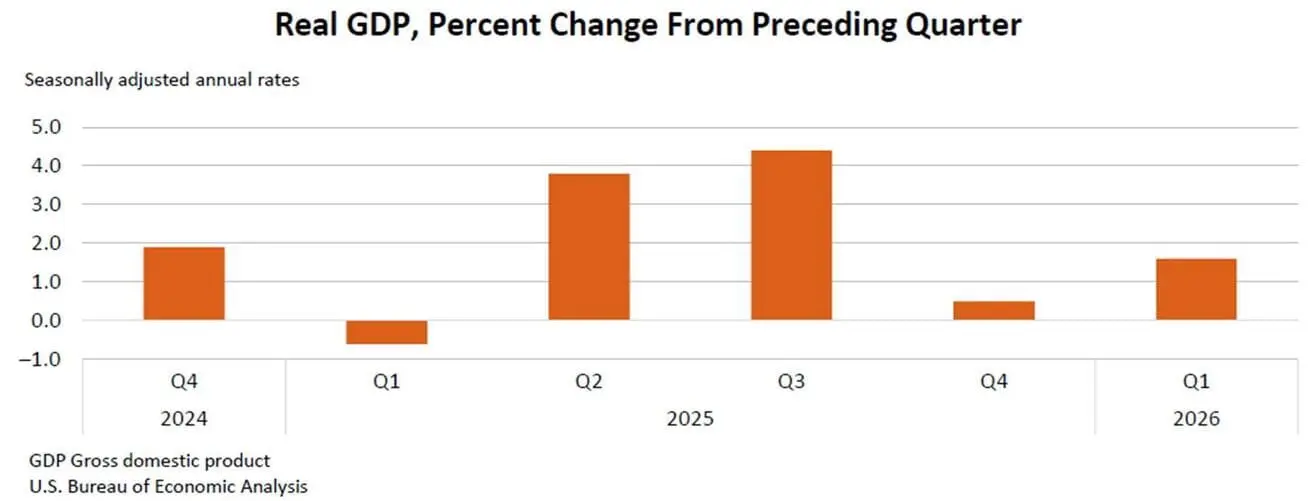
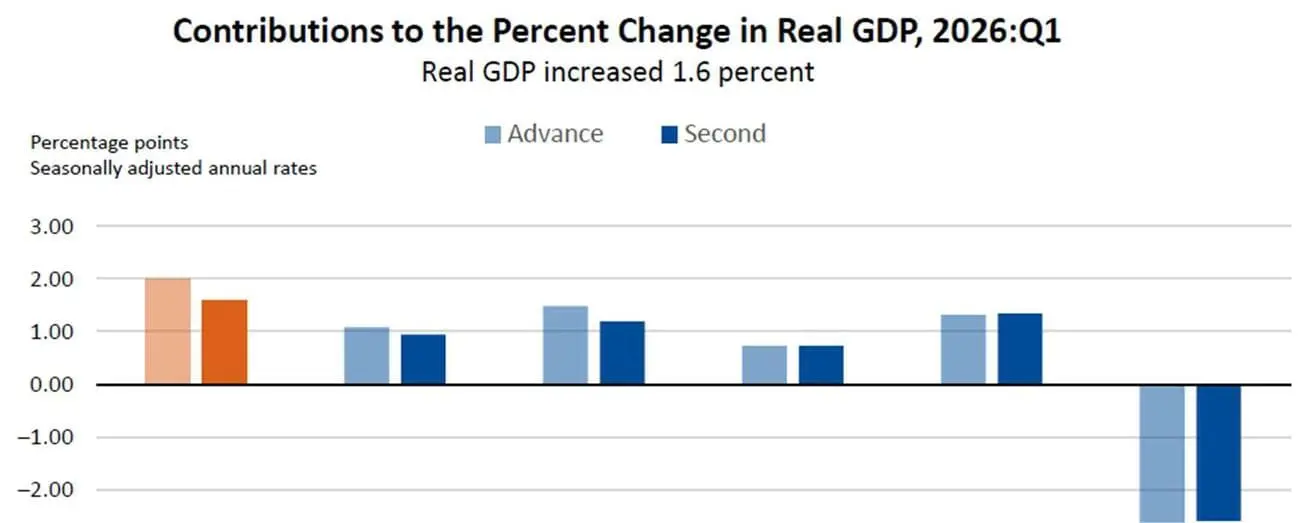
According to the second estimate published by the U.S. Bureau of Economic Analysis, real GDP in Q1 2026 (January, February, and March) grew at an annualized rate of 1.6%, following growth of 0.5% in Q4 2025.
Exports, investment, consumer spending, and government expenditures all contributed positively to real GDP growth in the first quarter. Imports, which are subtracted from the GDP calculation, increased.
The real GDP figure was revised down 0.4% from the advance estimate, primarily reflecting lower projections for investment and consumer spending.
The Atlanta Fed’s GDPNow indicator (a “real-time” estimate of official GDP prior to its release): 3.8% (previous: 4.3%).
BUSINESS ACTIVITY INDEX (PMI) (MAY, PRELIMINARY DATA):
(Above 50 indicates expansion; below 50 indicates contraction)
- Services sector: 50.9 (prev: 51.0);
- Manufacturing sector: 55.3 (prev: 54.5);
- S&P Global Composite: 51.7 (prev: 51.7).
LABOR MARKET (BLS) (APRIL/MAY)
- Unemployment rate: 4.3% (prev: 4.3%);
- Total number of continuing jobless claims in the U.S.: 1,786K (prev: 1,762K);
- Initial jobless claims: 215K (prev: 209K);
- Change in nonfarm payroll employment: 109K (prev: 61K);
- Change in private nonfarm payroll employment: 186K (prev: -129K);
- Average hourly earnings (y/y): 3.6% (prev: 3.4%);
- JOLTS job openings: 6.866M (prev: 6.922M).
MONETARY POLICY
Fed Board rhetoric is shifting toward tightening.
-
Waller: Holds the most hawkish position. Rather than cutting, he is open to raising rates, as current inflation levels are firmly unacceptable to him.
-
Goolsbee: Issues direct warnings about the risks. Moving toward easing quickly appears dangerous at this stage, as it could trigger a fresh round of inflation.
-
Barr: Calls for caution and a pause. He sees external pro-inflationary risks (oil price shock) and recommends not rushing any rate cut until incoming economic data can be properly assessed.
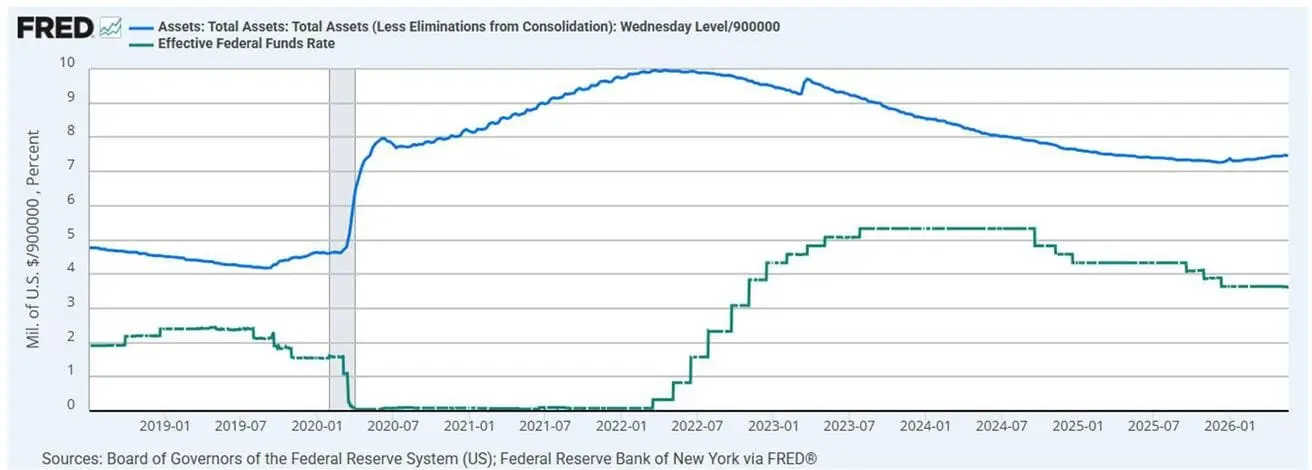
Effective Federal Funds Rate (EFFR): 3.50%–3.75%;
Federal Reserve balance sheet: $6.704 trillion; up 2.59% since the suspension of QT ($6.535 trillion).
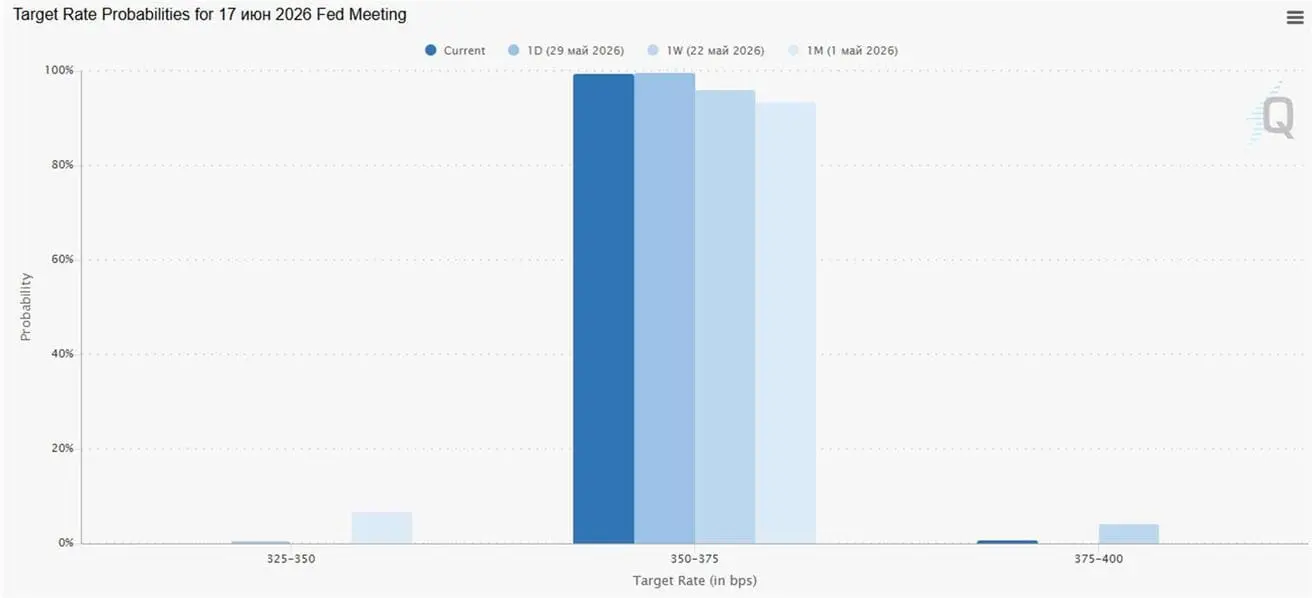
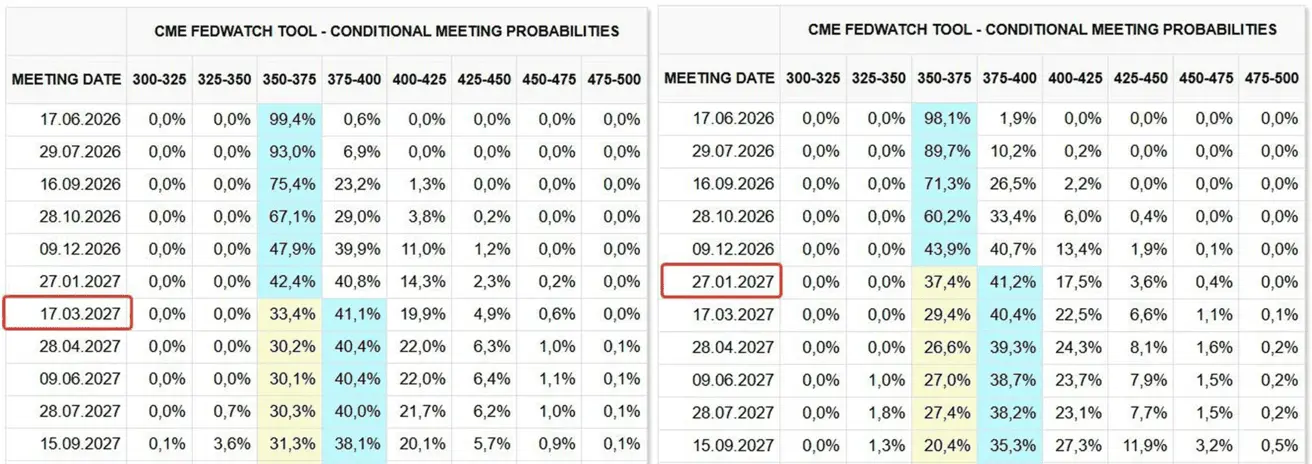
MARKET FORECAST FOR RATE (FEDWATCH)
At the next meeting (June 17), the estimated probability of the rate remaining unchanged stands at 99.41%.
Over the next 12 months, expectations for a 25 bps rate hike have shifted from January 2027 to March 2027, targeting the 3.75–4.00% range.
Today and a week earlier:
Market
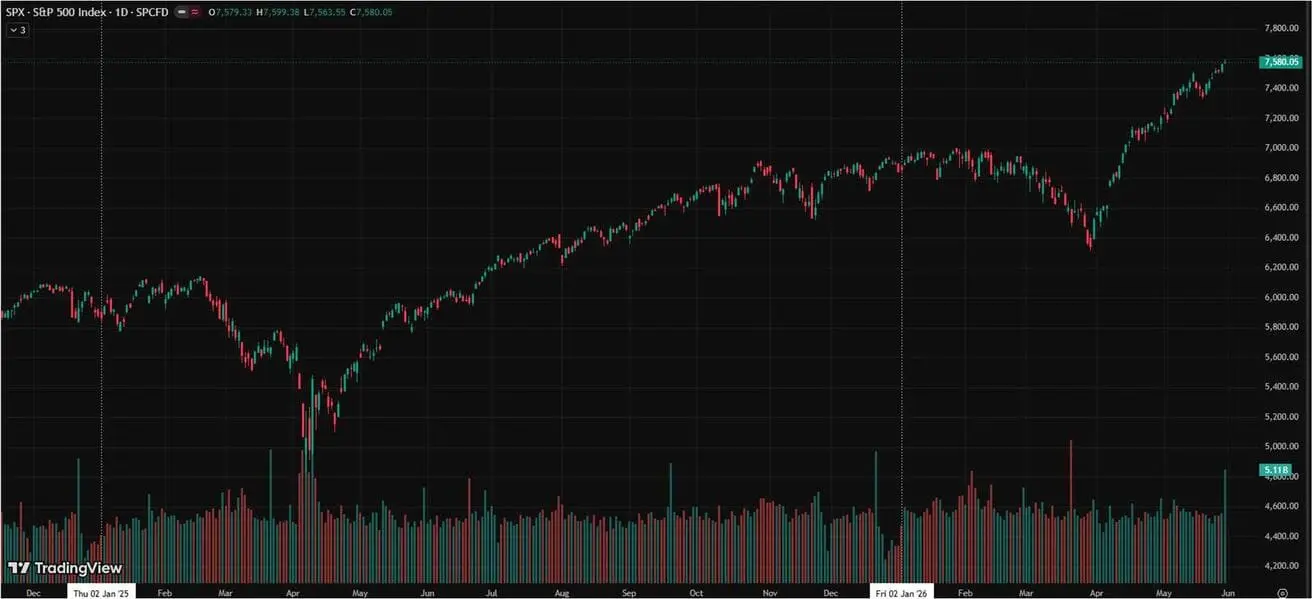
SP500
Weekly performance: +1.43% (week-end close: 7,580.05); year-to-date: +10.73%.
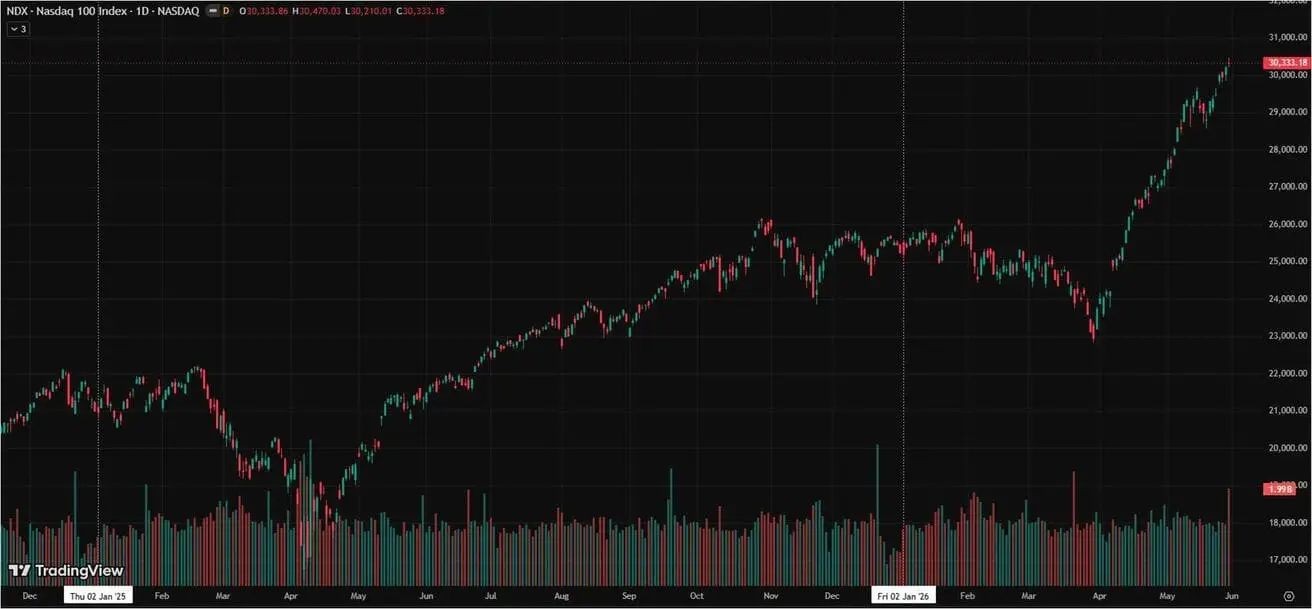
NASDAQ100
Weekly performance: +2.89% (week-end close: 30,333.18); year-to-date: +20.13%.
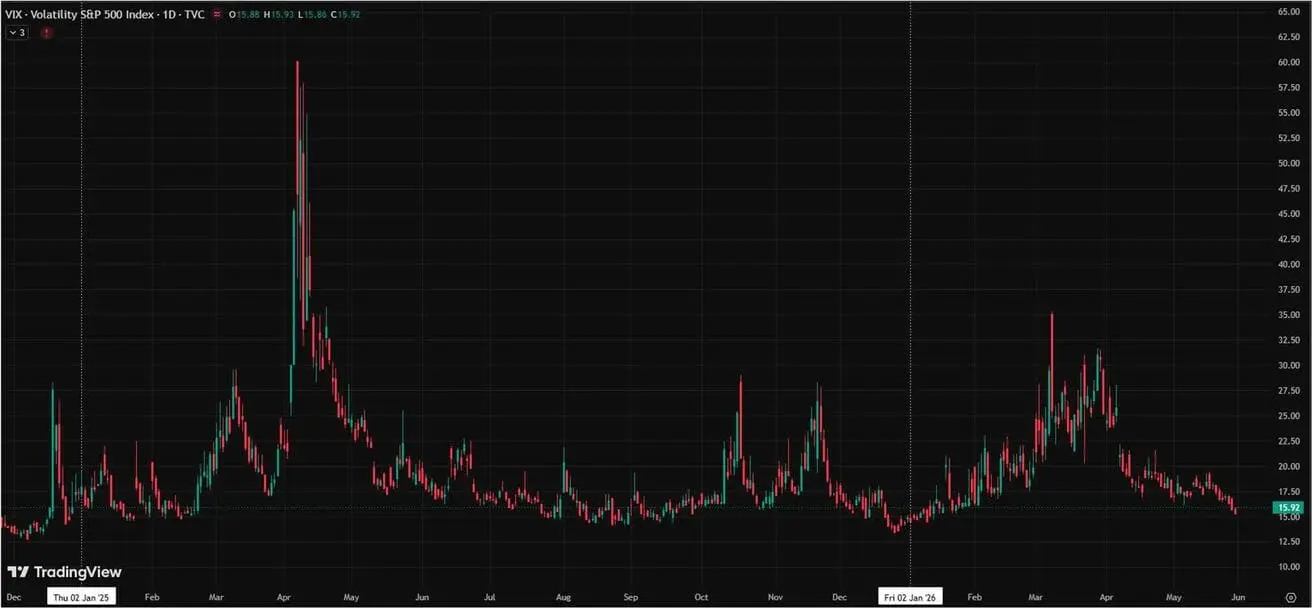
VIX
VIX (volatility index): week closing at 15.92 points.
Goldman Sachs raised its year-end 2026 S&P 500 target to 8,000 from 7,600.
Selection of corporate earnings reports from last week:
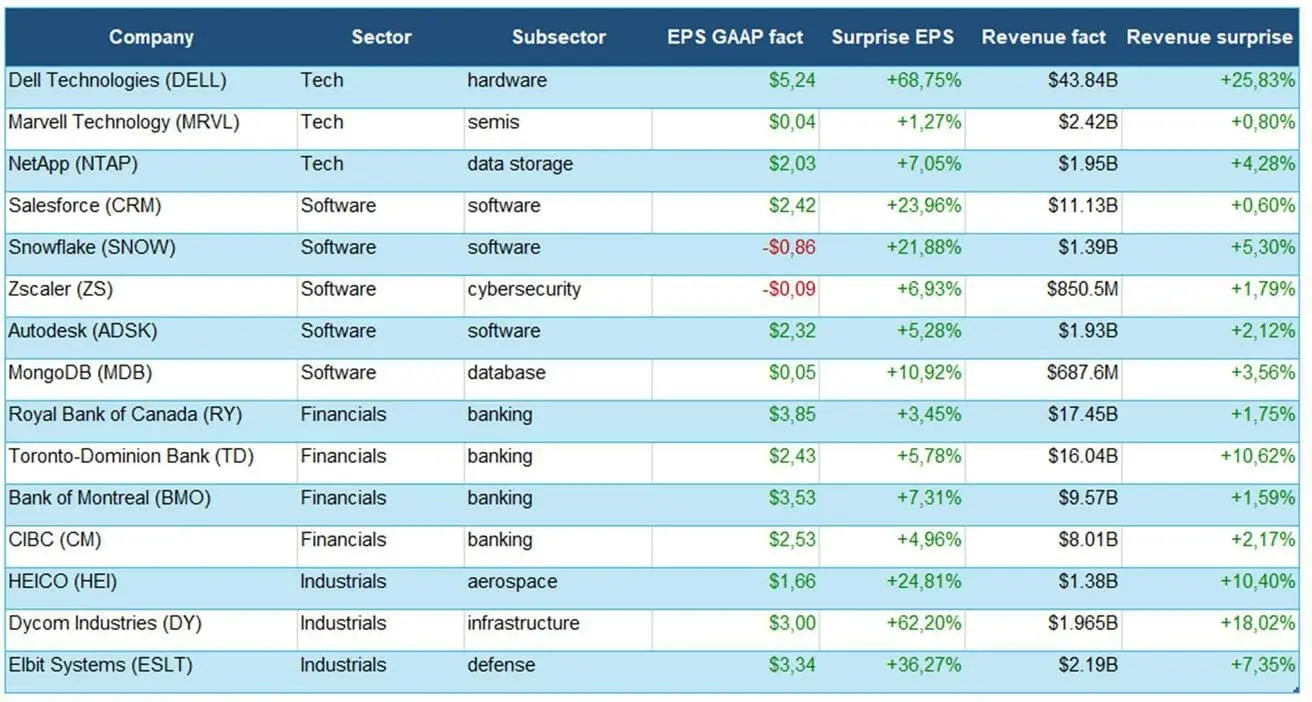
The technology sector was the strongest performer: Dell and NetApp delivered notable beats, while Marvell confirmed sustained demand for semiconductors, though the surprise was moderate.
The software sector navigated earnings season confidently: Salesforce, Snowflake, Zscaler, Autodesk, and MongoDB broadly exceeded forecasts, pointing to resilient corporate demand.
The financial sector posted calm but quality results: major Canadian banks outperformed on both profit and revenue, with no sharp deterioration signals.
The industrial sector was the most dynamic: HEICO, Dycom, and Elbit strongly beat forecasts, reflecting robust demand across aerospace, defense, and infrastructure.
Overall, the earnings season came in above expectations among large-cap companies with high, durable margins.
Eurozone
- Rates remain unchanged for now, but inflation risks are rising;
- Monetary policy remains neutral, though the balance of risks has shifted toward inflation;
- As the conflict in the Middle East escalated, the ECB revised its GDP forecasts downward and raised its inflation outlook for the coming years.
Key takeaways from the ECB Governing Council monetary policy meeting minutes dated May 28, 2026:
- The hawkish camp has visibly strengthened within the ECB — some members stated they were prepared to support a rate hike as early as the April meeting had it been put to a vote.
- The primary risk for the ECB is secondary inflationary effects: the regulator fears that rising energy costs will gradually pass through to goods, services, and wages.
- Markets are increasingly pricing in summer rate hikes. The ECB is signaling that controlling inflation and maintaining credibility around the 2% target is now the priority, even at the cost of weaker economic growth.
Interest rates
- Deposit facility rate: 2.0% (prev. 2.0%);
- Marginal lending facility rate: 2.4% (prev. 2.4%) — the rate at which banks can borrow overnight funds from the regulator;
- Main refinancing (policy) rate: 2.15% (prev. 2.15%).
Inflation: Consumer Price Index (CPI) (April, preliminary data):
- Core CPI (YoY): 2.2% (prev. 2.3%);
- CPI (MoM): 1.0% (prev. 1.3%); (YoY): 3.0% (prev. 2.6%).
GDP for Q1 (preliminary):
- QoQ: 0.1% (prev. revised 0.2%);
- YoY: 0.8% (prev. 1.2%).
Unemployment rate (March): 6.3% (prev. 6.2%).
Industrial production (MoM) (February): 0.4% (prev. -0.8%).
Purchasing Managers’ Index (PMI) (April): remained in expansion territory, though momentum slowed.
- Services sector: 46.4 (prev. 47.6);
- Manufacturing sector: 51.4 (prev. 52.2);
- S&P Global Composite: 47.5 (prev. 48.6).
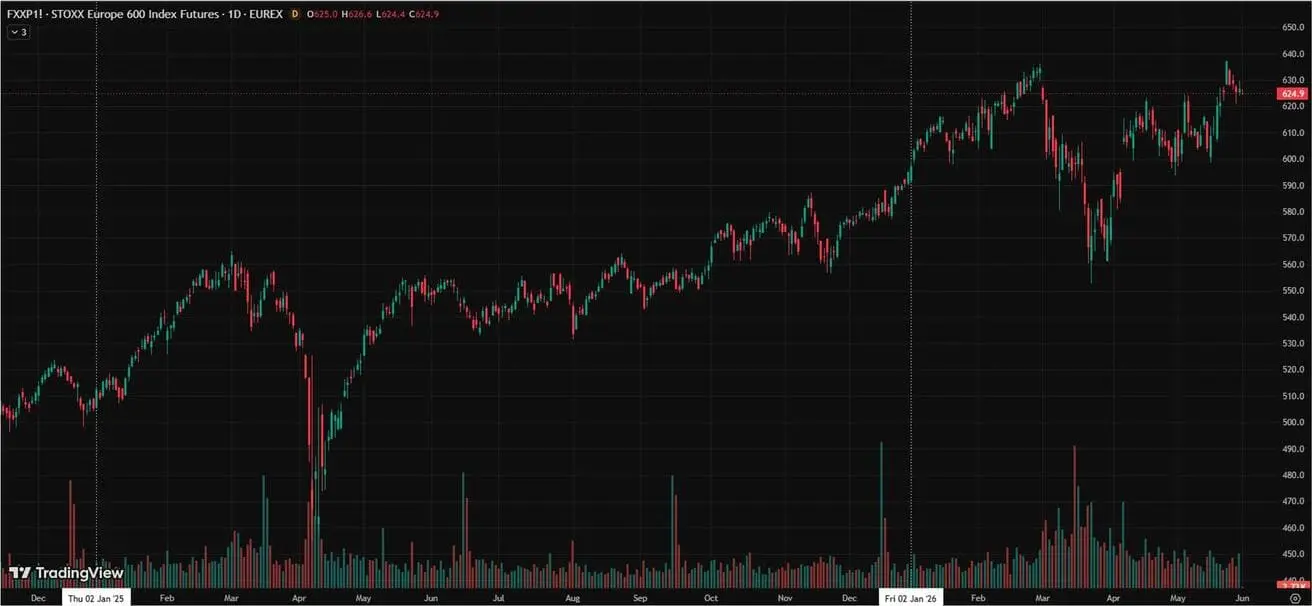
EURO STOXX 600 (FXXP1!)
Weekly performance: +0.19% (week-end close: 626.7); year-to-date: +5.51%.
China
The economy is stabilizing on the back of exports, while domestic demand and investment are gradually recovering; stimulus measures remain targeted and cautious.
- Rates remain unchanged;
- Monetary policy remains accommodative;
- China announced the continuation of fiscal support for economic growth under its 2026 plan, including measures to stimulate domestic demand, optimize tax incentives and subsidies, and modernize industry.
Interest rates:
- 1Y Loan Prime Rate (medium-term lending): 3.00%;
- 5Y Rate (five-year benchmark rate affecting mortgages): 3.50%.
Inflation indicators (April):
- Consumer Price Index (CPI): MoM +0.3% (prev. -0.7%); YoY 1.2% (prev. 1.0%);
- Producer Price Index (PPI): YoY +2.8% (prev. -0.5%).
GDP for Q1 2026:
- QoQ: 1.3% (prev. 1.2%);
- YoY: 5.0% (prev. 4.5%).
Unemployment rate (April): 5.2% (prev. 5.4%).
Industrial production (April, YTD YoY): 5.6% (prev. 6.1%).
Fixed asset investment (April, YoY): -1.6% (prev. 1.7%).
Retail sales (March, YoY): 0.9% (prev. 1.3%).
Imports volume (April, YoY): 25.3% (prev. 27.8%).
Exports volume (April, YoY): 14.1% (prev. 2.5%).
Trade balance (USD) (April, YoY): $84.80 billion (prev. $51.13 billion).
Purchasing Managers’ Indices (PMI) (March):
- Manufacturing sector: 50.0 (prev. 50.3);
- Non-manufacturing sector: 50.1 (prev. 49.4);
- Composite PMI: 50.5 (prev. 50.1).
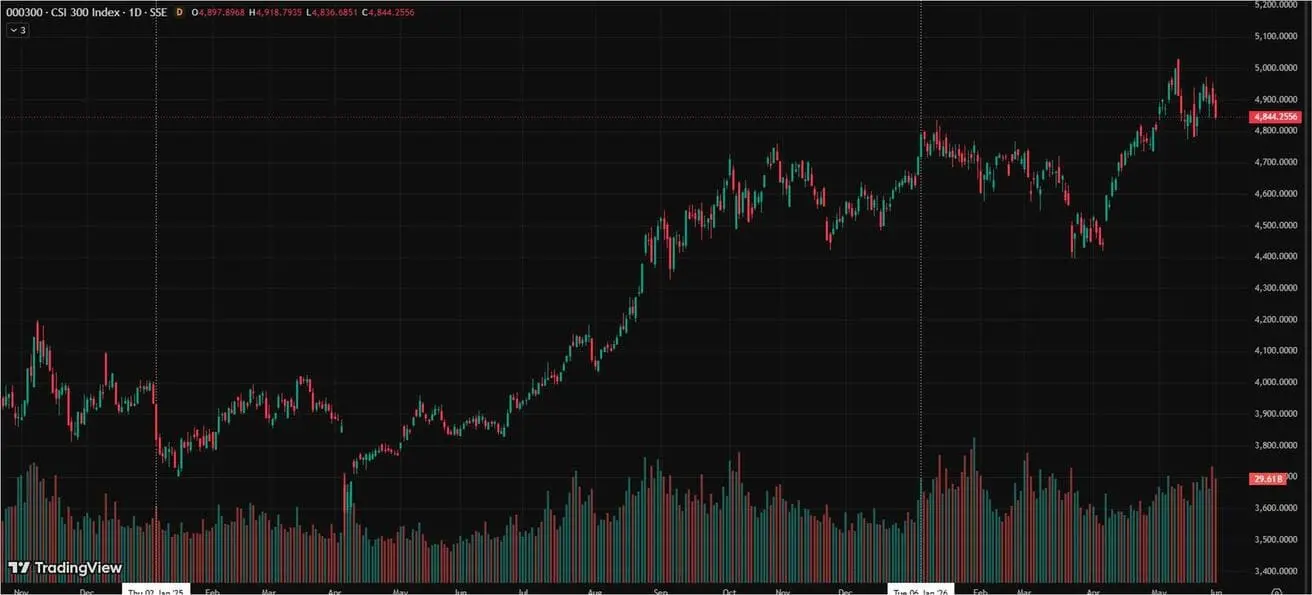
CSI 300 INDEX (000300.HK)
Weekly performance: +0.97% (week-end close: 4,892.12); year-to-date: +4.94%.
BOND MARKET
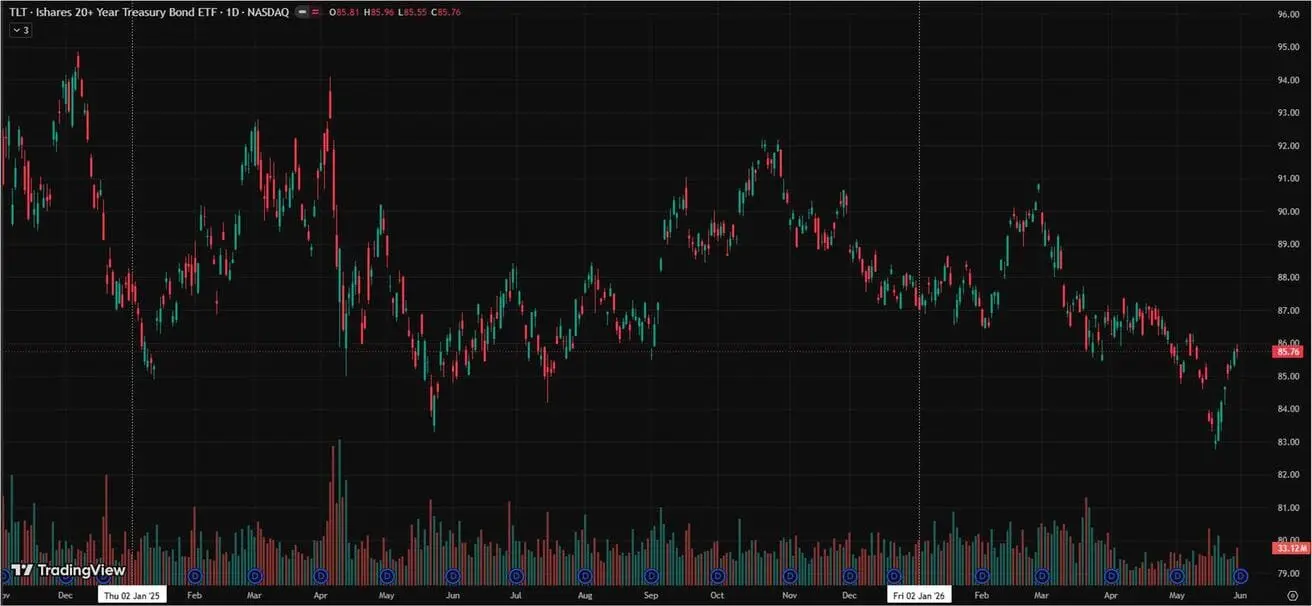
U.S. debt market — yields declining.
U.S. Treasuries 20+ (ETF TLT)
Weekly performance: +1.28% (week close: 85.76); year-to-date: –1.61%.
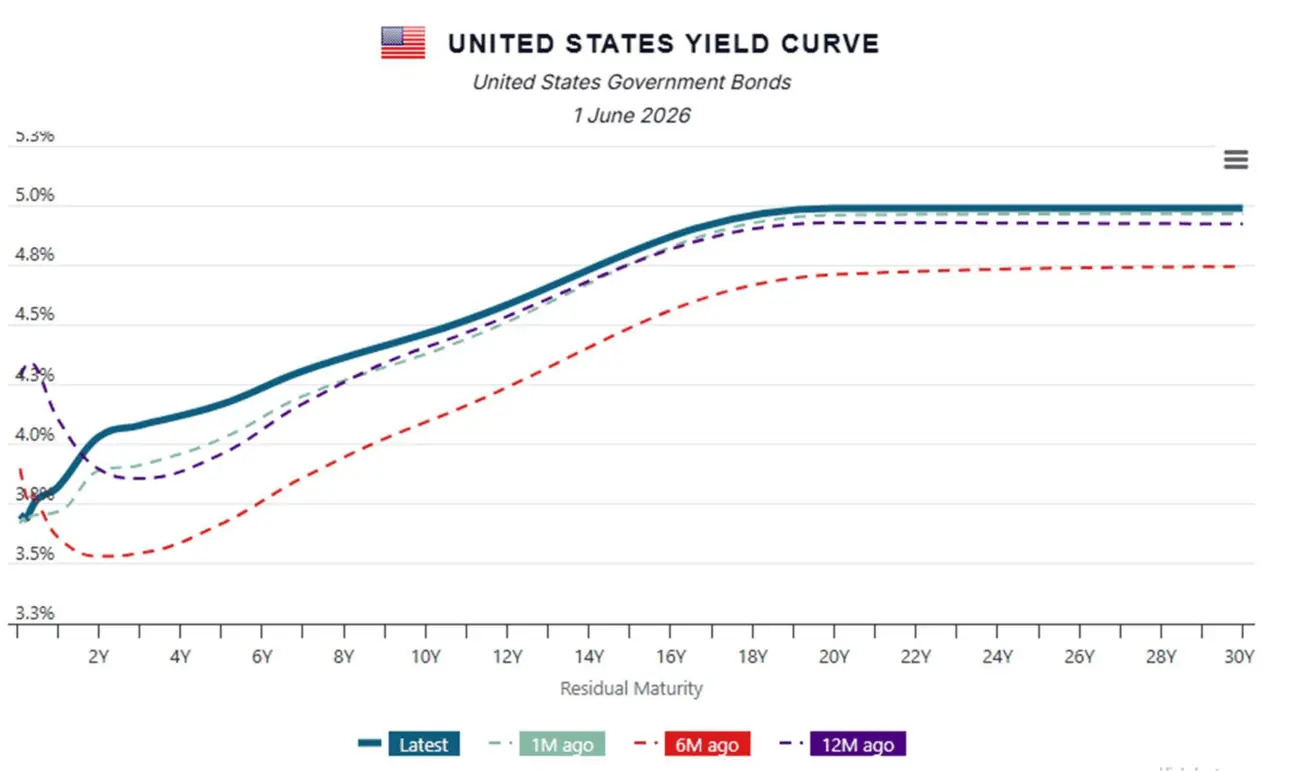
YIELDS AND SPREADS
Market Yield on U.S. Treasury Securities
- 10-Year Constant Maturity: 4.47% (prev. 4.49%);
- 2-year Treasury yield: 4.03% (prev. 4.13%);
ICE BofA BBB US Corporate Index Effective Yield: 5.30% (prev. 5.40%).
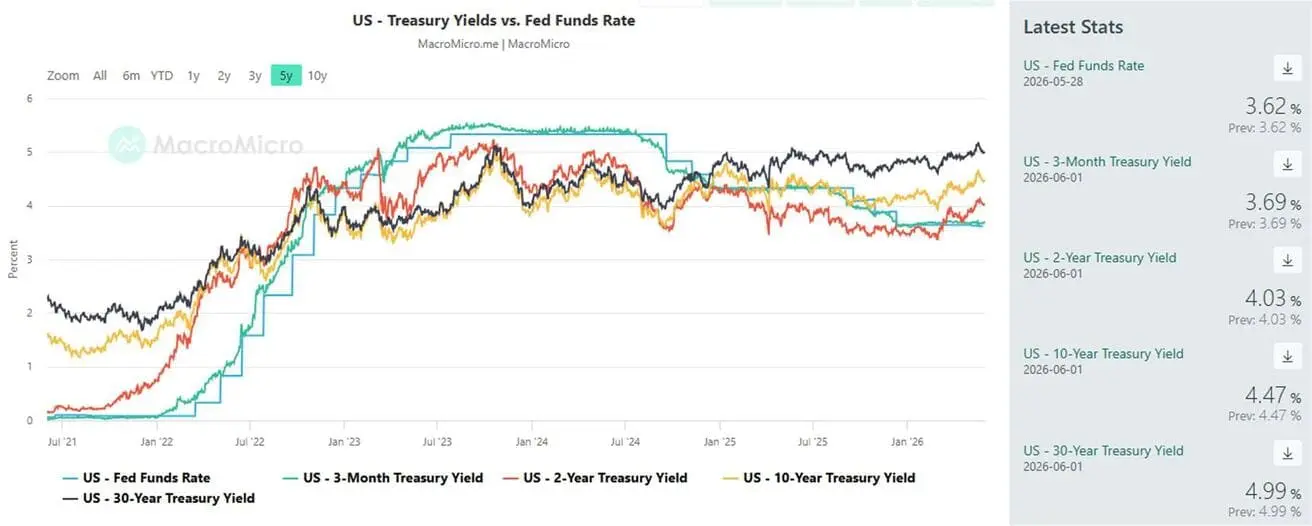
- The yield spread between 10-year and 2-year U.S. Treasury securities stands at 44 basis points (prev. 36);
- The yield spread between 10-year and 3-month U.S. Treasury securities stands at 78 basis points (prev. 82).
The cost of 5-year U.S. credit default swaps (CDS) — insurance against default — stands at 38.20 bps (vs. 37.74 bps last week).
U.S. Treasury yield curve:
GOLD FUTURES (GC)
Weekly performance: +0.77% (week close: $4,551.6 per troy oz); year-to-date: +5.07%
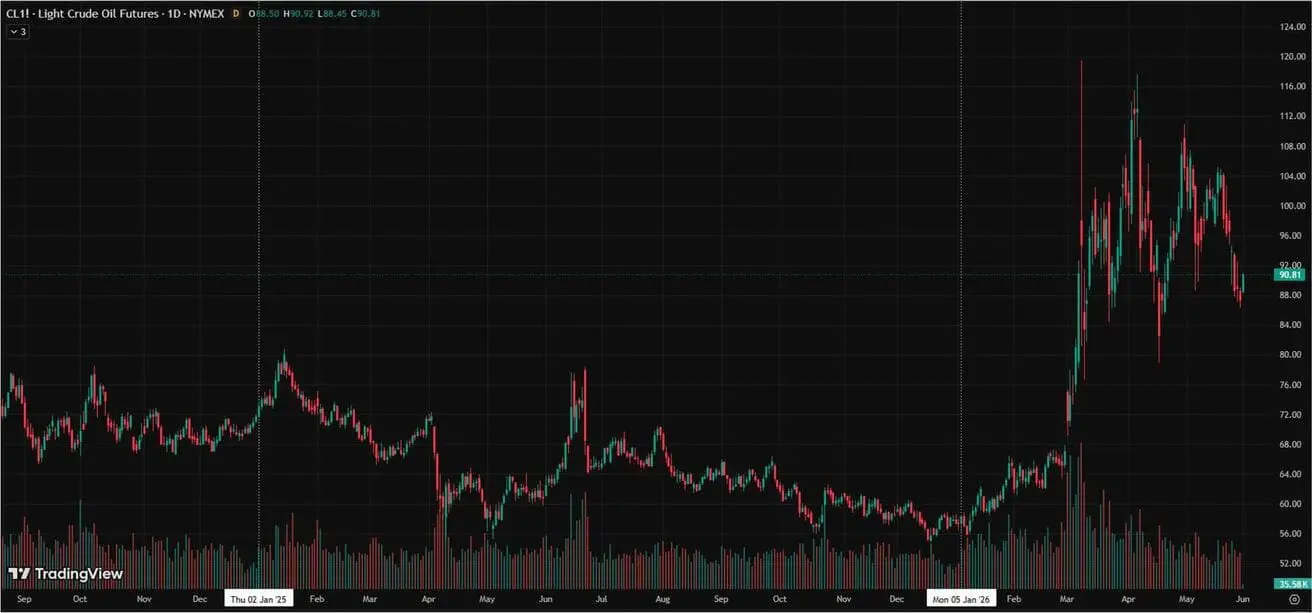
OIL FUTURES
Weekly performance: –9.57% (week close: $87.36 per barrel); year-to-date: +52.17%
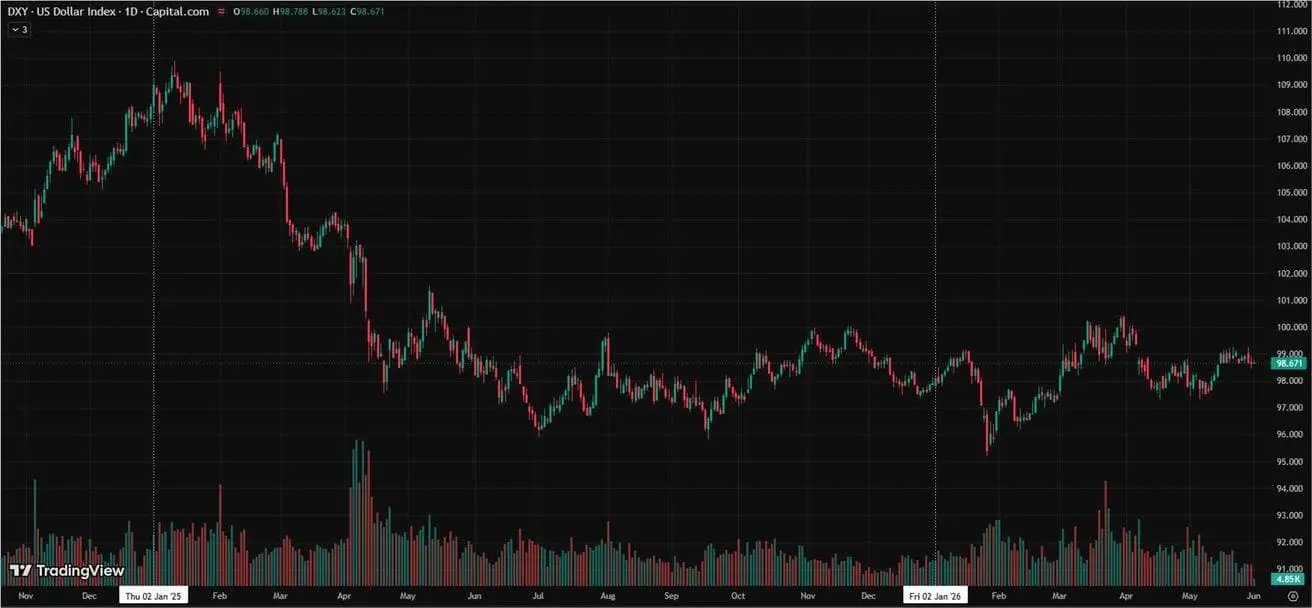
DOLLAR INDEX FUTURES (DX)
Weekly performance: –0.38% (week close: 98.668); year-to-date: +0.69%.
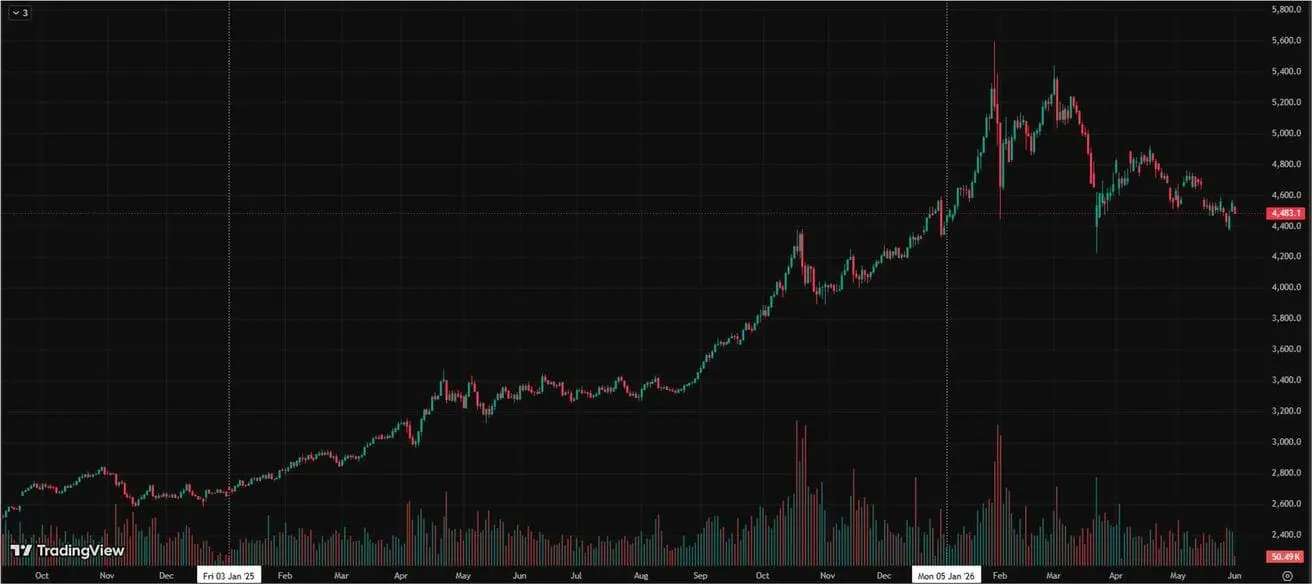
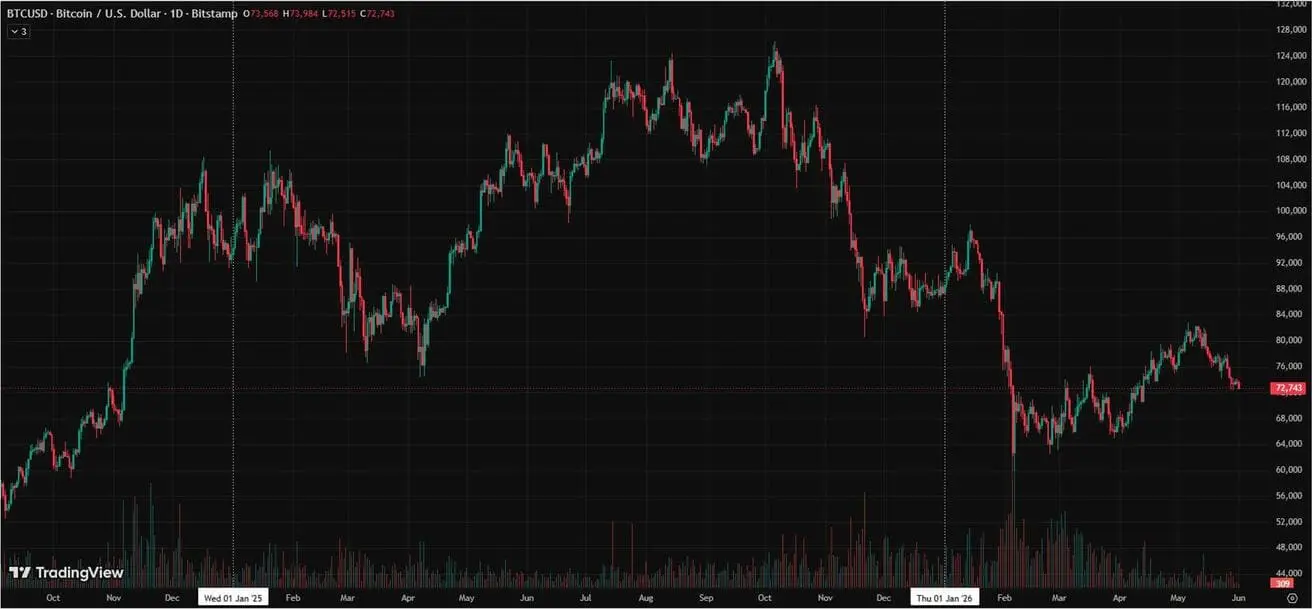
BTC FUTURES
Weekly performance: –4.43% (week close: $73,568); year-to-date: –16.13%.
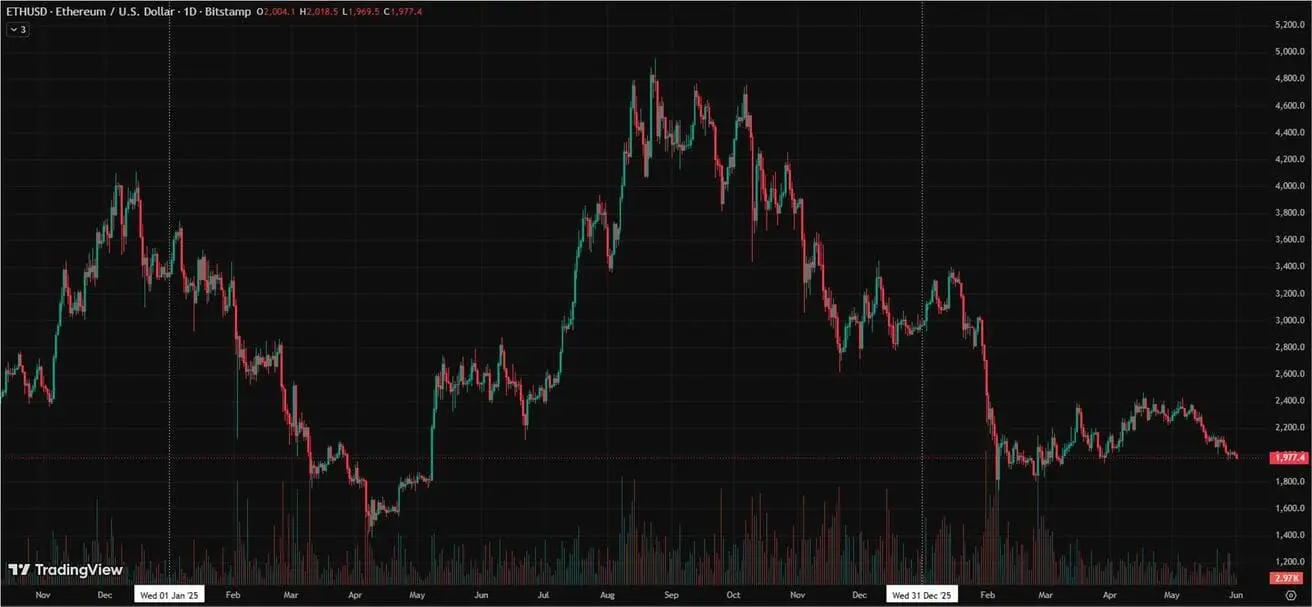
ETH FUTURES
Weekly performance: –4.45% (week close: $2004,00); year-to-date: –32.61%.
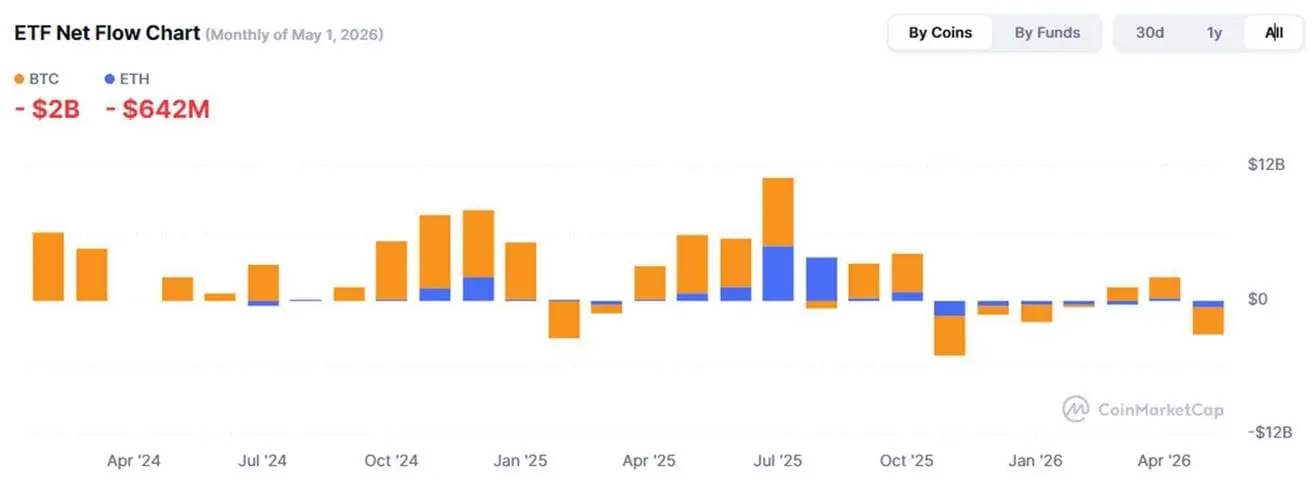
TOTAL CRYPTOCURRENCY MARKET CAPITALIZATION
Total crypto market capitalization: $2.46 trillion (vs $2.58 trillion a week earlier) (coinmarketcap.com).
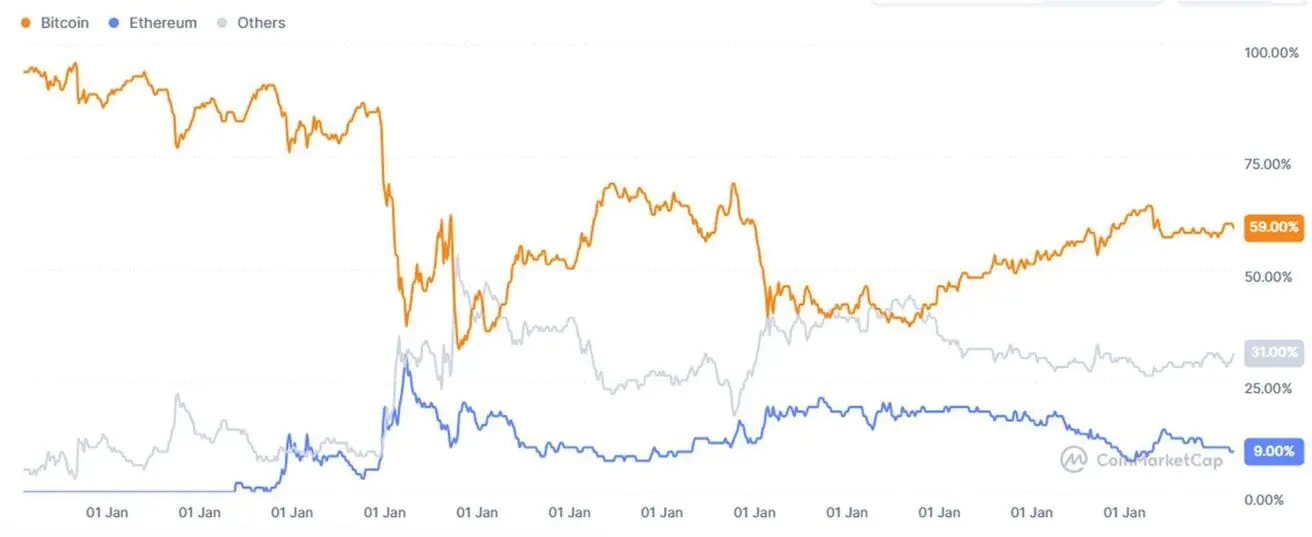
Crypto asset market shares:
- Bitcoin 59.1% (prev. 60.1%)
- Ethereum 9.7% (prev. 9.9%)
- Others 31.2% (prev. 30.1%)
ETF Net Flows Chart