Русский
 Қазақша
 Eesti
EestiMay 18 – 24, 2026: Weekly economic update
Key market updates

Key takeaways:
- The rate remains unchanged, with cautious rhetoric;
- Monetary policy remains moderately restrictive;
- U.S. macroeconomic data continue to support the soft-landing scenario; inflation risks are rising, and the labor market is cooling without signs of a recession, but this does not yet warrant a rate cut.
Macroeconomic Statistics
INFLATION: CONSUMER PRICE INDEX (APRIL):
- Core CPI: (MoM) 0,4% (prev: 0.2%); (YoY) 2.8% (prev: 2.6%).
- CPI: (MoM) 0.6% (prev: 0.9%); (YoY) 3.8% (prev: 3.3%).
PRODUCER PRICE INDEX (APRIL):
- PPI (m/m): 1.4%, prev: 0.7% revised.
- Core PPI (m/m): 1.0%, prev: 0.2% revised:
INFLATION EXPECTATIONS (MICHIGAN) (MAY):
- 12-month inflation expectations: 4.8% (prev: 4.7%);
- 5-year inflation expectations: 3.9% (prev: 3.5%).
GDP (U.S. Bureau of Economic Analysis, BEA) (Q1 2025, annualized, advance estimate): +2.0% (Q4 2025: +0.5%); forecast: 2.2%.
The Atlanta Fed’s GDPNow indicator (a “real-time” estimate of official GDP prior to its release): 4.3% (previous: 4.0%).
BUSINESS ACTIVITY INDEX (PMI) (MAY, PRELIMINARY DATA):
(Above 50 indicates expansion; below 50 indicates contraction)
- Services sector: 50.9 (prev: 51.0);
- Manufacturing sector: 55.3 (prev: 54.5);
- S&P Global Composite: 51.7 (prev: 51.7).
LABOR MARKET (BLS) (APRIL/MAY)
- Unemployment rate: 4.3% (prev: 4.3%);
- Total number of continuing jobless claims in the U.S.: 1,782K (prev: 1,766K);
- Initial jobless claims: 209K (prev: 200K);
- Change in nonfarm payroll employment: 109K (prev: 61K);
- Change in private nonfarm payroll employment: 186K (prev: -129K);
- Average hourly earnings (y/y): 3.6% (prev: 3.4%);
- JOLTS job openings: 6.866M (prev: 6.922M).
MONETARY POLICY
Kevin Warsh has been confirmed as Chair of the Federal Reserve.
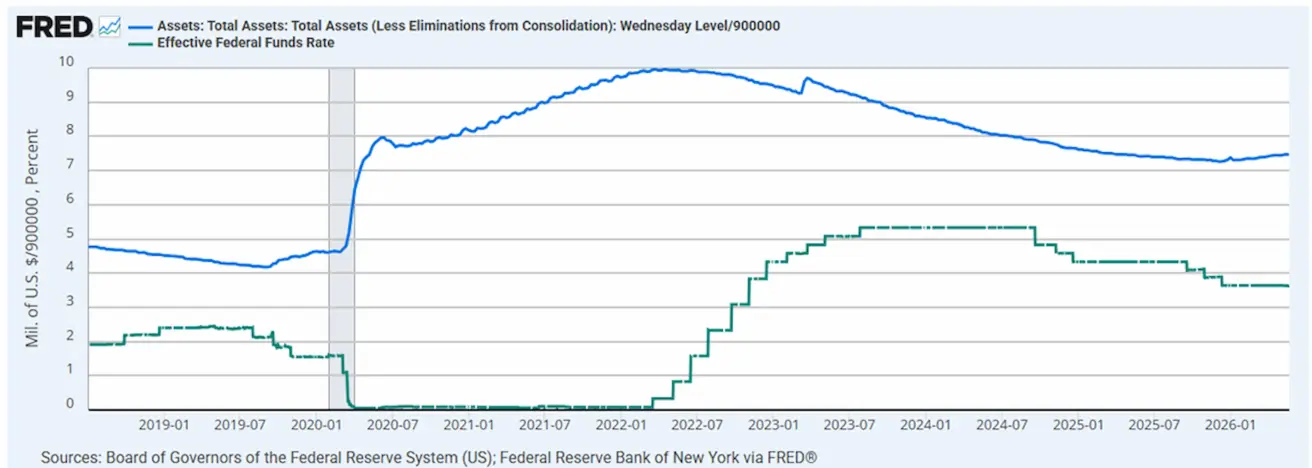
- Effective Federal Funds Rate (EFFR): 3.50%–3.75%;
- Federal Reserve balance sheet: $6.713 trillion, up 2.72% since the suspension of QT ($6.535 trillion).
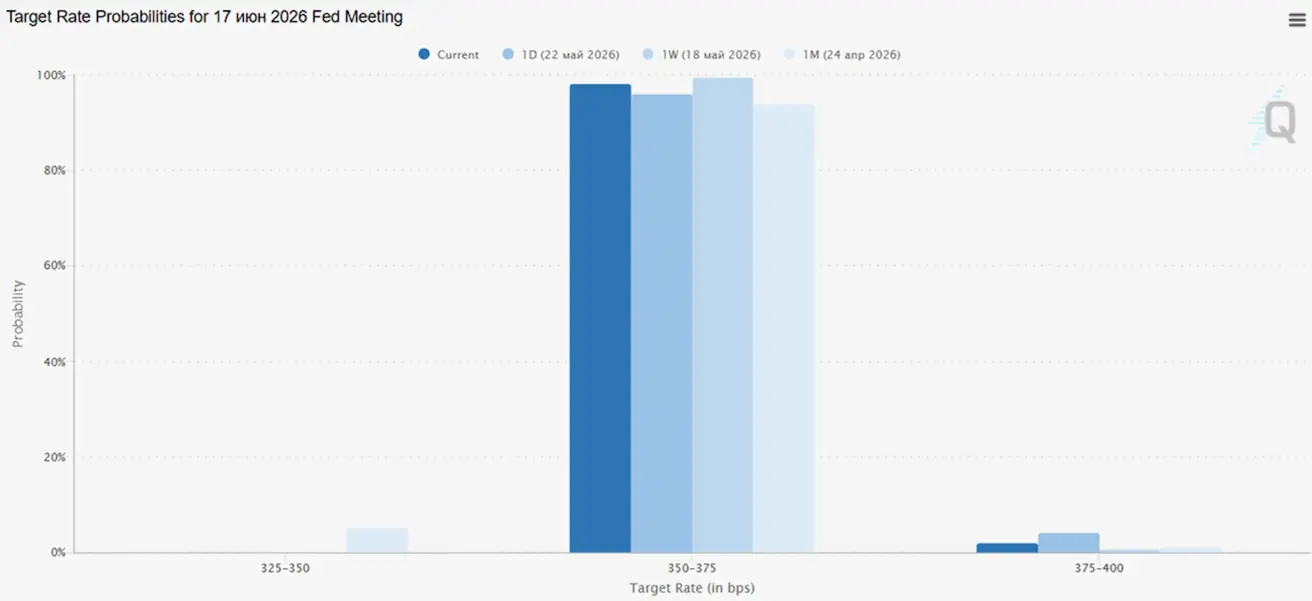
MARKET FORECAST FOR RATE (FEDWATCH)
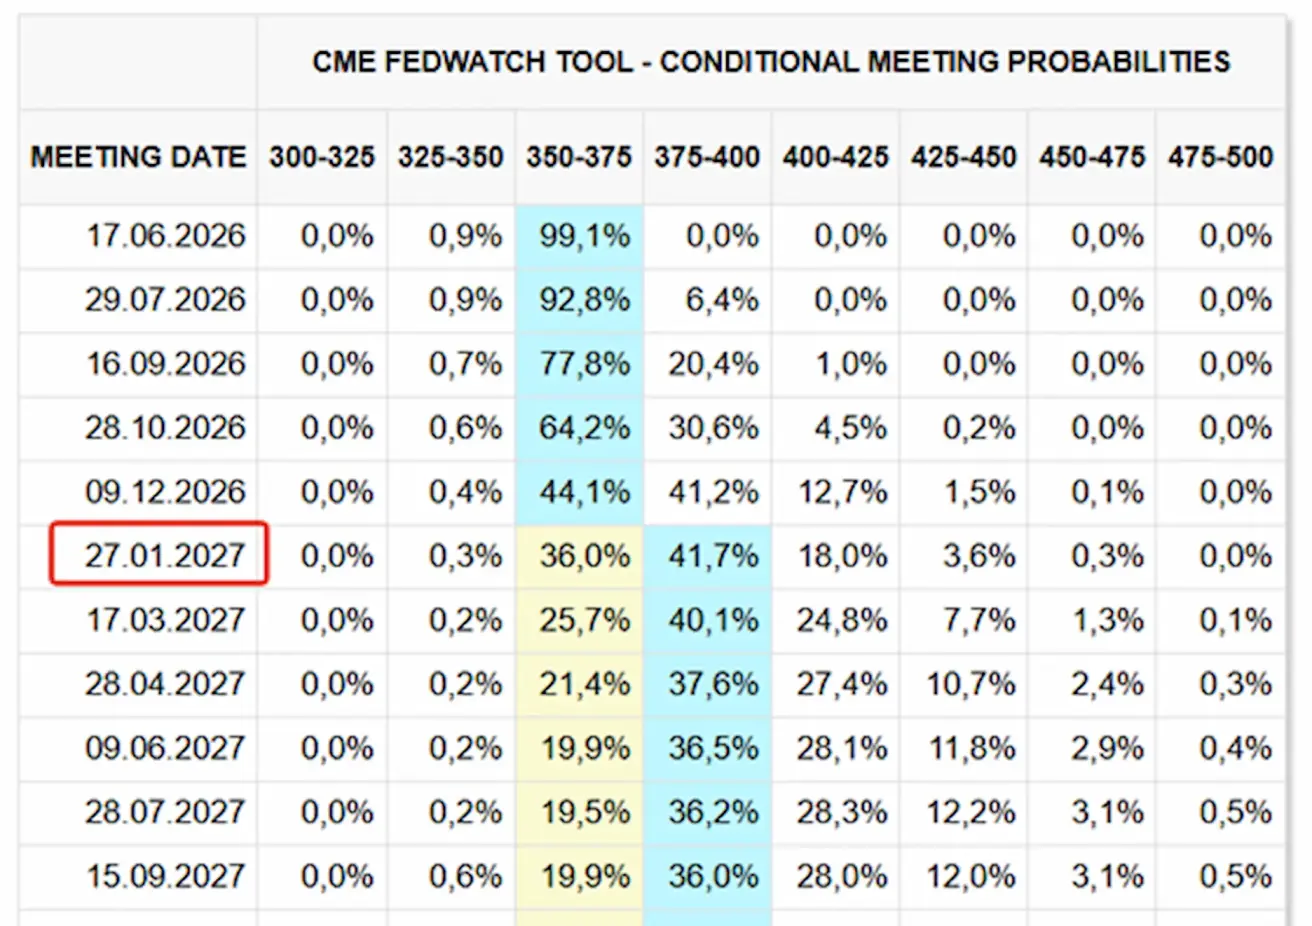
At the next meeting (June 17), the estimated probability of the rate remaining unchanged stands at 98.05%.
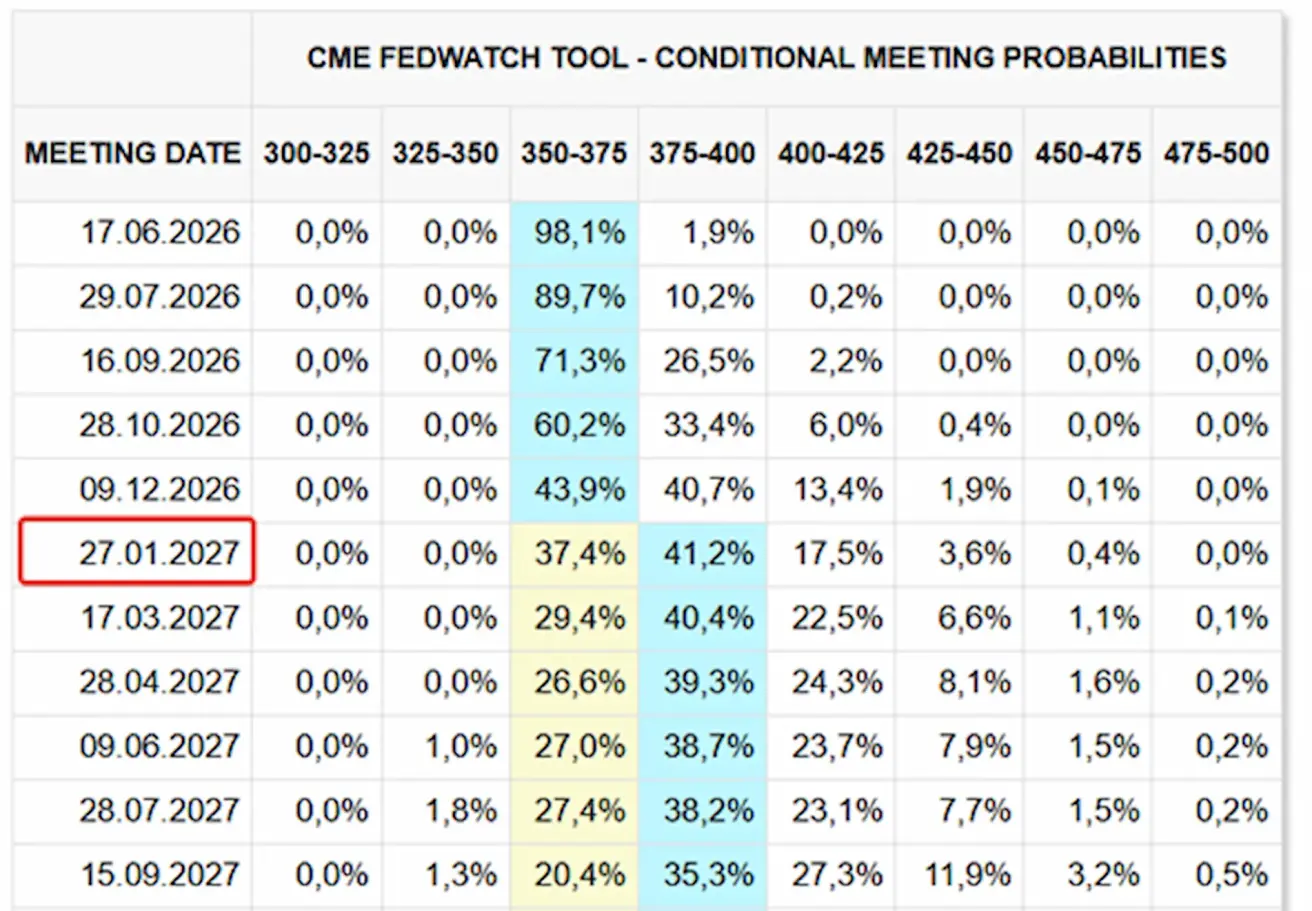
No changes over the next 12 months — the market is pricing in a 25 bps rate hike in January 2027, bringing the target range to 3.75 – 4.00%.
Today:
A week earlier:
Market
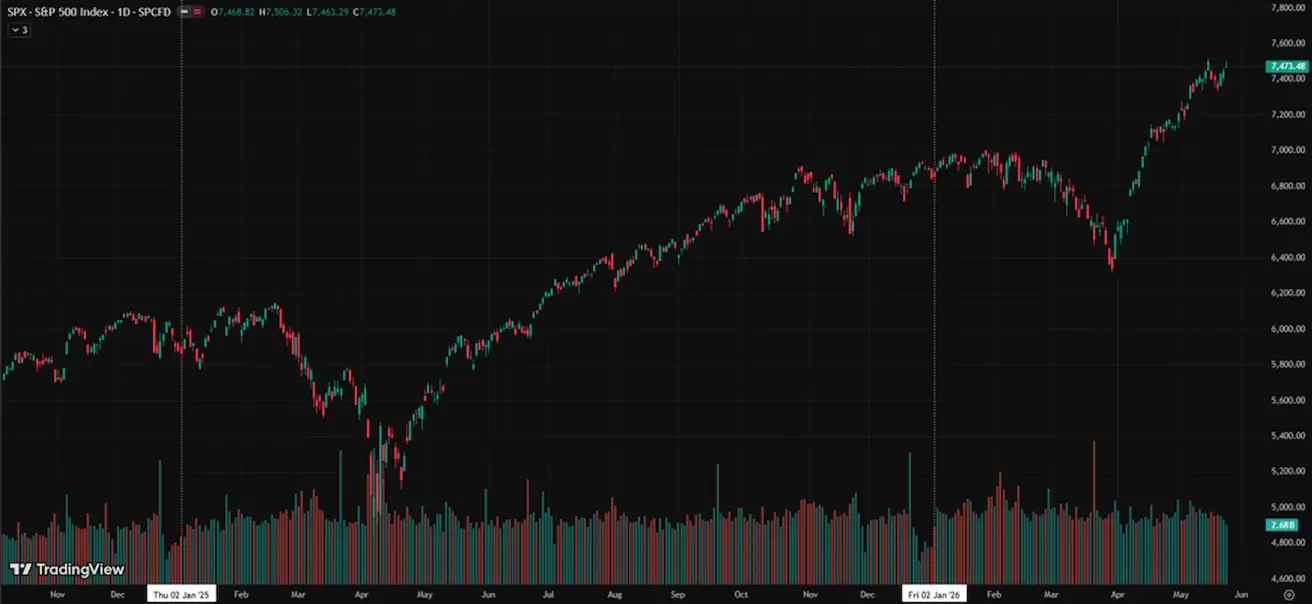
SP500
Weekly performance: +0,88% (week-end close at 7473,48); year-to-date: +9,17%.
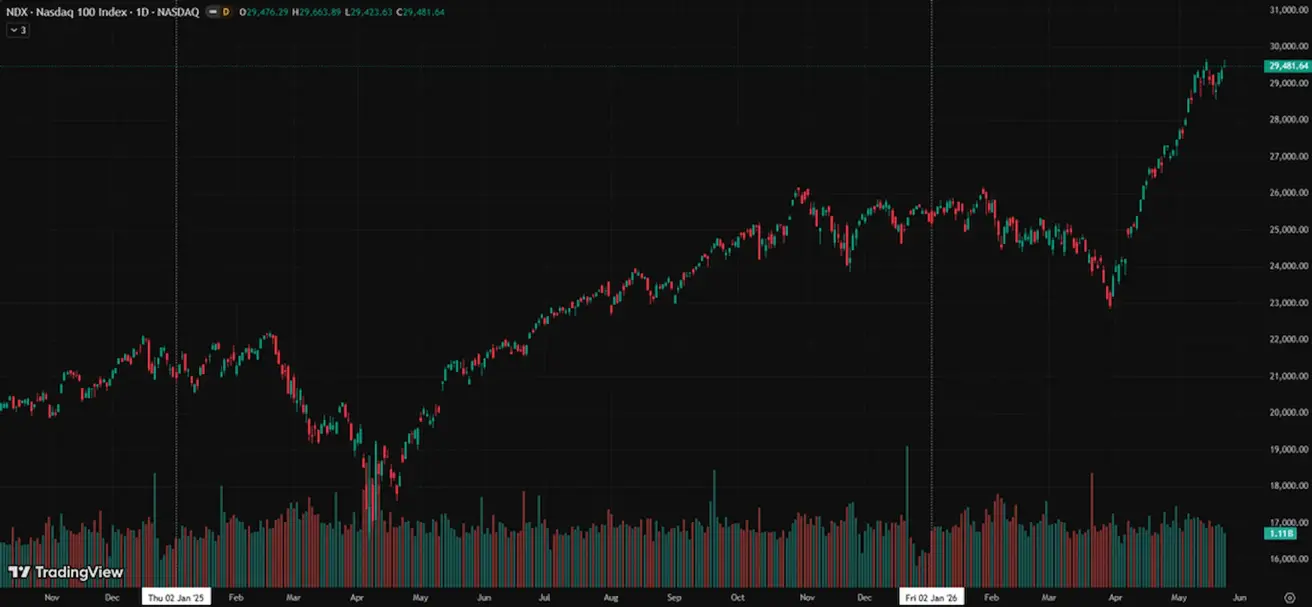
NASDAQ100
Weekly performance: +1,22% (week-end close at 29481,64); year-to-date: +16,76%.
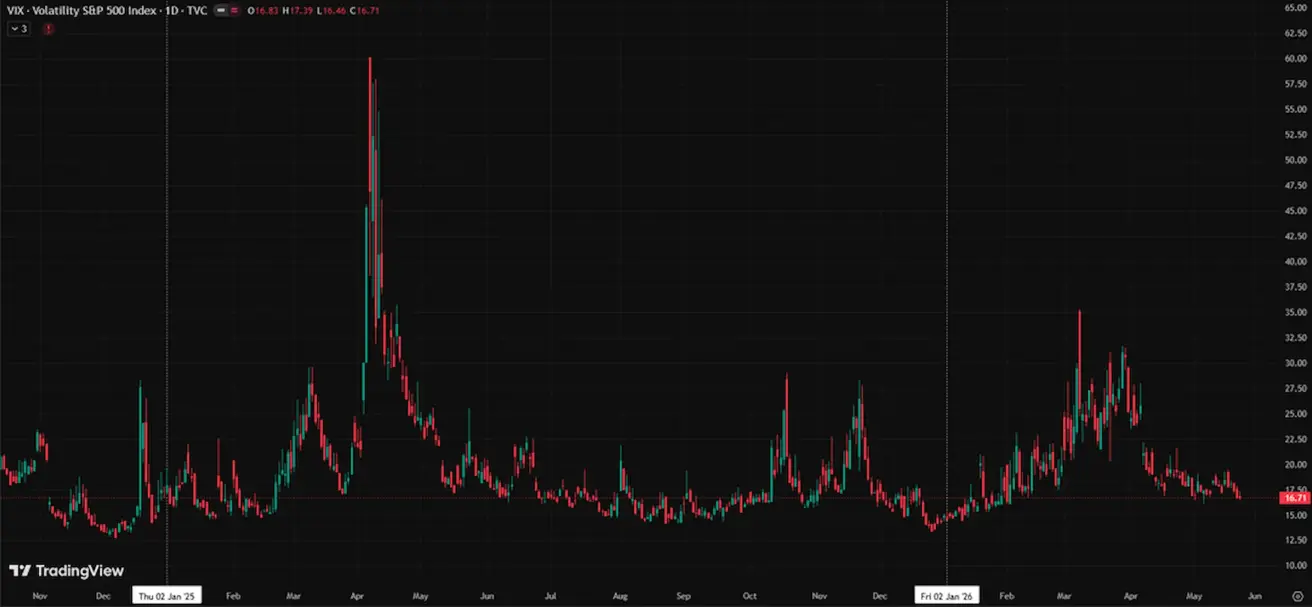
VIX
VIX (volatility index): week closing at 16,71 points.
RUSSEL 2000 (RUT)
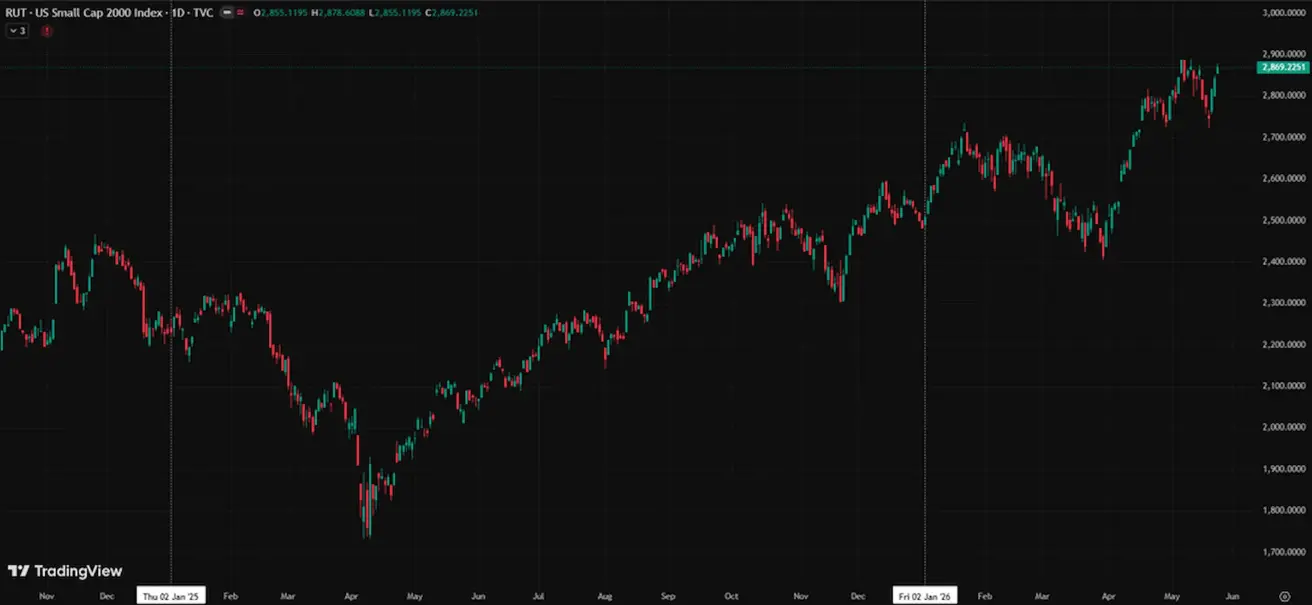
Weekly performance: +2,72% (week-end close at 2869,22); year-to-date: +15,61%.
Selection of corporate earnings reports from last week:
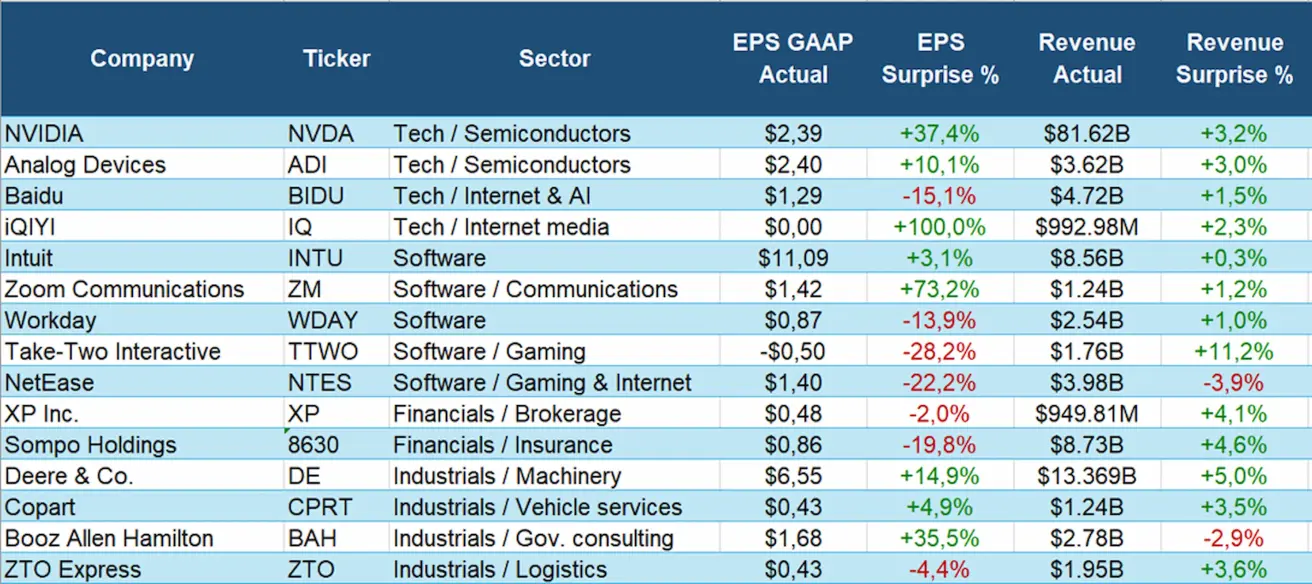
The technology sector was the strongest performer overall: Nvidia and AMD significantly exceeded expectations, while weakness at Baidu was partially offset by revenue performance.
The software sector delivered mixed results: Intuit and Zoom posted strong EPS surprises, while Workday, Take-Two, and NetEase disappointed on earnings, pointing to margin pressure.
The financial sector was moderately weak: XP and Sompo missed EPS expectations, although revenue came in above consensus.
The industrial sector appeared resilient: Deere, Copart, and Booz Allen exceeded profit forecasts, though revenue performance was mixed.
Overall, the market rewarded high-quality growth while penalizing weak profitability. The clearest positive signal came from AI and semiconductors, while the gaming segment showed the weakest performance.
NVIDIA’s earnings report and management guidance:
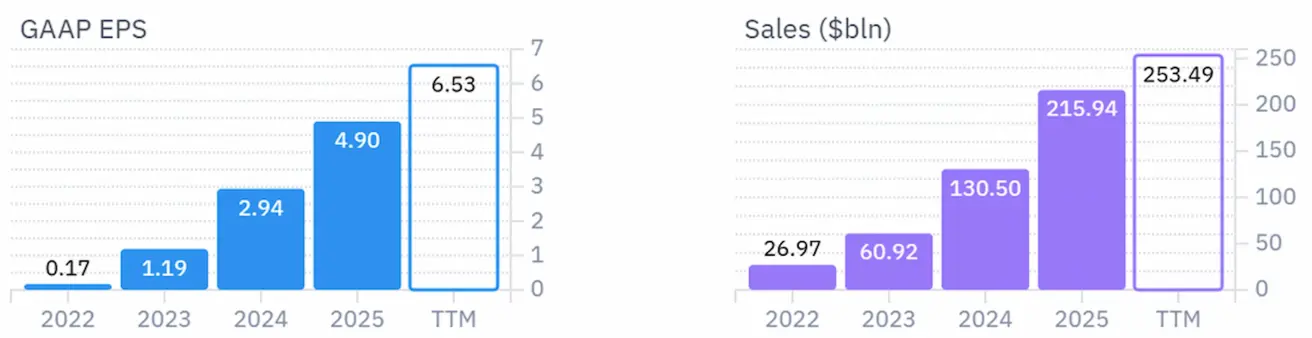
Annual:
Quarterly:
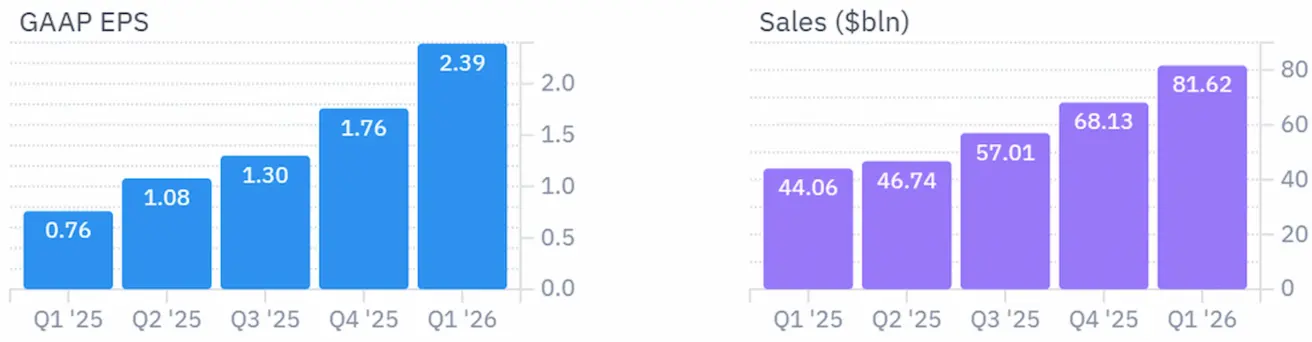
- The report was exceptionally strong: revenue reached $81.6 billion, up 85% YoY; Data Center revenue totaled $75.2 billion, up 92% YoY;
- NVIDIA’s core message: AI infrastructure buildout is accelerating; CEO Jensen Huang described it as the largest infrastructure expansion in history;
- AI is no longer just experimental: management stated that agentic AI is already creating tangible value for companies;
- The key growth driver remains data centers: nearly all growth is coming from AI chips, the Blackwell platform, Nvidia Networking systems, and demand from hyperscalers and cloud customers;
- The Blackwell platform remains the company’s flagship product: demand is strong, growth is rapid, and * Nvidia sees a powerful AI infrastructure upgrade cycle ahead;
- NVIDIA aims to demonstrate demand diversification: the company’s market now extends beyond data centers to include edge computing, major cloud providers, AI cloud platforms, industrial clients, and enterprise customers;
- Guidance for the next quarter is bullish: Nvidia expects revenue of $91 billion ±2%;
- Importantly, the guidance excludes revenue from China data center compute capacity, signaling that Nvidia believes growth can continue even without the Chinese segment;
- Margins remain exceptionally high: expected non-GAAP gross margin is around 75%;
- China remains the primary risk: export restrictions and the exclusion of China data center compute revenue from guidance highlight that geopolitics continues to be a major challenge;
- Shareholders received a positive signal: Nvidia increased its share repurchase authorization by $80 billion and raised its dividend from $0.01 to $0.25 per share.
Conclusion: management delivered a highly optimistic message — demand for AI infrastructure is not slowing, but broadening across a wider range of large-scale customers.
Eurozone
- Rates remain unchanged for now, but inflation risks are rising;
- Monetary policy remains neutral, though the balance of risks has shifted toward inflation;
- As the conflict in the Middle East escalated, the ECB revised its GDP forecasts downward and raised its inflation outlook for the coming years.
Key message from the regulator: the overall backdrop is becoming increasingly hawkish.
Interest rates
- Deposit facility rate: 2.0% (prev. 2.0%);
- Marginal lending facility rate: 2.4% (prev. 2.4%) — the rate at which banks can borrow overnight funds from the regulator;
- Main refinancing (policy) rate: 2.15% (prev. 2.15%).
Inflation: Consumer Price Index (CPI) (April, preliminary data):
- Core CPI (YoY): 2.2% (prev. 2.3%);
- CPI (MoM): 1.0% (prev. 1.3%); (YoY): 3.0% (prev. 2.6%).
GDP for Q1 (preliminary):
- QoQ: 0.1% (prev. revised 0.2%);
- YoY: 0.8% (prev. 1.2%).
Unemployment rate (March): 6.3% (prev. 6.2%).
Industrial production (MoM) (February): 0.4% (prev. -0.8%).
Purchasing Managers’ Index (PMI) (April): remained in expansion territory, though momentum slowed.
- Services sector: 46.4 (prev. 47.6);
- Manufacturing sector: 51.4 (prev. 52.2);
- S&P Global Composite: 47.5 (prev. 48.6).
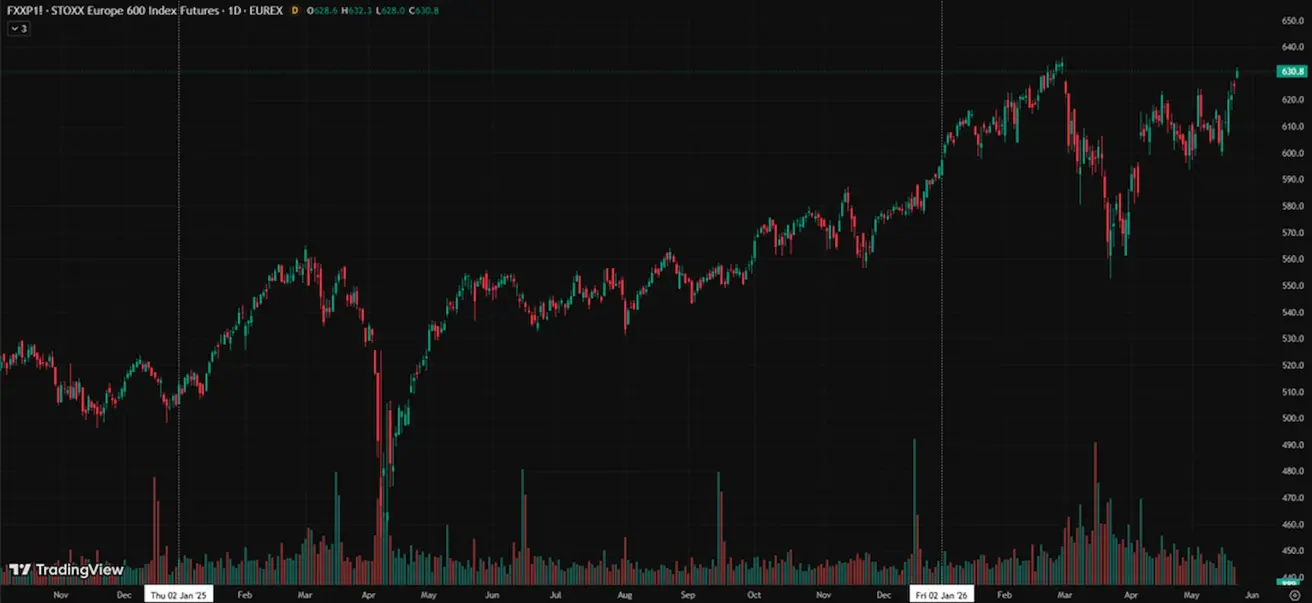
EURO STOXX 600 (FXXP1!)
Weekly performance: +3,51% (Week-end close: 625,5); Year-to-date: +5,30%.
China
The economy is stabilizing on the back of exports, while domestic demand and investment are gradually recovering; stimulus measures remain targeted and cautious.
- Rates remain unchanged;
- Monetary policy remains accommodative;
- China announced the continuation of fiscal support for economic growth under its 2026 plan, including measures to stimulate domestic demand, optimize tax incentives and subsidies, and modernize industry.
Interest rates:
- 1Y Loan Prime Rate (medium-term lending): 3.00%;
- 5Y Rate (five-year benchmark rate affecting mortgages): 3.50%.
Inflation indicators (April):
- Consumer Price Index (CPI): MoM +0.3% (prev. -0.7%); YoY 1.2% (prev. 1.0%);
- Producer Price Index (PPI): YoY +2.8% (prev. -0.5%).
GDP for Q1 2026:
- QoQ: 1.3% (prev. 1.2%);
- YoY: 5.0% (prev. 4.5%).
Unemployment rate (April): 5.2% (prev. 5.4%).
Industrial production (April, YTD YoY): 5.6% (prev. 6.1%).
Fixed asset investment (April, YoY): -1.6% (prev. 1.7%).
Retail sales (March, YoY): 0.9% (prev. 1.3%).
Imports volume (April, YoY): 25.3% (prev. 27.8%).
Exports volume (April, YoY): 14.1% (prev. 2.5%).
Trade balance (USD) (April, YoY): $84.80 billion (prev. $51.13 billion).
Purchasing Managers’ Indices (PMI) (March):
- Manufacturing sector: 50.3 (prev. 50.4);
- Non-manufacturing sector: 49.4 (prev. 50.1);
- Composite PMI: 50.1 (prev. 50.5).
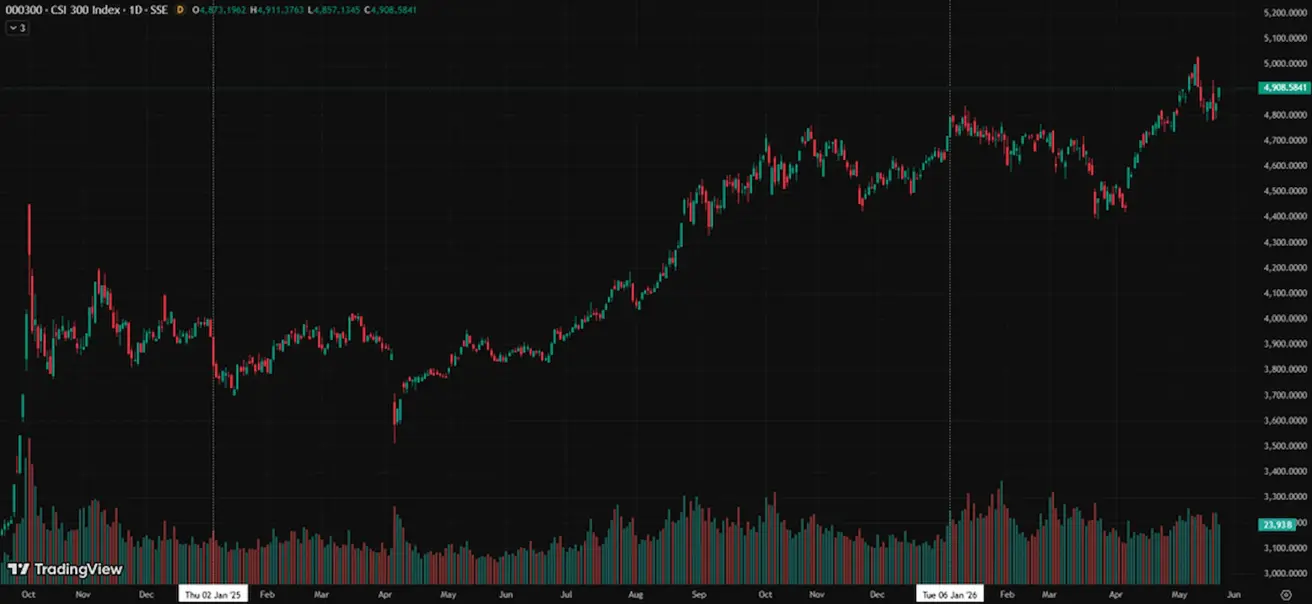
CSI 300 INDEX (000300.HK)
Weekly performance: +0,24% (week-end close at 4845,09); Year-to-date: +3,94%.
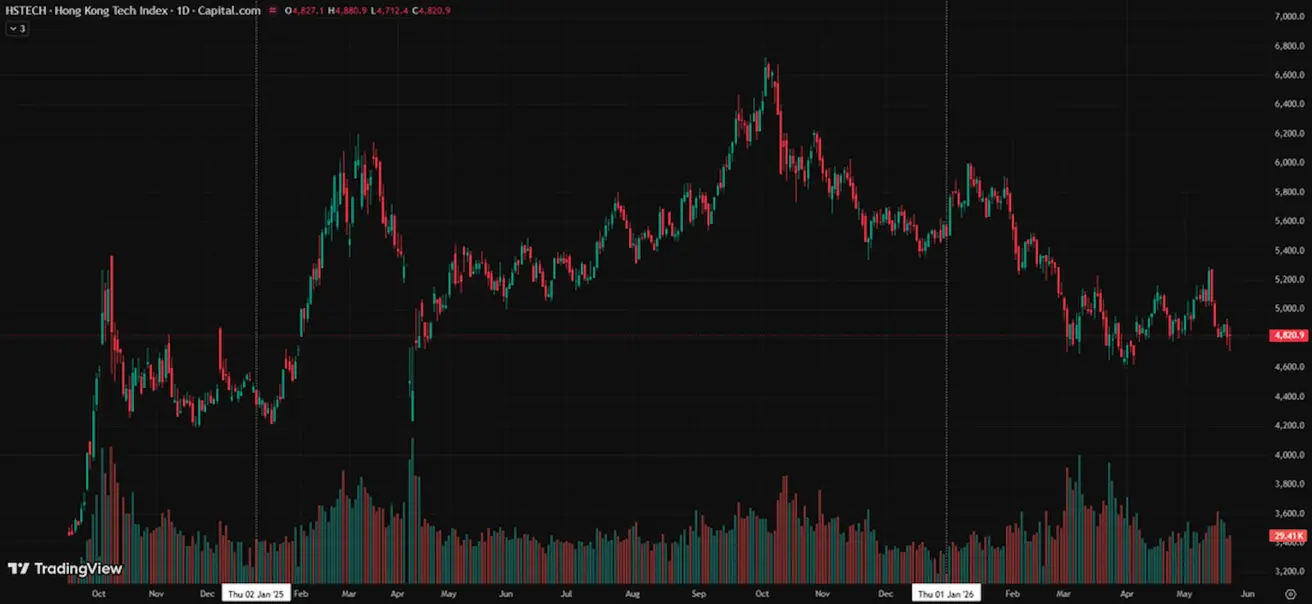
Hang Seng TECH Index (HSTECH)
Weekly performance: -1,57% (week-end close: 4814,5); year-to-date: -12,54%.
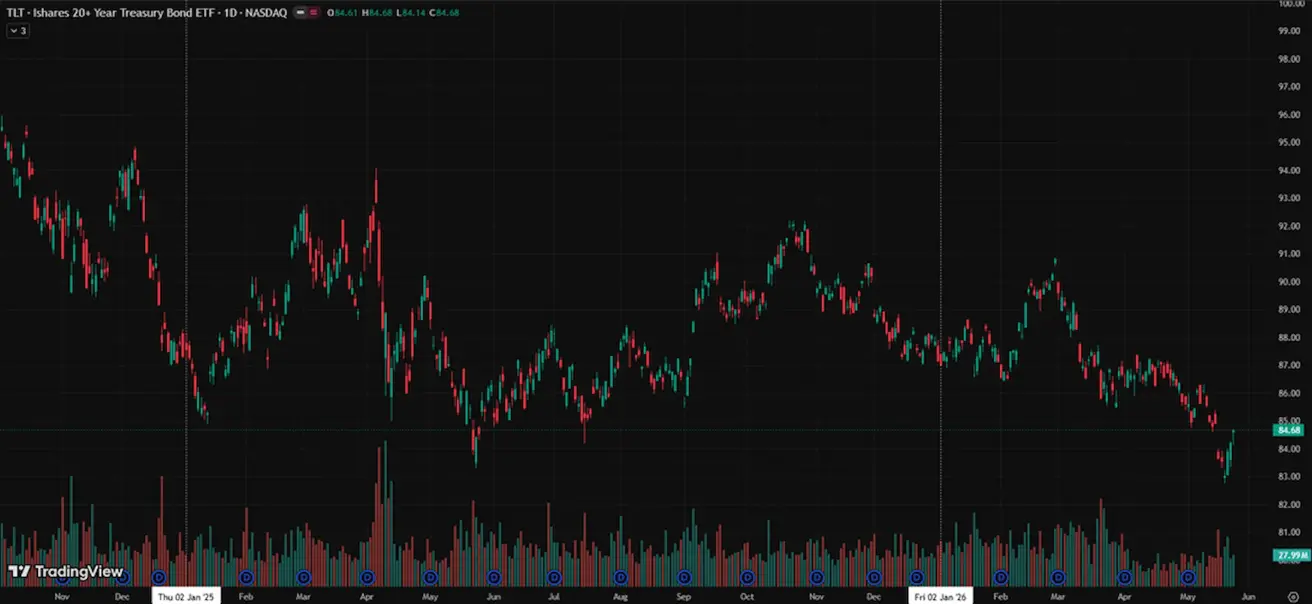
BOND MARKET
U.S. Treasuries 20+ (ETF TLT): weekly performance: +1,22% (week close: 84,68); year-to-date: -2,85%.
YIELDS AND SPREADS
Market Yield on U.S. Treasury Securities at 10-Year Constant Maturity: 4.49% (prev. 4.63%); 2-year Treasury yield: 4.13% (prev. 4.10%);
ICE BofA BBB US Corporate Index Effective Yield: 5.40% (prev. 5.34%).
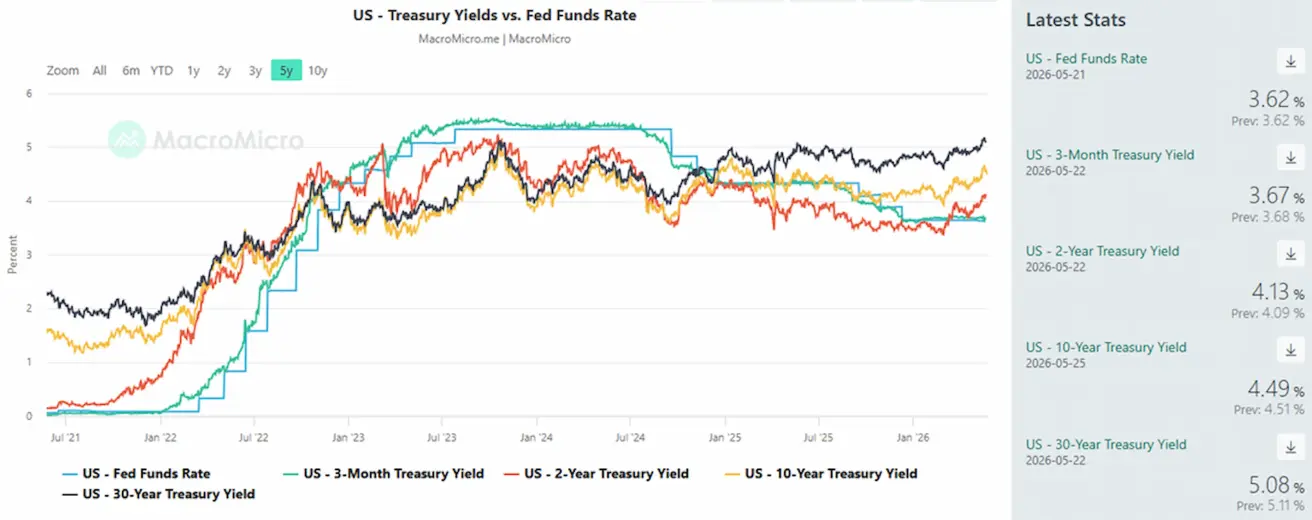
- The yield spread between 10-year and 2-year U.S. Treasury securities stands at 36 basis points (prev. 53);
- The yield spread between 10-year and 3-month U.S. Treasury securities stands at 82 basis points (prev. 93).
The cost of 5-year U.S. credit default swaps (CDS) — insurance against default — stands at 37.74 bps (vs. 37.29 bps last week).
U.S. Treasury yield curve:
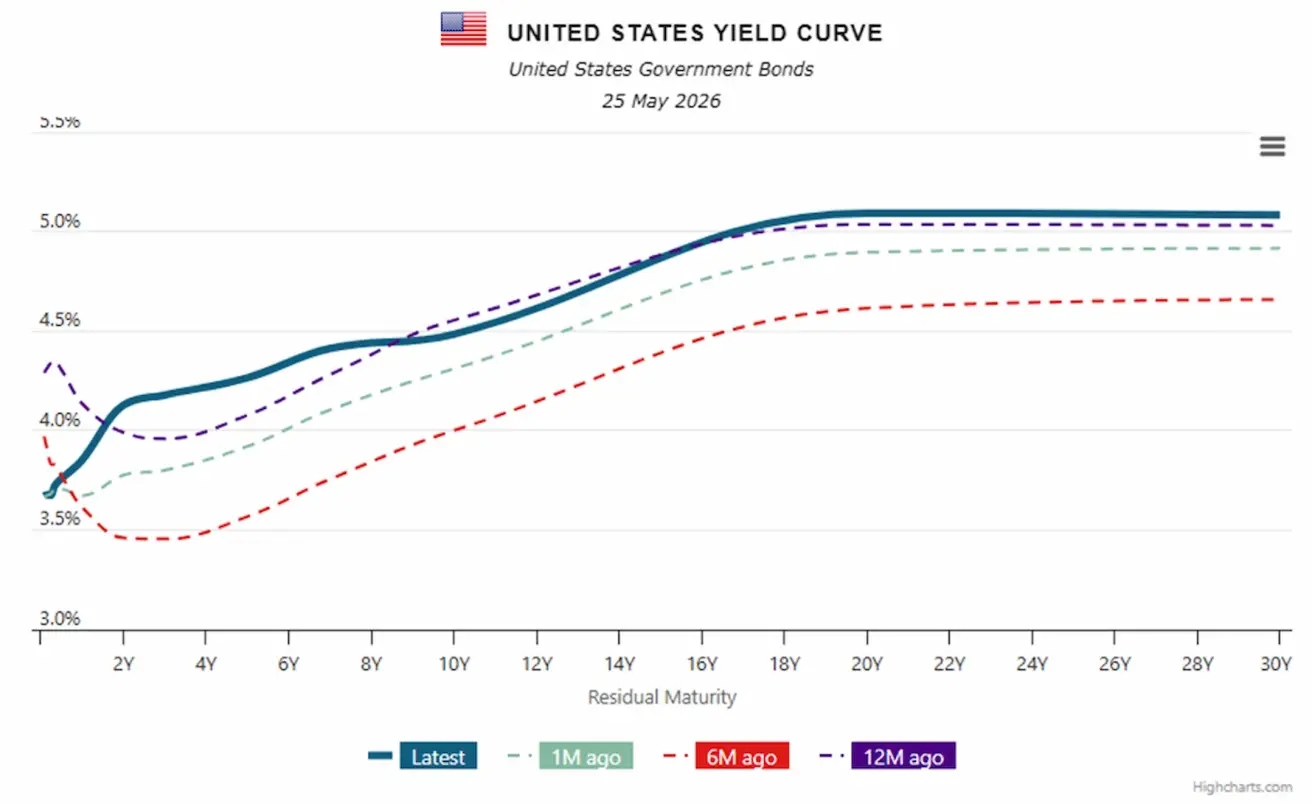
Overall, the U.S. yield curve remains distinctly upward-sloping: the long end (20–30 years) continues to trade above 5%, while the entire curve remains noticeably higher than six months ago. This reflects market expectations that the Federal Reserve will keep rates elevated for longer and that inflation will remain more persistent, or “sticky.”
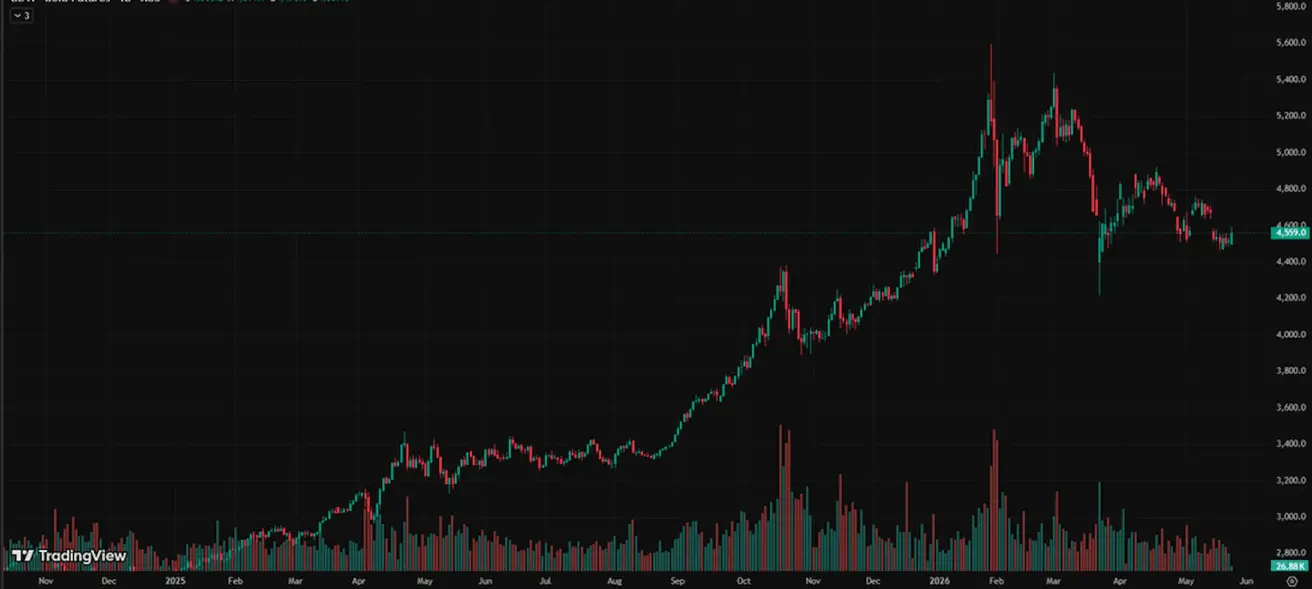
GOLD FUTURES (GC)
Weekly performance: -0,38% (week close: $4516,9 per troy ounce); Year-to-date: +4,27%.
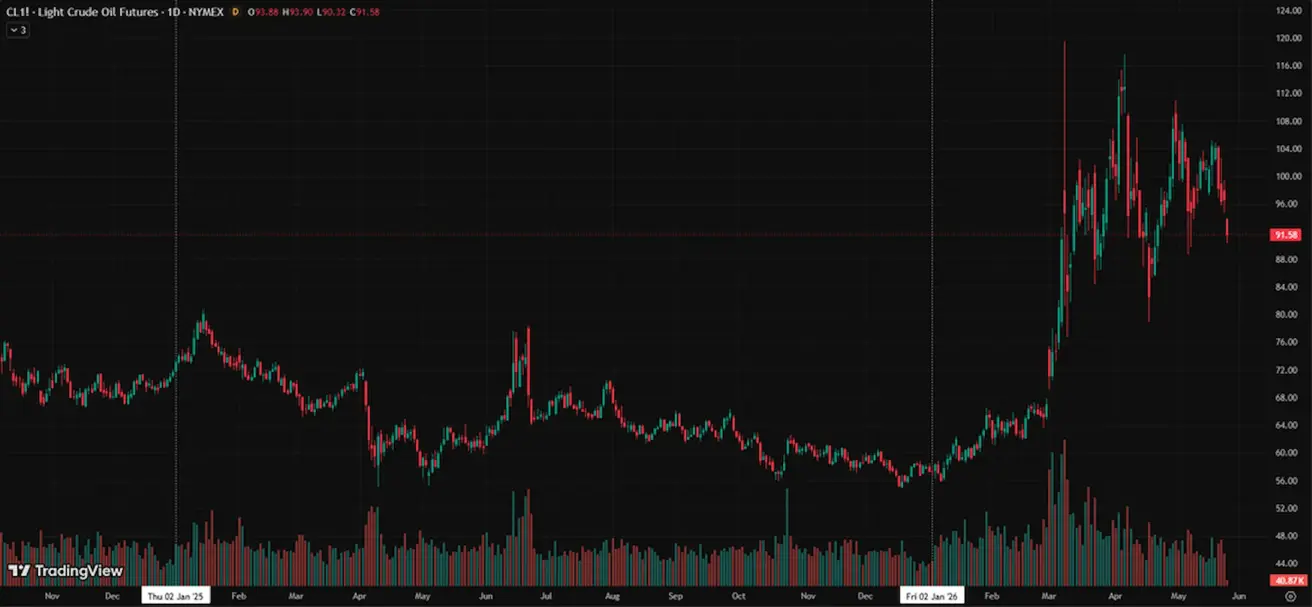
OIL FUTURES
Weekly performance: -5,90% (week-end close: $96,60 per barrel). Year-to-date performance: +68,26%.
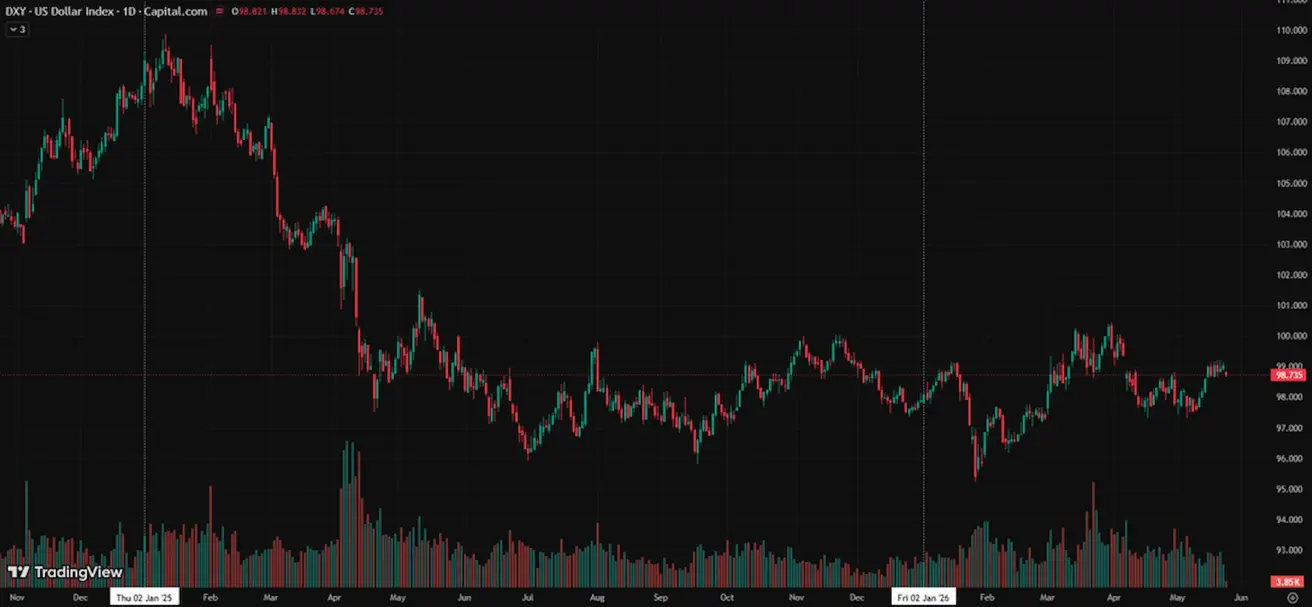
DOLLAR INDEX FUTURES (DX)
Weekly performance: +0,05% (week-end close: 99,045). Year-to-date performance: +1,07%.
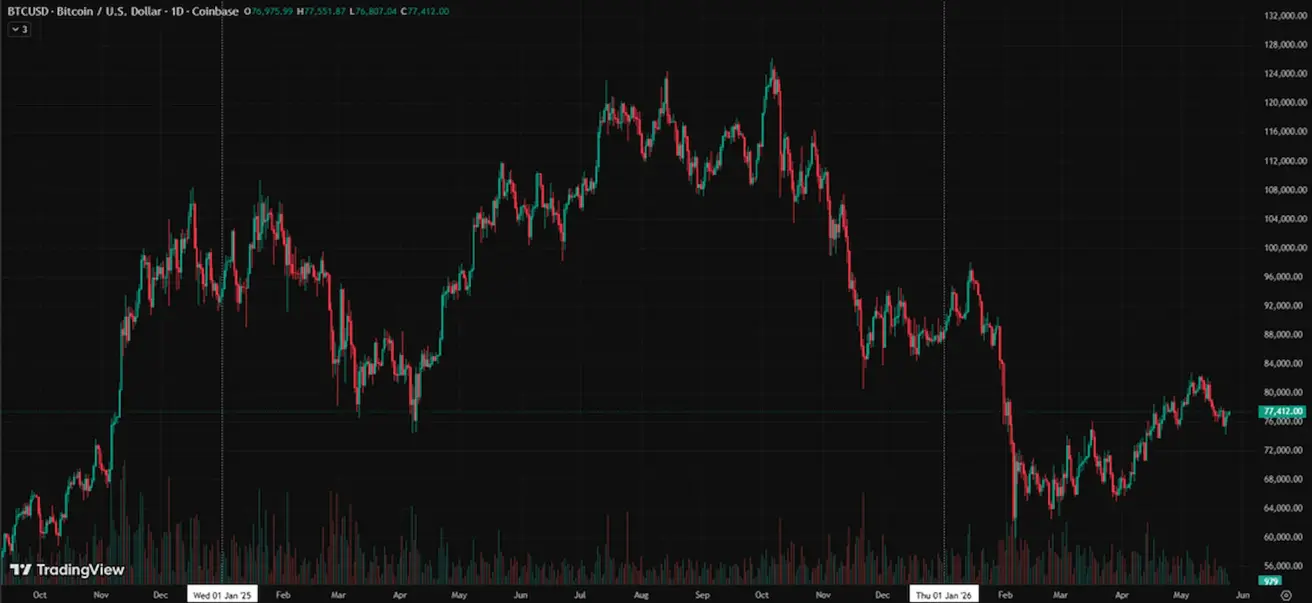
BTC FUTURES
Weekly performance: -0,56% (week-end close: $76975,99); year-to-date: -12,25%.
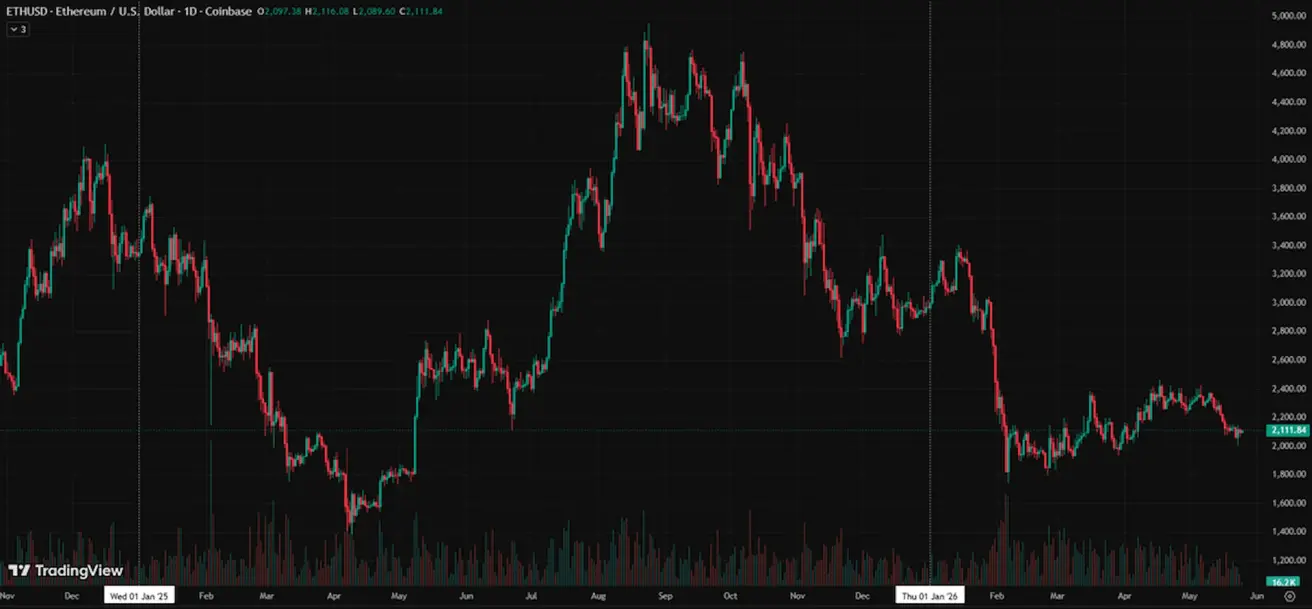
ETH FUTURES
Weekly performance: -1,52% (week-end close: $2097,35); year-to-date: -29,47%.
TOTAL CRYPTOCURRENCY MARKET CAPITALIZATION
Total crypto market capitalization: $2,58 trillion (vs $2,55 trillion a week earlier) (coinmarketcap.com).
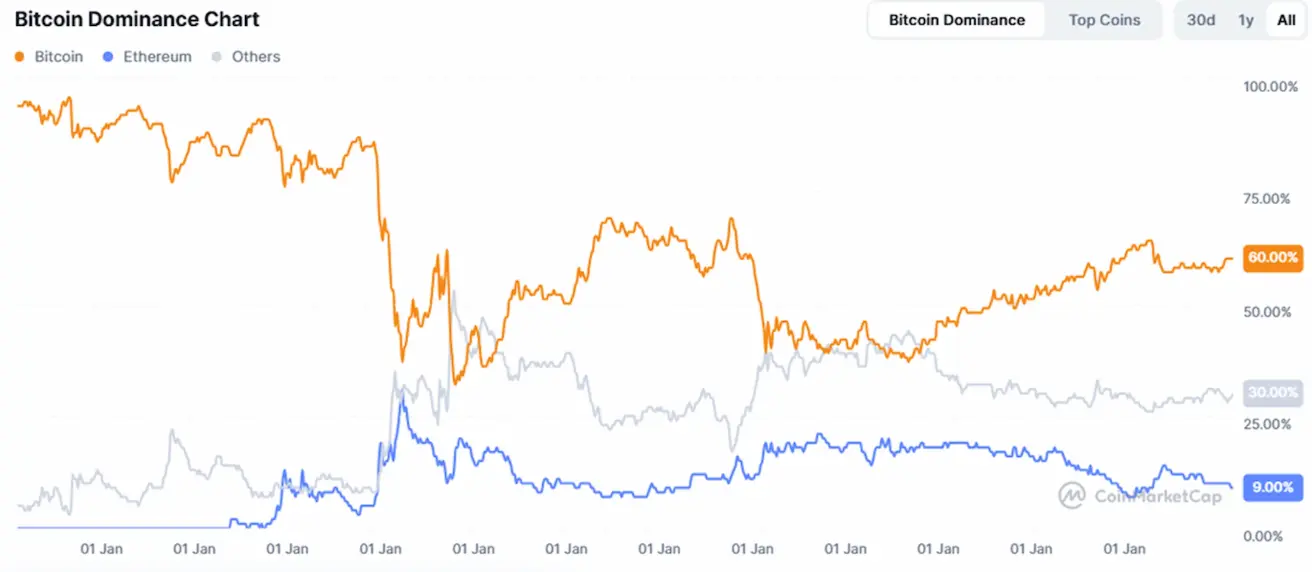
Crypto asset market shares:
- Bitcoin: 60.1% (60.3%)
- Ethereum: 9.9% (10.0%)
- Others: 30.1% (30.0%).
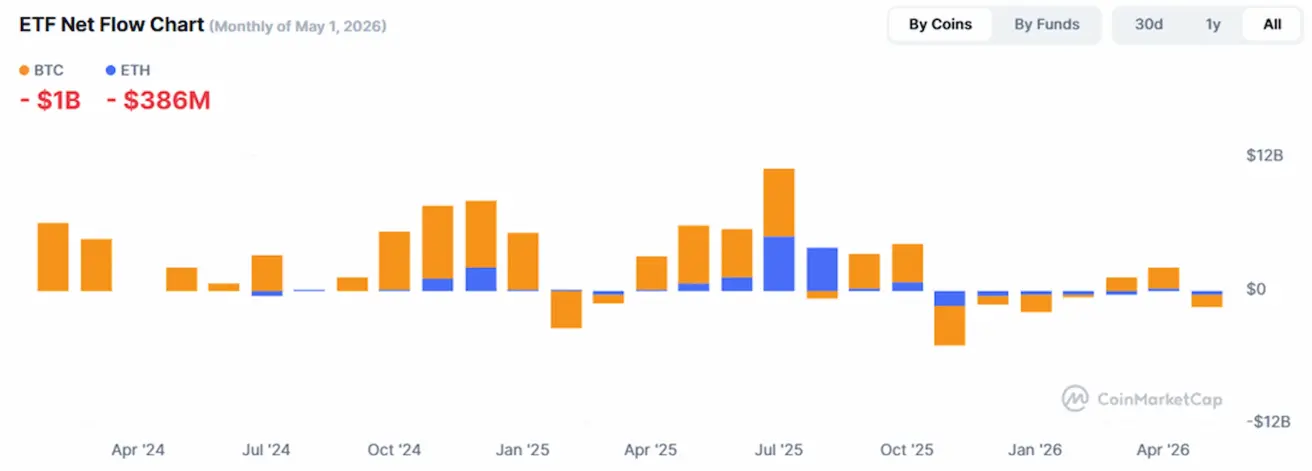
ETF Net Flows Chart