Lietuvių
 Русский
 Қазақша
 Eesti
EestiJune 15 – 21, 2026: Weekly economic update
Key market updates

Key Takeaways:
- The policy rate remains unchanged, while the Fed’s rhetoric remains cautious;
- Monetary policy remains moderately restrictive;
- U.S. macroeconomic data continue to support a soft-landing scenario: inflation risks are increasing, the labor market is cooling without signs of recession, and current conditions do not yet warrant a rate cut.
The fourth FOMC meeting of the year took place, during which the federal funds rate was (as widely expected) maintained within its current target range of 3.50–3.75%.
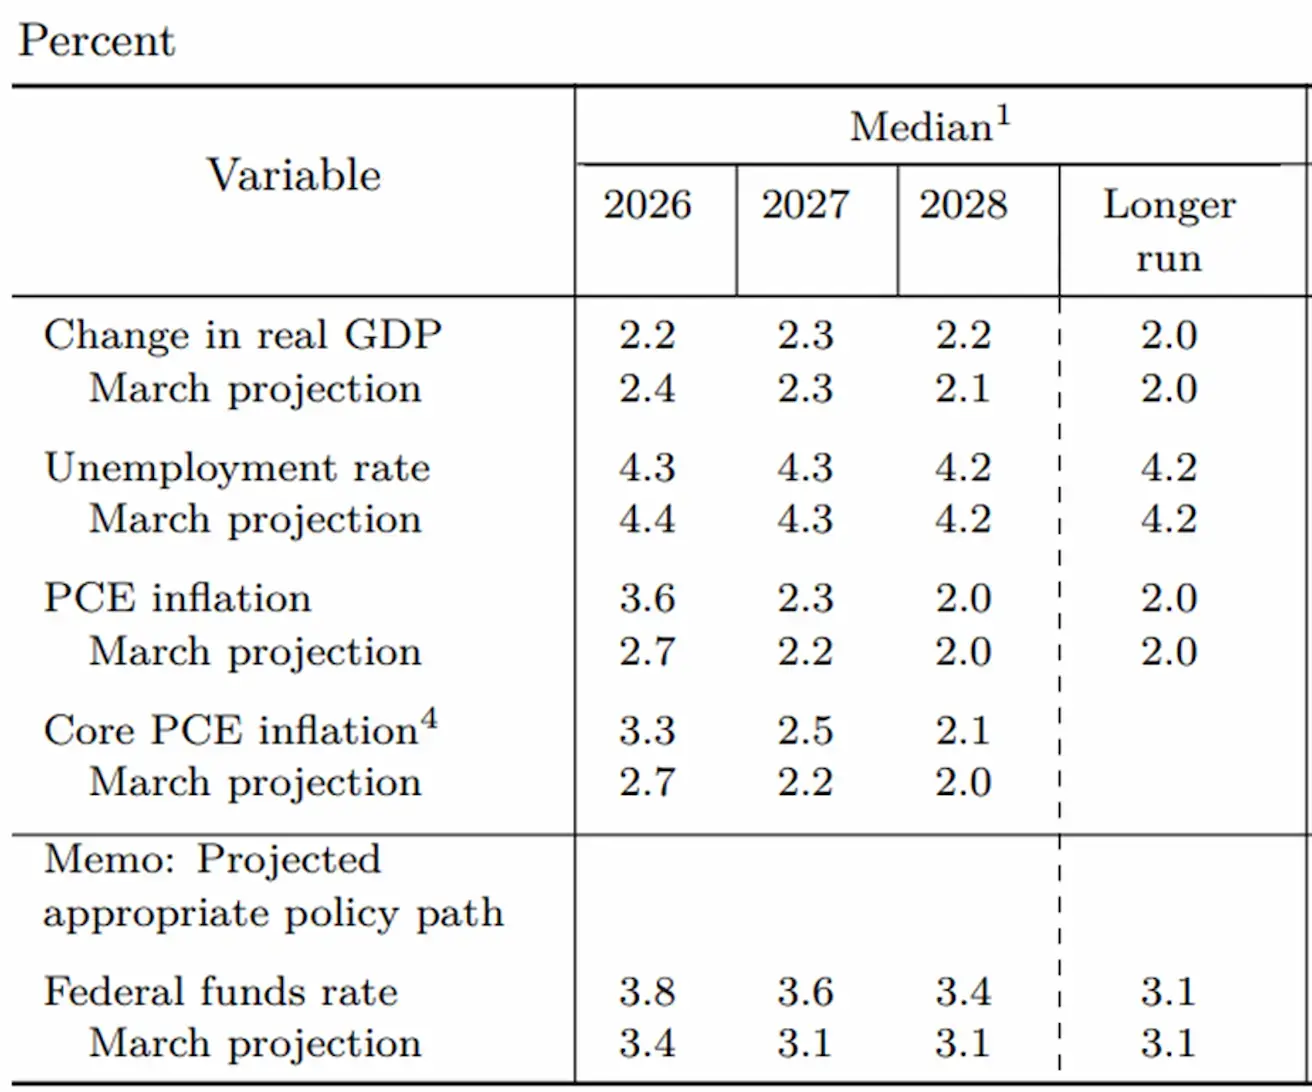
The Committee lowered its 2026 GDP growth forecast to 2.2% and raised its inflation projections to 3.6% for PCE inflation and 3.3% for Core PCE inflation (Personal Consumption Expenditures).
The median projection for the federal funds rate was also revised upward, reaching 3.8% by the end of 2026, corresponding to a target range of 3.75–4.00%, followed by gradual rate reductions in 2027 and 2028.
Economic projections of Federal Reserve Board members and Federal Reserve Bank presidents, under their individual assumptions of appropriate monetary policy, June 2026:
FOMC participants’ assessments of appropriate monetary policy: Midpoint of target range or target level for the federal funds rate:
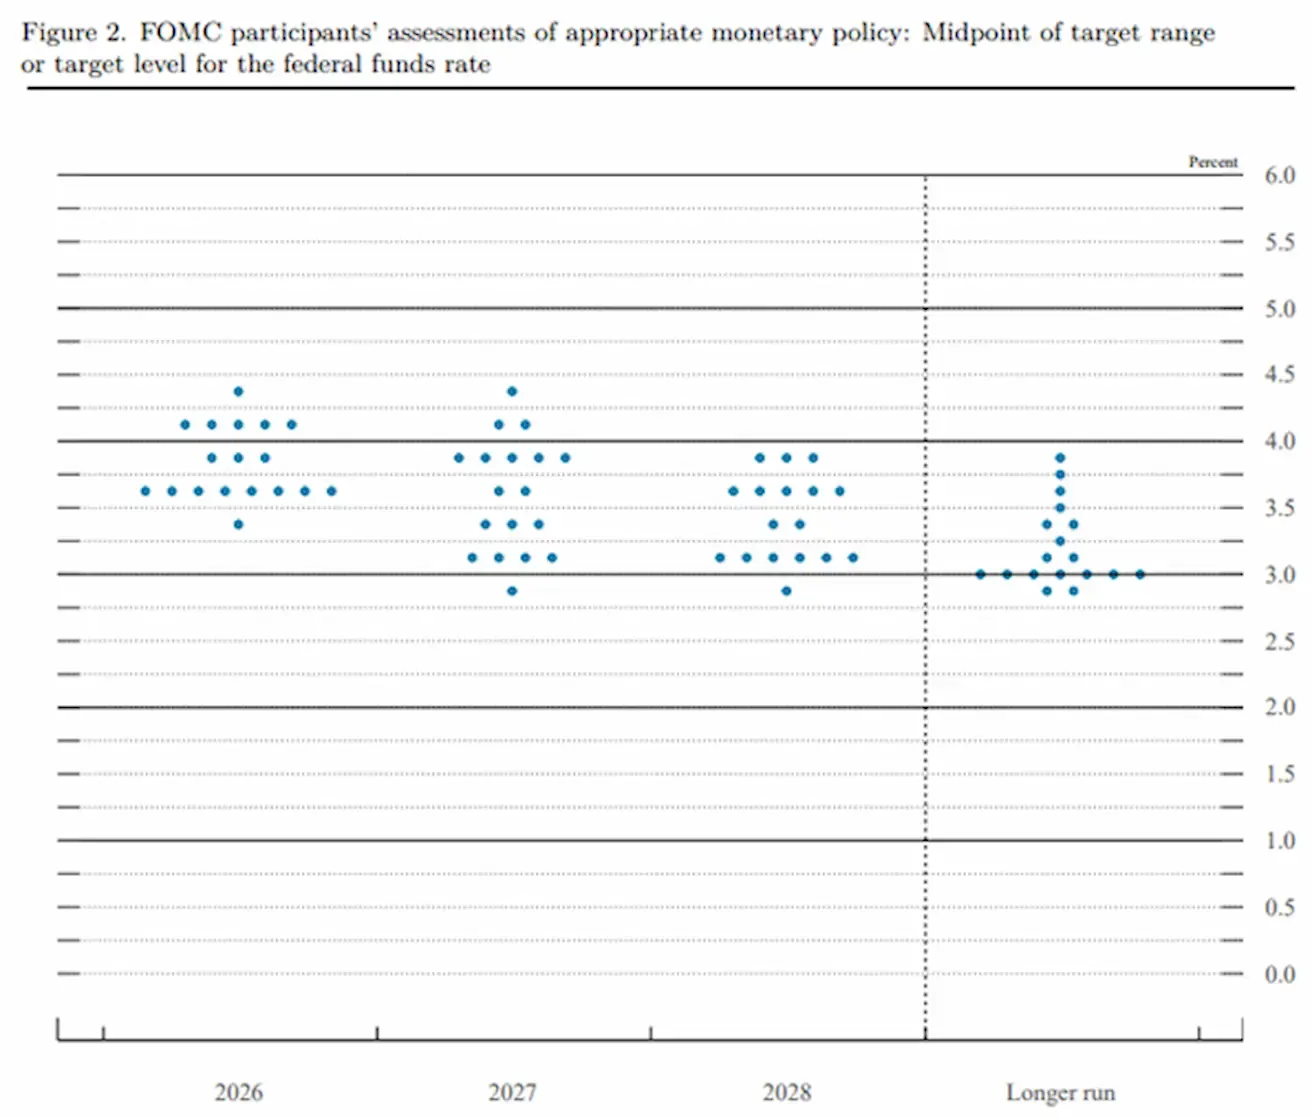
Based on the distribution of voting members’ projections, it is evident that, over the longer-term horizon beginning in 2028, the Federal Reserve is not currently considering scenarios in which the policy rate falls below 3%.
Kevin Warsh’s remarks during the press conference appeared notably more hawkish with respect to the inflation target than Jerome Powell’s recent public statements.
INFLATION: CONSUMER PRICE INDEX (MAY):
- Core CPI (MoM): 0.2% (previous: 0.4%).
- Core CPI (YoY): 2.9% (previous: 2.8%).
- CPI (MoM): 0.5% (previous: 0.6%).
- CPI (YoY): 4.2% (previous: 3.8%).
PRODUCER PRICE INDEX (MAY):
- PPI (MoM): 1.1% (previous: 1.4%).
- Core PPI (MoM): 0.4% (previous: 1.0%).
INFLATION EXPECTATIONS (MICHIGAN) (MAY):
- 12-month Inflation Expectations: 4.6% (previous: 4.8%).
- 5-Year Inflation Expectations: 3.4% (previous: 3.9%).
GDP (U.S. Bureau of Economic Analysis, BEA) — Q1 2025 annualized growth rate, second estimate: +2.0% (Q4 2024: +0.5%); consensus forecast: +2.0%.
GDPNow (the Atlanta Fed’s real-time estimate of official GDP growth ahead of release): 3.0% (previous: 3.3%).
BUSINESS ACTIVITY INDEX (PMI) (MAY):
(Above 50 indicates expansion; below 50 indicates contraction)
- Services PMI: 50.7 (previous: 50.9).
- Manufacturing PMI: 55.1 (previous: 54.5).
- Composite PMI: 51.5 (previous: 51.7).
LABOR MARKET (BLS) (MAY)
- Unemployment Rate: 4.3% (previous: 4.3%).
- Continued Jobless Claims: 1.810K (previous: 1.795K).
- Initial Jobless Claims: 226K (previous: 229K).
- Nonfarm Payrolls (NFP): 172K (previous: 179K).
- Private Nonfarm Payrolls: 120K (previous: 177K).
- Average Hourly Earnings (YoY): 3.4% (previous: 3.6%).
- JOLTS Job Openings: 6.866 million (previous: 6.922 million).
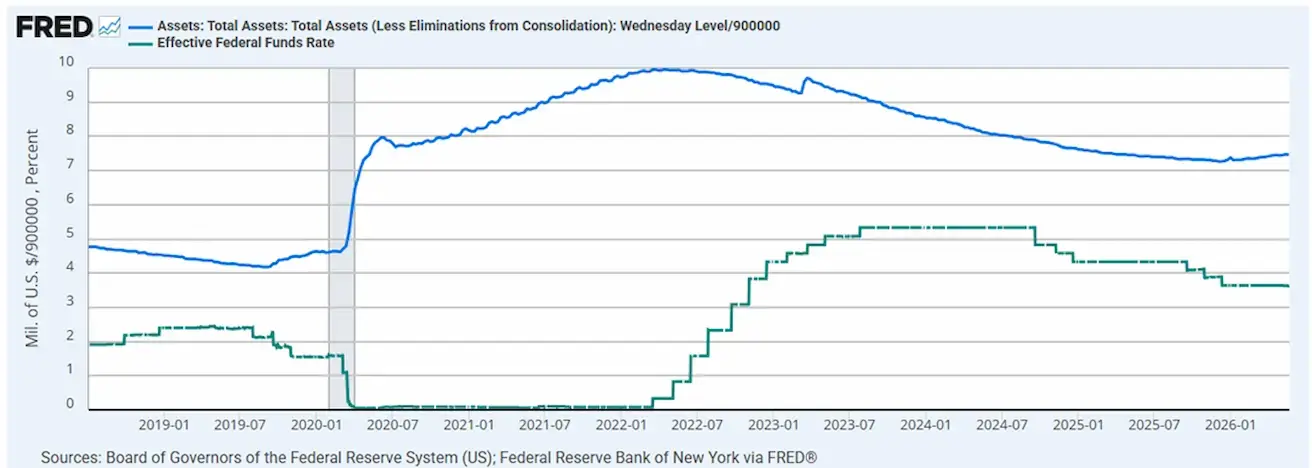
MONETARY POLICY
Effective Federal Funds Rate (EFFR): 3.50%–3.75%.
Federal Reserve Balance Sheet: $6.736 trillion, up 3.08% since the suspension of quantitative tightening (QT), when the balance sheet stood at $6.535 trillion.
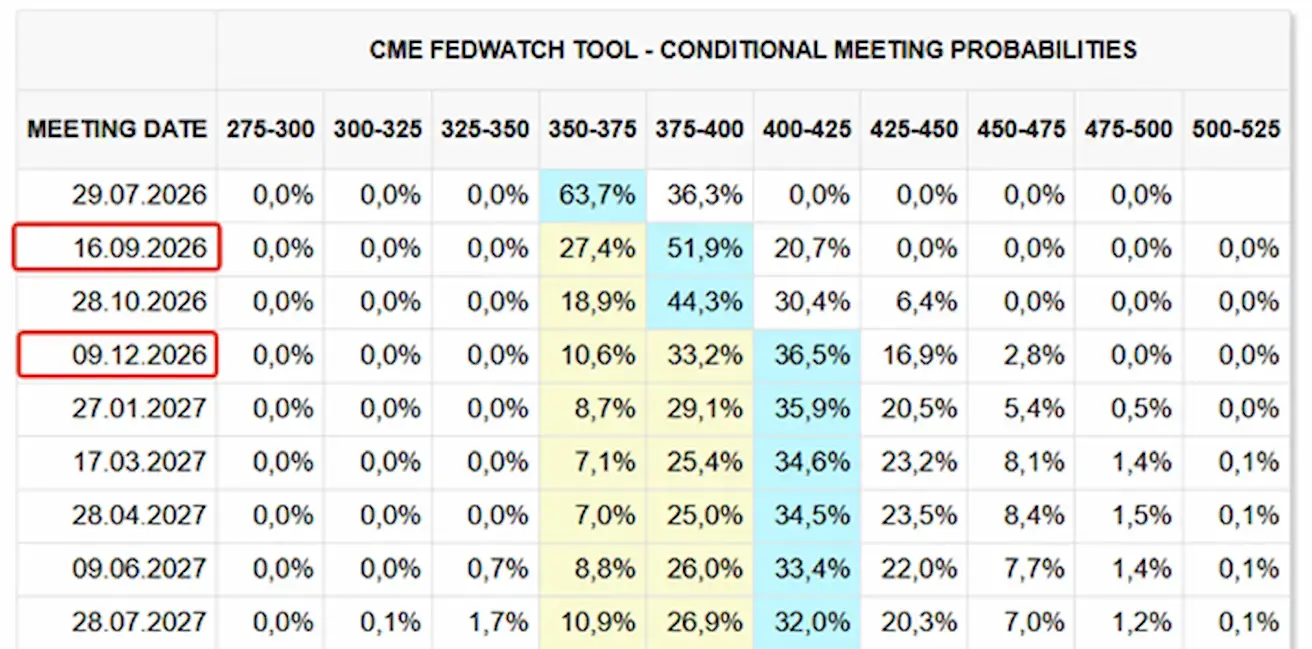
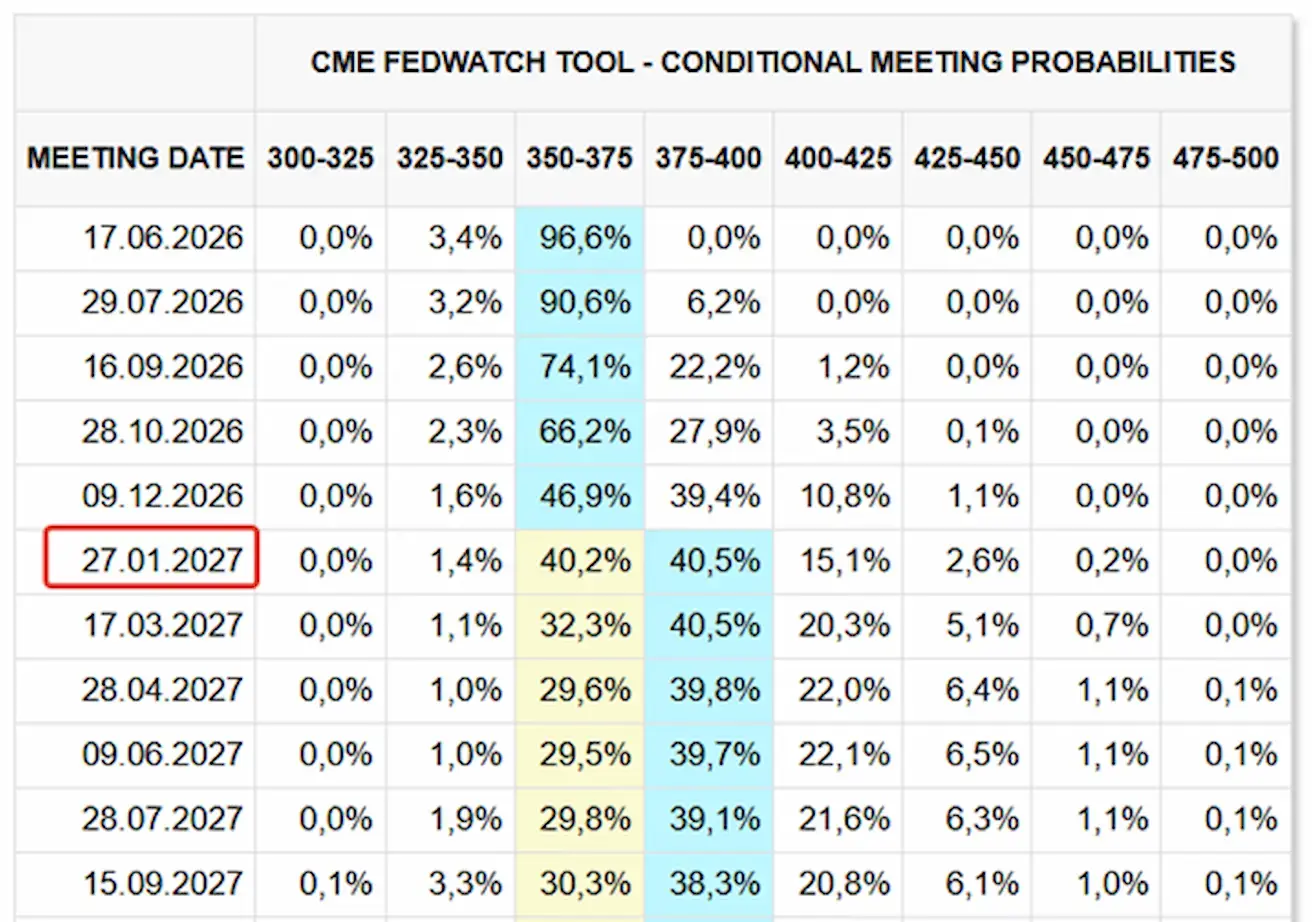
MARKET FORECAST FOR RATE (FEDWATCH)
For the next FOMC meeting (July 29), the implied market probability of a rate hike stands at 36.34%.
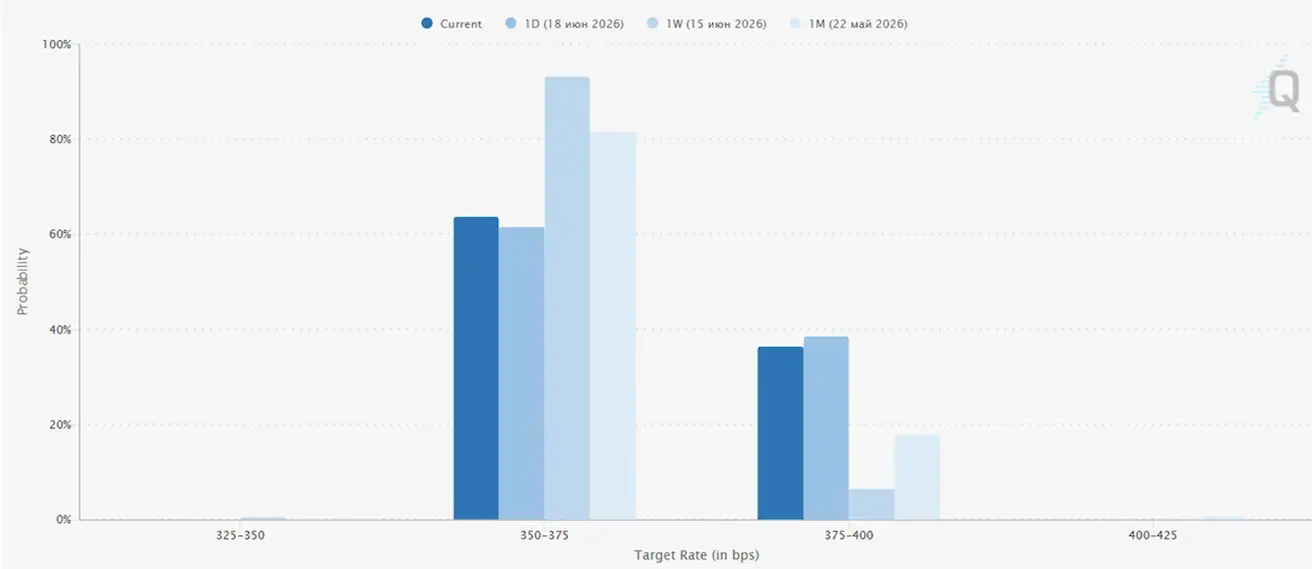
Over the next 12 months, the market is pricing in two 25-basis-point rate hikes, bringing the federal funds rate to a target range of 4.00–4.25%, potentially as early as this year.
Today and a week earlier:
Market
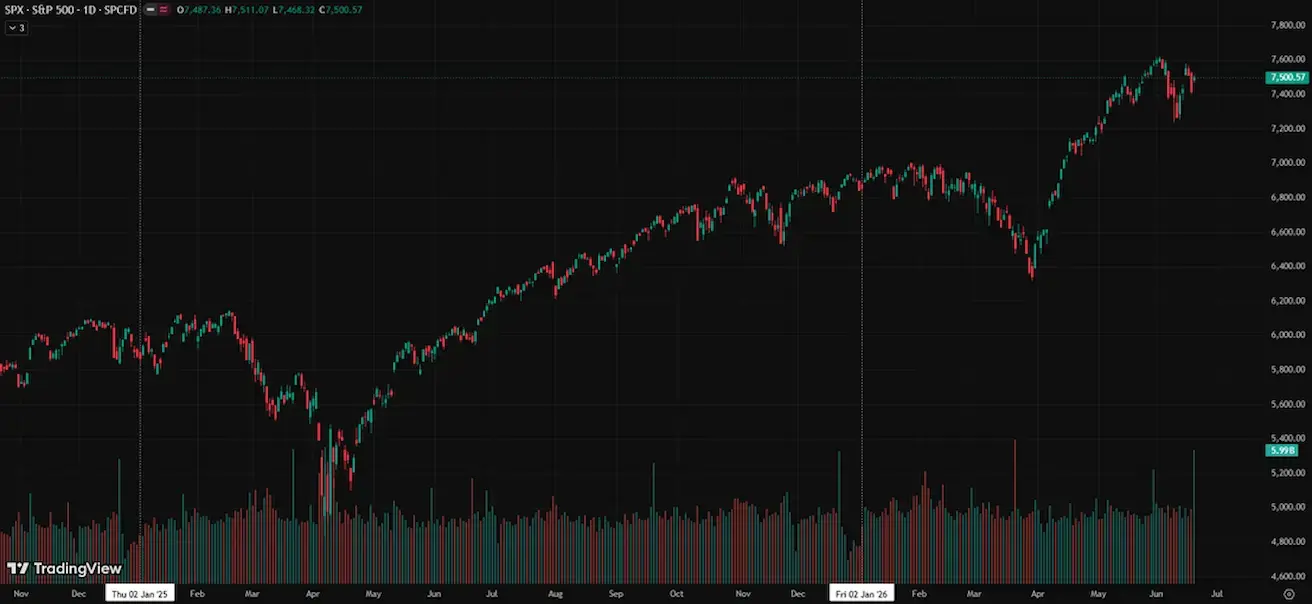
SP500
Weekly performance: +0,88% (week-end close: 7500,57); year-to-date: +9,57%.
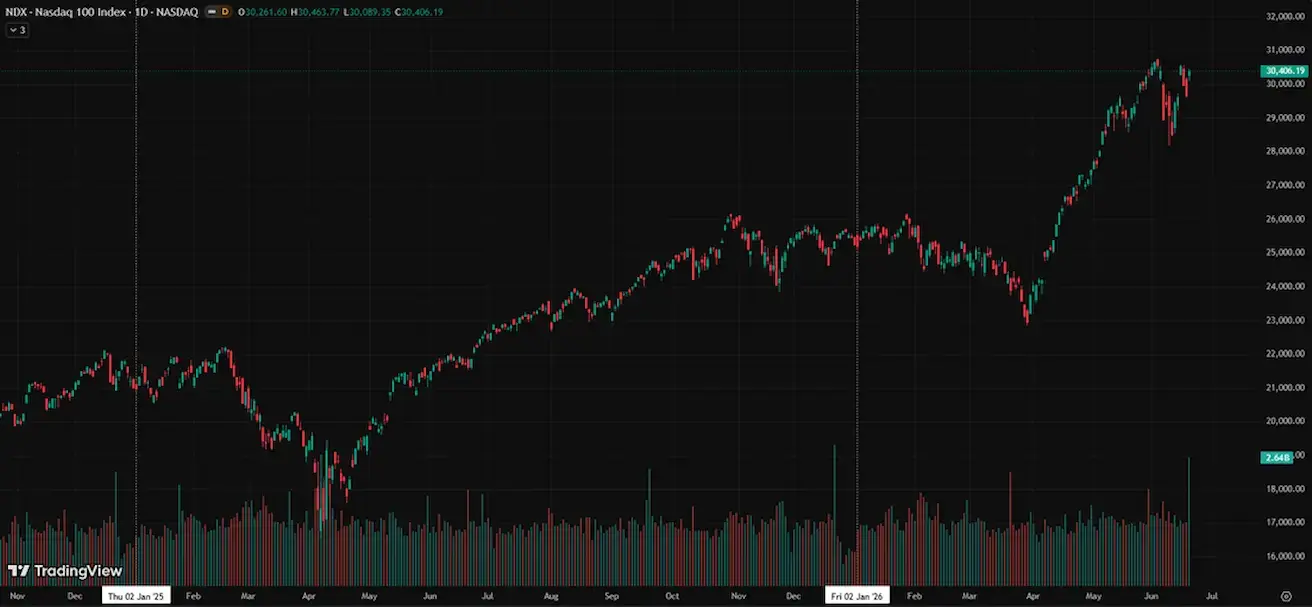
NASDAQ100
Weekly performance: +2,51% (week-end close: 30406,19); year-to-date: +20,42%.
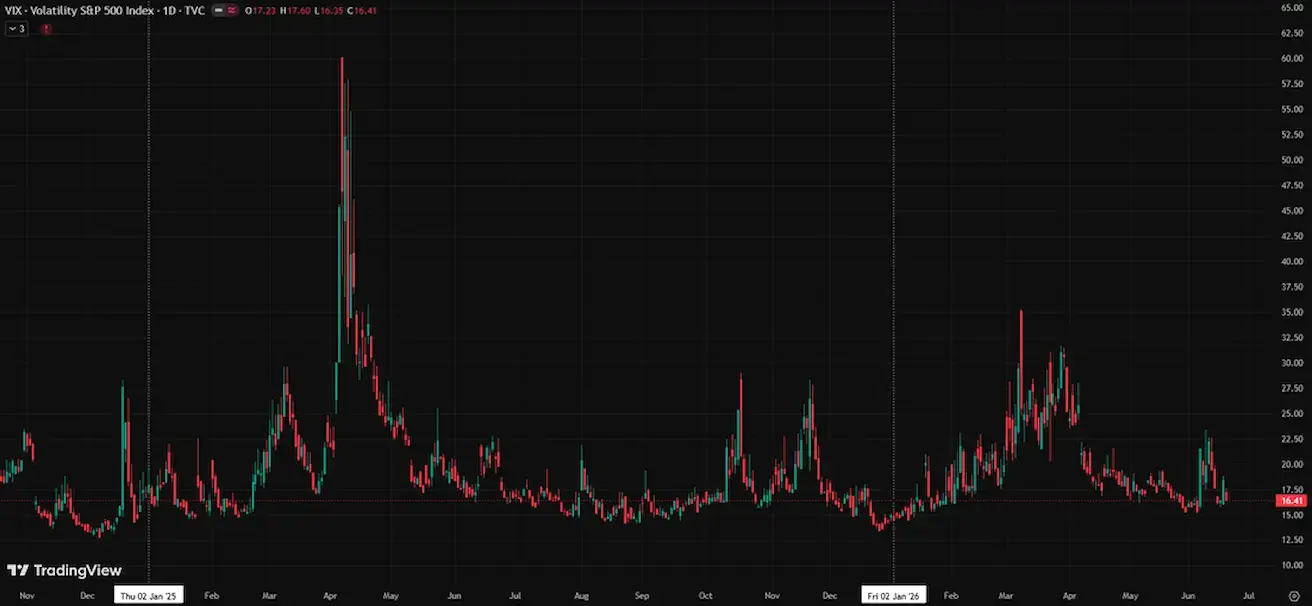
VIX
VIX (volatility index): week closing at 16,41 points.
Last week’s S&P 500 forecasts:
- Wells Fargo raised its year-end 2026 target for the S&P 500 to 7,800–8,000, and its year-end 2027 target to 8,600–8,800.
- Citigroup increased its year-end 2026 forecast for the S&P 500 to 8,100, up from its previous target of 7,700.
Eurozone
- The ECB raised interest rates, while maintaining a hawkish stance as inflationary risks continue to increase;
- Against the backdrop of the conflict in the Middle East, the ECB revised its GDP forecasts downward and raised its inflation projections for the coming years.
Interest Rates
- Deposit Facility Rate: 2.25% (previous: 2.0%);
- Marginal Lending Facility Rate: 2.65% (previous: 2.4%) — the rate at which banks can obtain overnight funding from the central bank;
- Main Refinancing Rate (Policy Rate): 2.40% (previous: 2.15%).
ECB Communication
- Inflation: Consumer Price Index (CPI) (May)
- Core CPI (YoY): 2.6% (previous: 2.2%);
- Headline CPI: 0.1% (MoM) (previous: 1.0%); 3.2% (YoY) (previous: 3.0%).
GDP (Q1 Preliminary Estimate)
- QoQ: -0.2% (previous: 0.1%);
- YoY: 0.3% (previous: 1.2%).
Unemployment Rate (May)
- 6.3% (previous: 6.3%).
Industrial Production (April)
- MoM: 0.1% (previous: 0.9%);
- YoY: 1.67% (previous: 1.37%).
Purchasing Managers’ Index (PMI) (May)
- Services PMI: 47.7 (previous: 47.6);
- Manufacturing PMI: 51.8 (previous: 52.2);
- S&P Global Composite PMI: 48.5 (previous: 48.8).
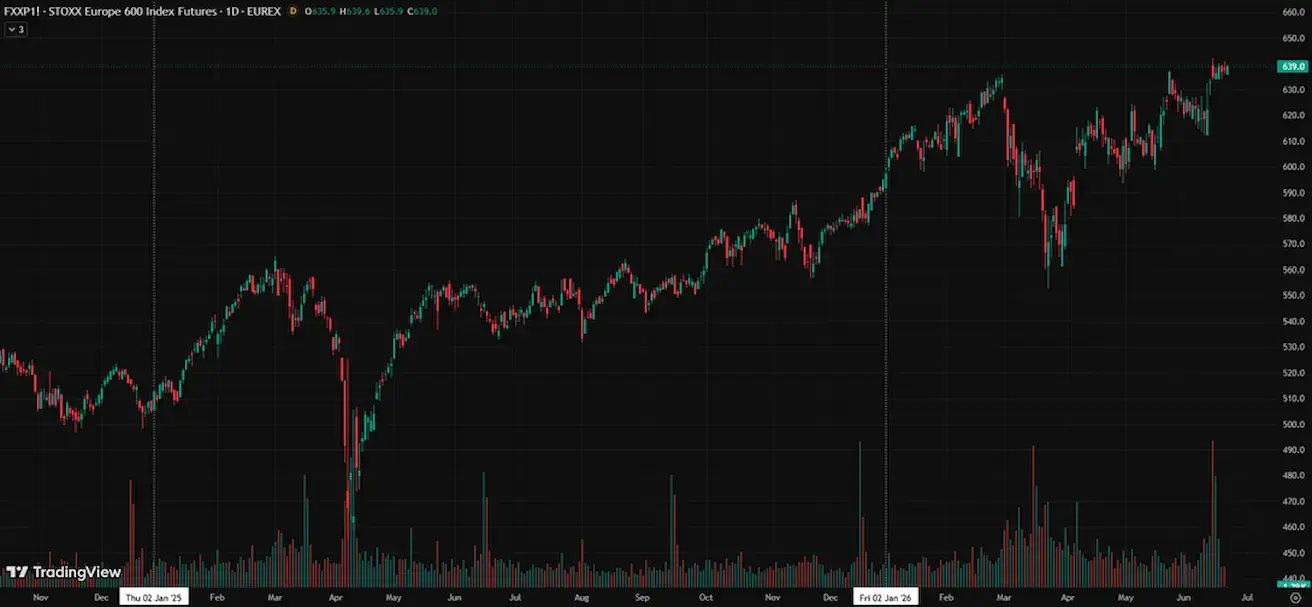
EURO STOXX 600 (FXXP1!)
Weekly performance: +0,79% (week-end close: 637,9); year-to-date: +7,39%.
Goldman Sachs, Barclays, and Société Générale S.A. raised their forecasts for the European equity market through year-end 2026.
The revisions were driven by easing geopolitical tensions and the sharp decline in oil prices following agreements reached in the Middle East. This development is particularly significant for Europe, as the region remains a major importer of energy resources. Lower energy costs help mitigate inflationary pressures and support corporate profitability.
China
China’s economy continues to stabilize, supported by strong export performance, while domestic demand and investment are gradually recovering. Policymakers remain measured and targeted in their approach to economic stimulus.
- Interest rates remain unchanged;
- Monetary policy remains accommodative;
- China reaffirmed its commitment to fiscal support for economic growth under its 2026 plan, including measures to stimulate domestic demand, optimize tax incentives and subsidies, and modernize industrial capacity.
Interest Rates
- 1-Year Loan Prime Rate (medium-term lending): 3.00%;
- 5-Year Loan Prime Rate (benchmark for mortgage lending): 3.50%.
Inflation Indicators (May)
- Consumer Price Index (CPI): -0.1% MoM (previous: 0.3%); 1.2% YoY (previous: 1.3%);
- Producer Price Index (PPI): 3.9% YoY (previous: 2.8%).
Trade Data (May)
- Imports: 27.4% YoY (previous: 25.3%);
- Exports: 19.4% YoY (previous: 14.1%);
- Trade Balance (USD): $105.43 billion (previous: $84.80 billion).
GDP (Q1 2026)
- QoQ: 1.3% (previous: 1.2%);
- YoY: 5.0% (previous: 4.5%).
Labor Market
- Unemployment Rate (May): 5.1% (previous: 5.2%).
Industrial Activity
- Industrial Production (May, YoY): 4.5% (previous: 4.1%).
Fixed Asset Investment
- May, YoY: -4.1% (previous: -1.6%).
Retail Sales
April, YoY: 0.9% (previous: 1.3%).
Purchasing Managers’ Indices (PMI) (May)
- Manufacturing PMI: 50.0 (previous: 50.3);
- Non-Manufacturing PMI: 50.1 (previous: 49.4);
- Composite PMI: 50.5 (previous: 50.1).
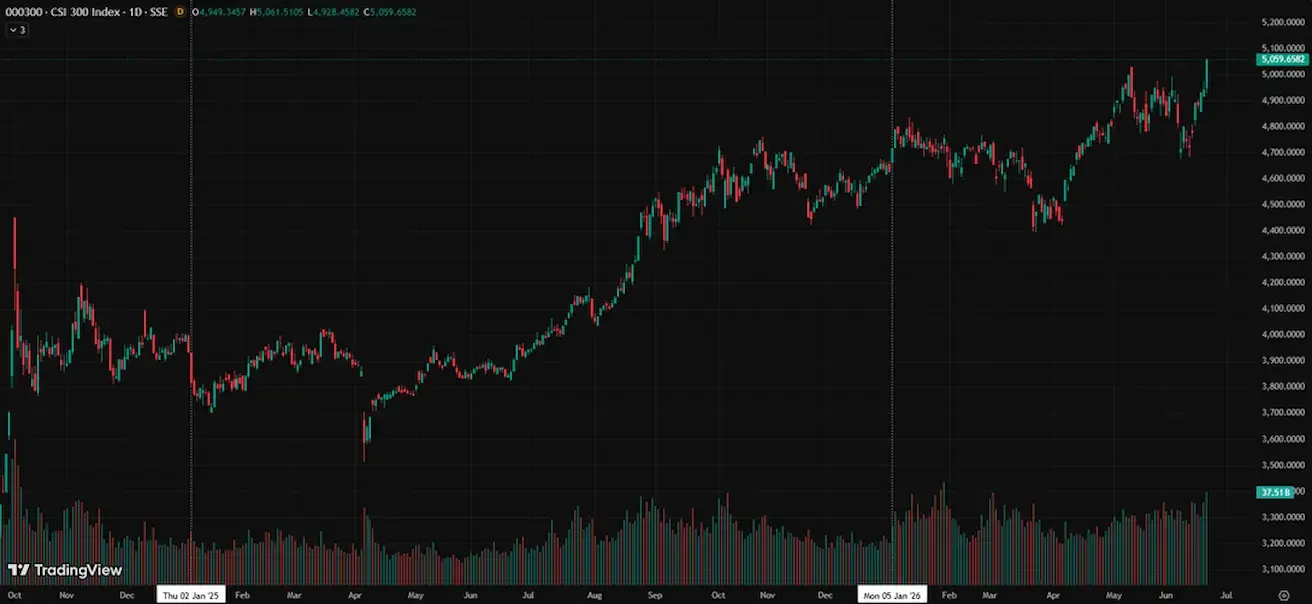
CSI 300 INDEX (000300.HK)
Weekly performance: +3,44% (week-end close: 4941,59); year-to-date: +6,01%. The market is up 2.5% during today’s Asian trading session.
The People’s Bank of China (PBOC) has introduced a new facility designed to encourage the use of the renminbi by foreign central banks and sovereign wealth funds.
The mechanism is broadly analogous to the U.S. Federal Reserve’s FIMA Repo Facility:
- Foreign central banks can purchase Chinese government bonds;
- The PBOC will be able to provide renminbi liquidity against these holdings when needed, without requiring the bonds to be sold;
- Eligible collateral includes Chinese government bonds, policy bank bonds, and PBOC-issued securities;
- Available maturities are 7 days, 1 month, and 3 months.
Why does this matter? Until now, one of the key obstacles to the internationalization of the renminbi has been that, while foreign institutions could hold Chinese bonds, obtaining liquidity against those assets was considerably less convenient than within the U.S. dollar system. China is now creating its own liquidity backstop for foreign holders of renminbi reserves, modeled on the Federal Reserve's framework.
This represents another important piece of financial infrastructure in China’s long-term effort to establish the renminbi as a fully fledged reserve currency. Beijing has been steadily building many of the foundations that have made the U.S. dollar so attractive for decades: a deep government bond market, international payment infrastructure, currency swap arrangements, and now a mechanism providing emergency liquidity to foreign central banks.
That said, the scale remains far smaller than that of the dollar-based financial system. The U.S. dollar still accounts for roughly 50% of global SWIFT payments, while the renminbi continues to trail well behind both the dollar and the euro. As a result, this should be viewed primarily as a long-term strategic initiative with a 10–20 year horizon, rather than a development likely to materially influence financial markets over the coming quarters.
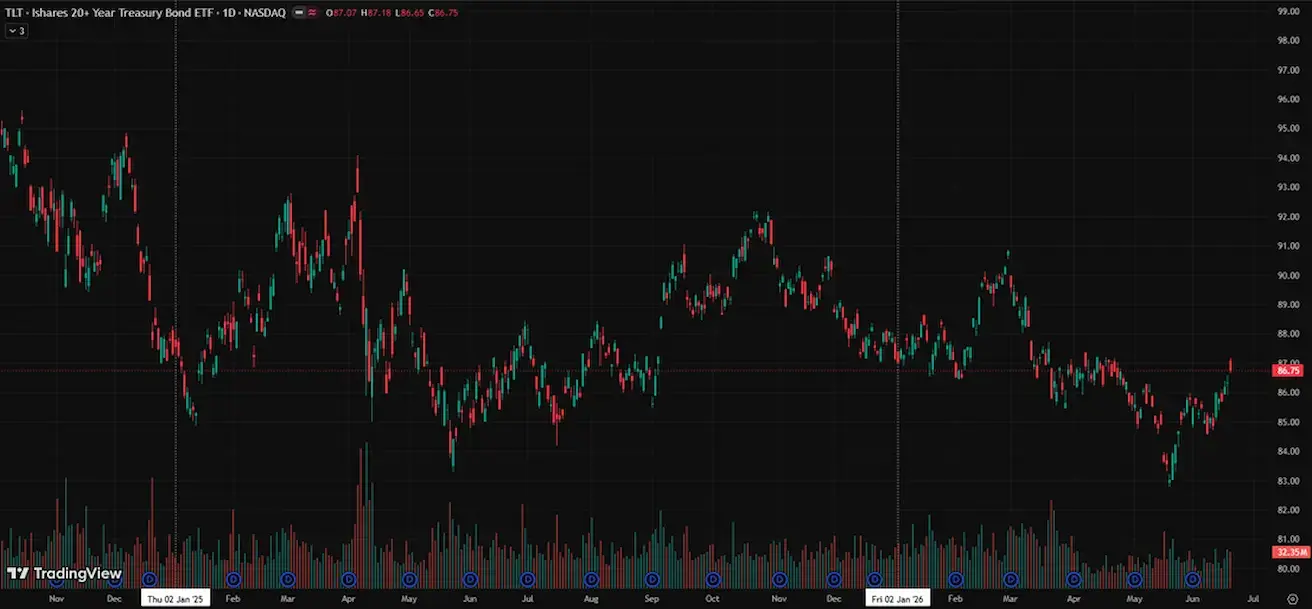
BOND MARKET
U.S. Treasury Bonds 20+ Years (TLT ETF): +1,14% for the week (weekly close: 86,75); -0,47% year-to-date.
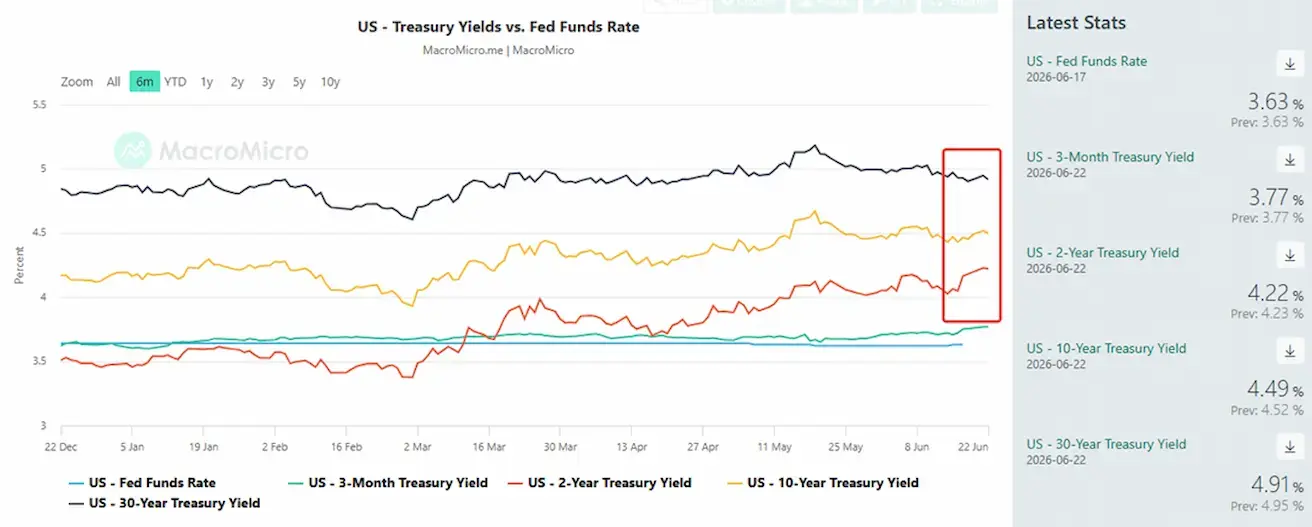
YIELDS AND SPREADS
Treasury yields moved higher following the Fed meeting, with the increase particularly pronounced at the 2-year maturity, suggesting markets are pushing back against expectations for future rate cuts.
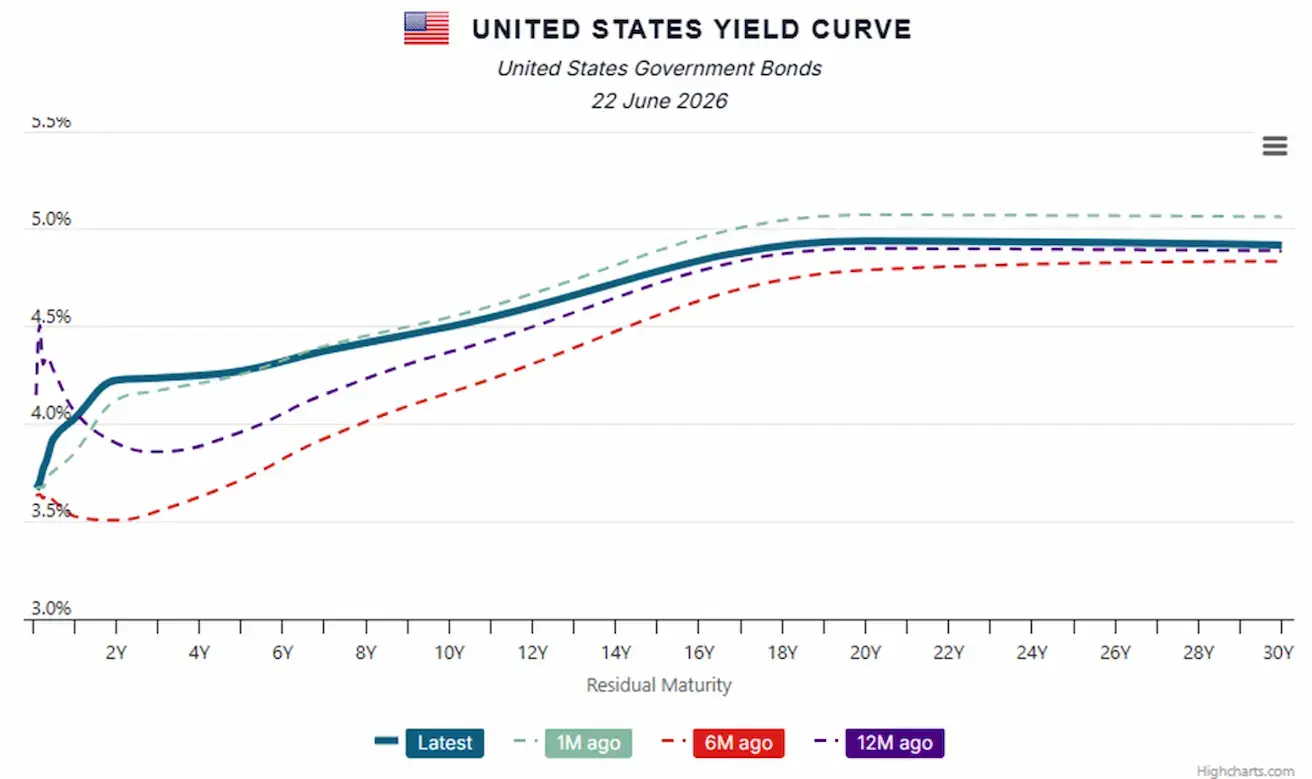
The entire yield curve now sits above the Federal Reserve’s policy rate. Such a curve shape is typically associated not with recessionary conditions, but with a phase in which the economy continues to expand while investors demand a higher term premium to compensate for long-term risks, including inflation, fiscal deficits, and the growing stock of government debt.
- Market Yield on U.S. Treasury Securities at 10-Year Constant Maturity: 4.49% (previous: 4.42%);
- 2-Year U.S. Treasury Yield: 4.22% (previous: 4.03%);
- ICE BofA BBB US Corporate Index Effective Yield: 5.39% (previous: 5.33%).
- The yield spread between 10-year and 2-year U.S. Treasury securities stands at 27 basis points (previous: 39 bps);
- The yield spread between 10-year and 3-month U.S. Treasury securities stands at 72 basis points (previous: 70 bps).
The cost of a 5-year U.S. Credit Default Swap (CDS) — a market-based measure of sovereign default insurance — rose to 39.22 basis points, compared with 38.21 basis points a week earlier.
U.S. Treasury Yield Curve:
GOLD FUTURES (GC)
Weekly performance: +1,97% (week close: $4161,9 per troy oz); year-to-date: -3,93%
World Gold Council: “2026 Central Bank Gold Reserves Survey” (June 16, 2026):
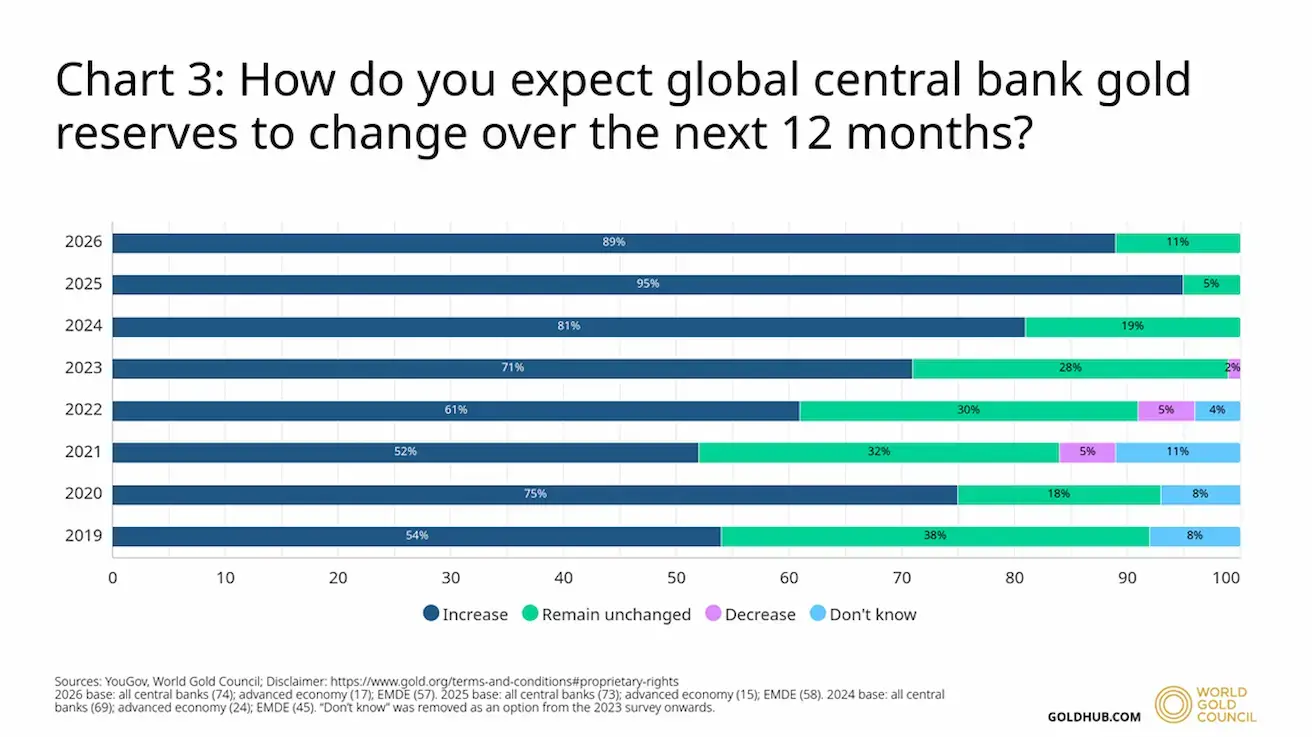
In response to a question regarding expectations for changes in global central bank gold reserves over the next 12 months, respondents were nearly unanimous: 89% believe that official gold reserves will continue to increase.
This view was shared by respondents from both advanced economies and emerging markets. It is also noteworthy that 11% of central banks expect the share of gold within their total reserves to remain unchanged, compared with 5% in the previous year.
Furthermore, 45% of respondents believe that the gold reserves held by their own institutions will increase over the next year, broadly in line with last year’s figure of 43%. This represents a new record high for the proportion of central banks anticipating an expansion of their gold holdings.
The findings indicate that sentiment toward gold among central banks remains highly positive. Expectations point to continued gold purchases over the next 12 months, reflecting sustained confidence in gold’s strategic role amid an evolving geopolitical and macroeconomic landscape.
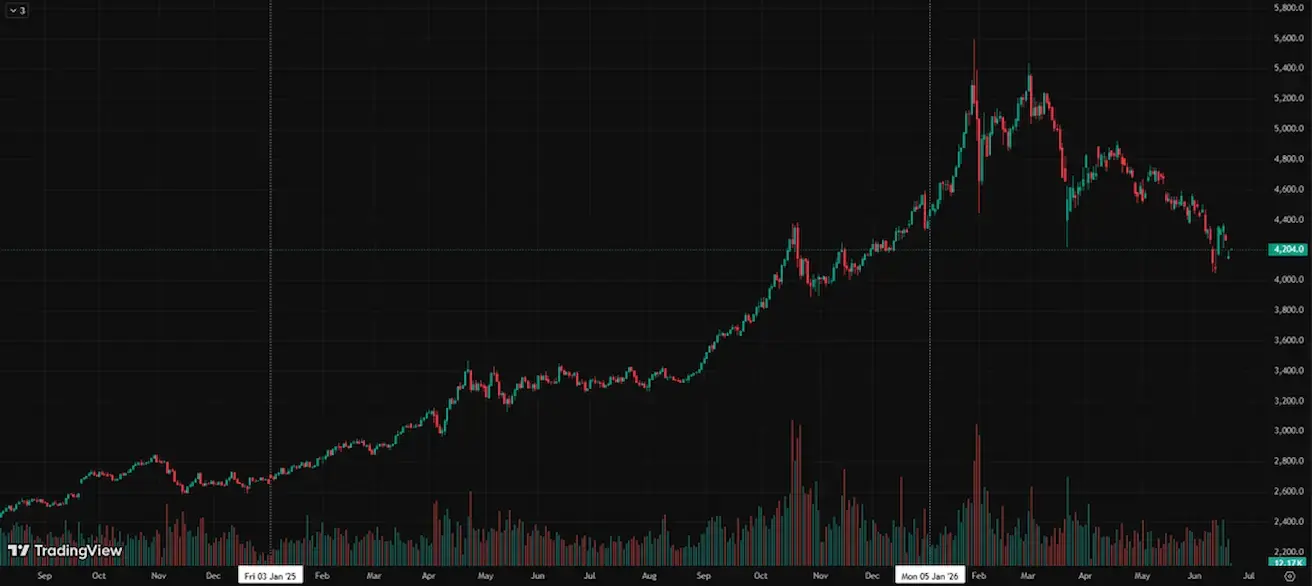
OIL FUTURES
Weekly performance: -10,64% (week close: $75,47 per barrel); year-to-date: +32,12%
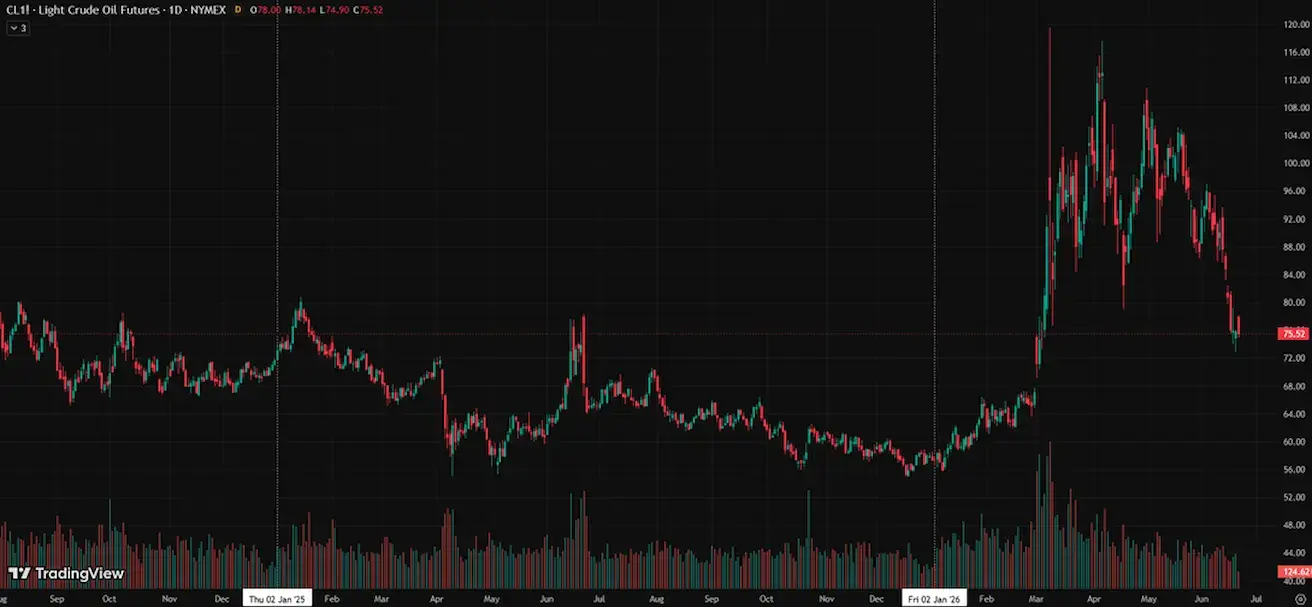
IEA Monthly Oil Market Report:
- The IEA revised its forecast for the decline in global oil demand in 2026 upward, from 0.4 million barrels per day (mb/d) to 1.1 mb/d. For 2027, the Agency expects demand growth to recover, increasing by 2.2 mb/d;
- The IEA also projects a 3.9 mb/d decline in global oil supply in 2026, followed by a recovery in 2027.
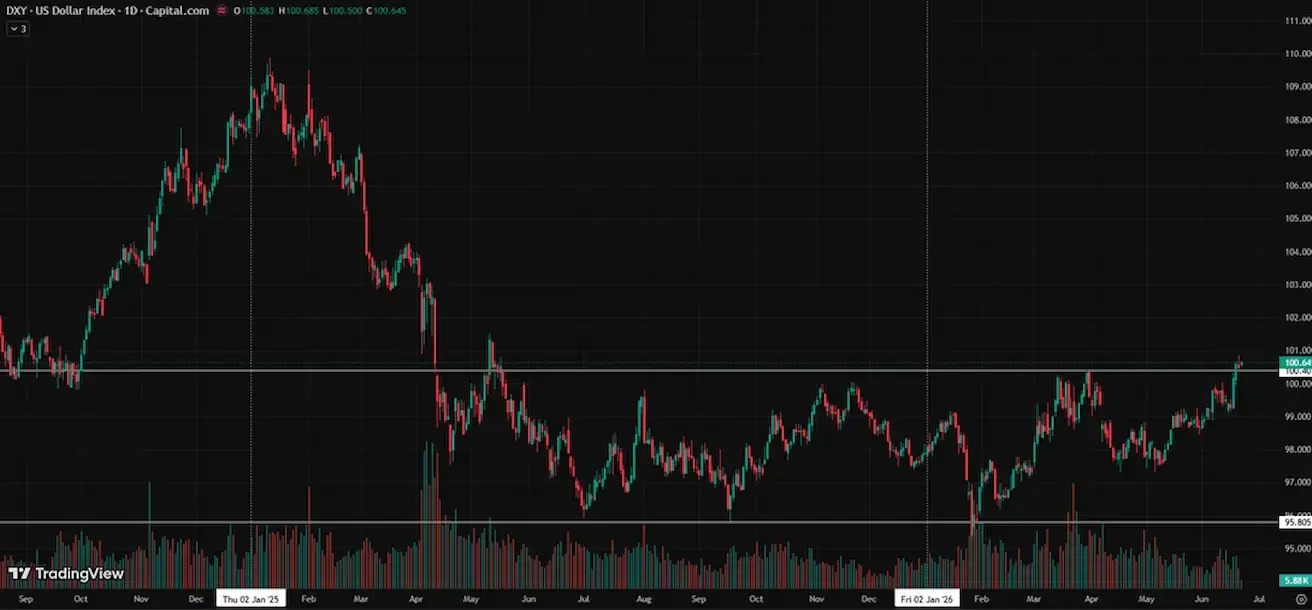
DOLLAR INDEX FUTURES (DX)
Weekly performance: +0,98% (week close: 100,499); year-to-date: +2,56%.
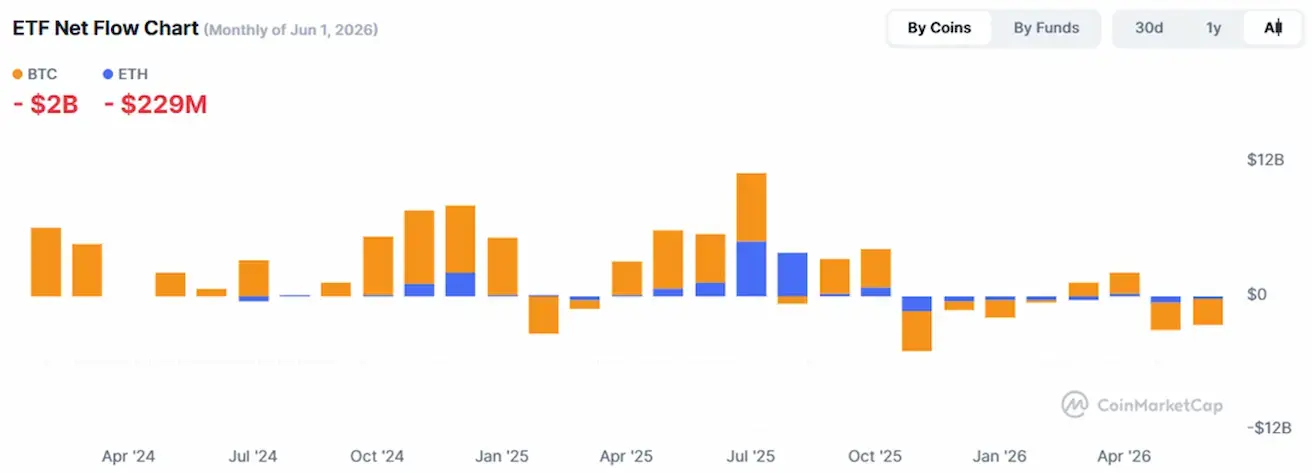
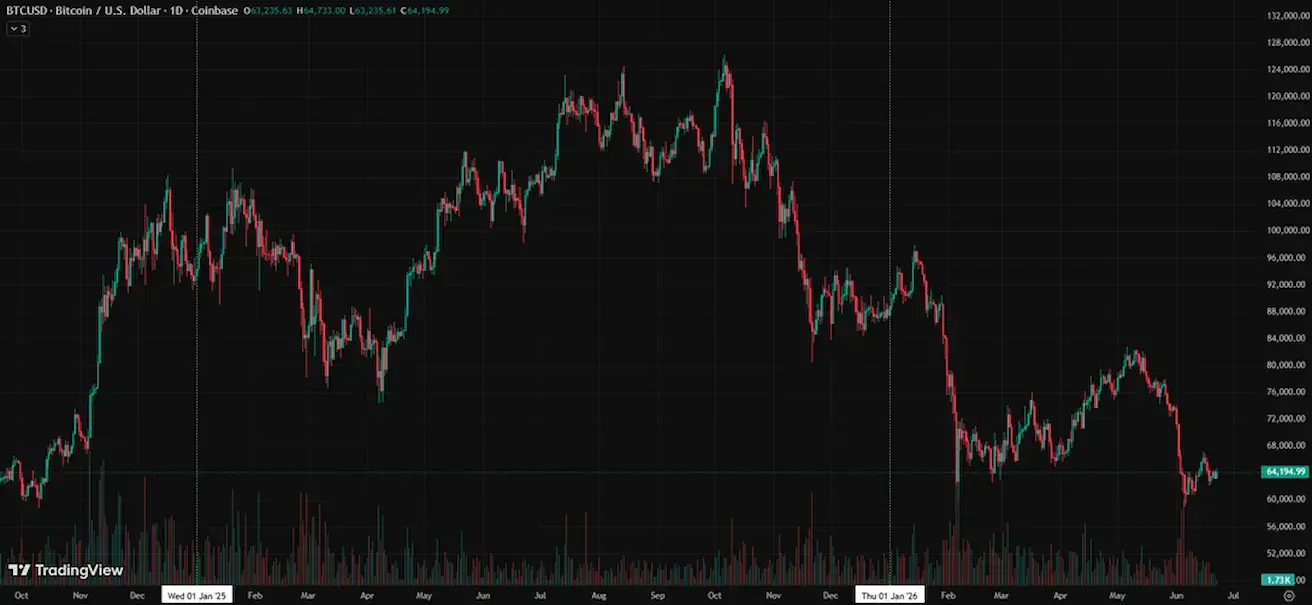
BTC FUTURES
Weekly performance: -3,76% (week close: $63235,63); year-to-date: -27,91%.
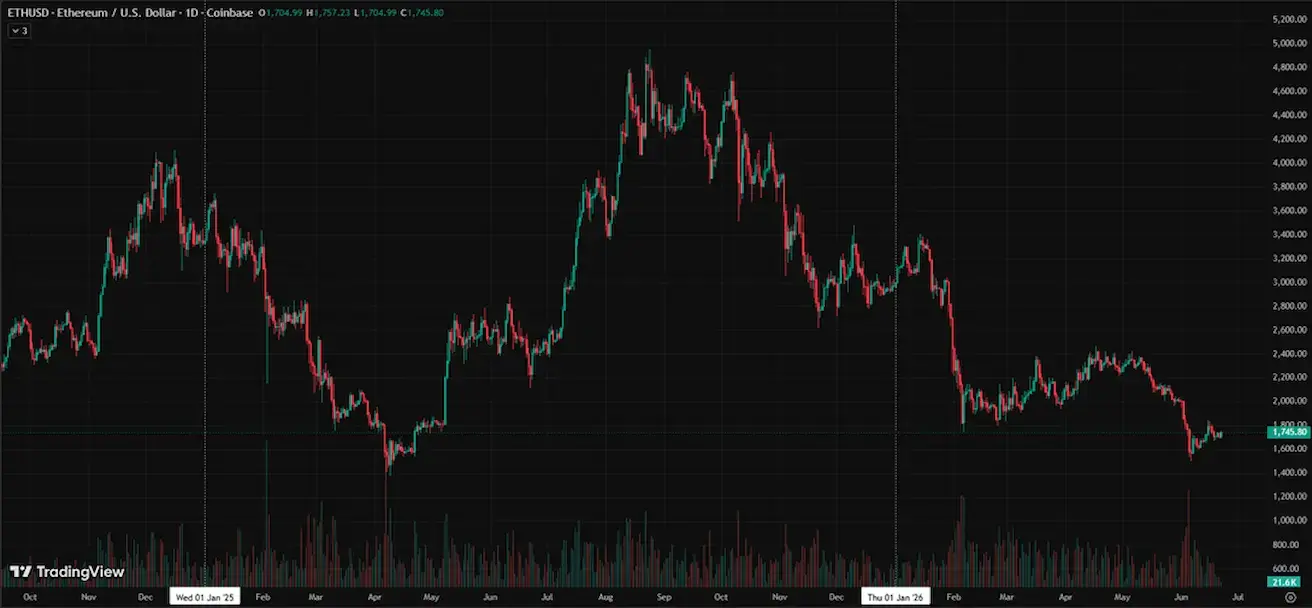
ETH FUTURES
Weekly performance: -1,11% (week close: $1704,8); year-to-date: -42,67%.
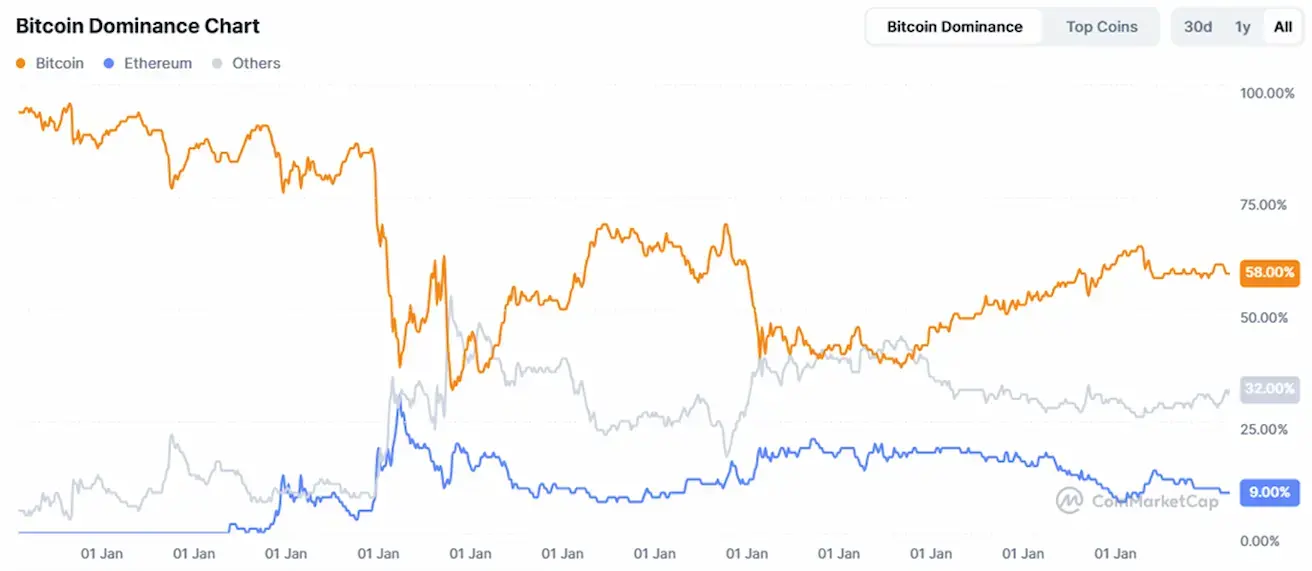
TOTAL CRYPTOCURRENCY MARKET CAPITALIZATION
Total crypto market capitalization: $2,2 trillion (vs $2,24 trillion a week earlier) (coinmarketcap.com).
Crypto asset market shares:
- Bitcoin 58,4% (prev. (58,8%)
- Ethereum 9,6% (prev. 9,3%)
- Others 32,1% (prev. 31,9%)
ETF Net Flows Chart: