Lietuvių
 Русский
 Қазақша
 Eesti
EestiJune 8 – 14, 2026: Weekly economic update
Key market updates

Key Takeaways:
- The policy rate remains unchanged, while the Fed maintains a cautious tone.
- Monetary policy remains moderately restrictive.
- U.S. macroeconomic data continue to support the soft-landing scenario. Inflation risks are rising, while the labor market is cooling without showing signs of recession and, at this stage, does not warrant a rate cut.
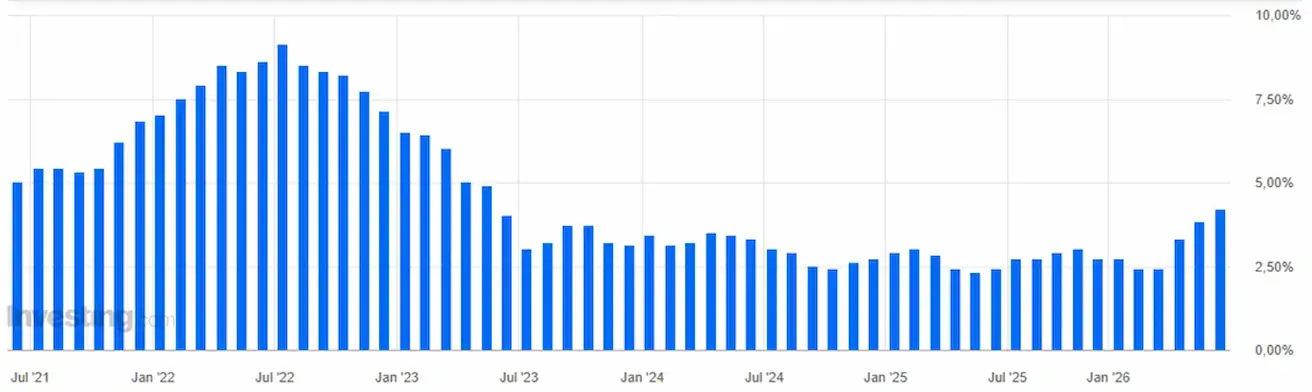
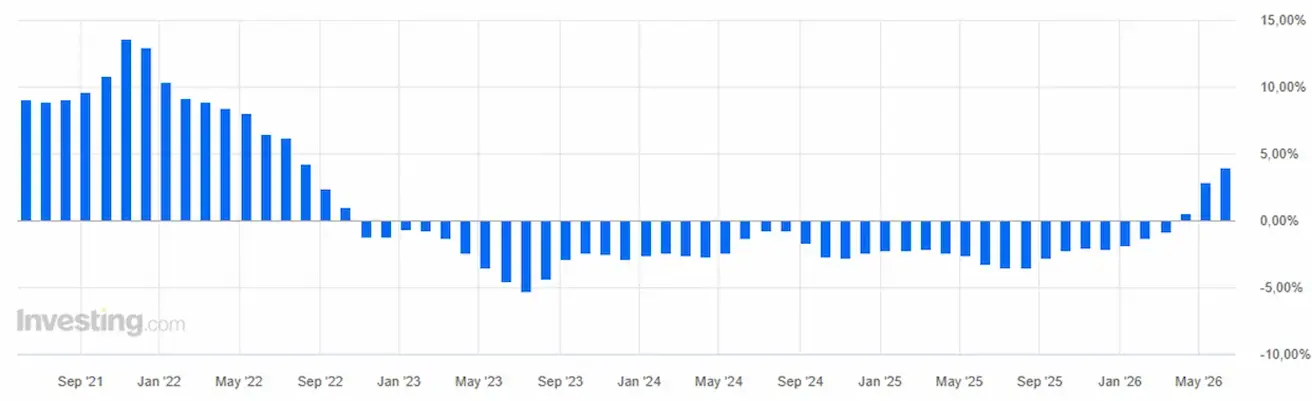
INFLATION: CONSUMER PRICE INDEX (MAY):
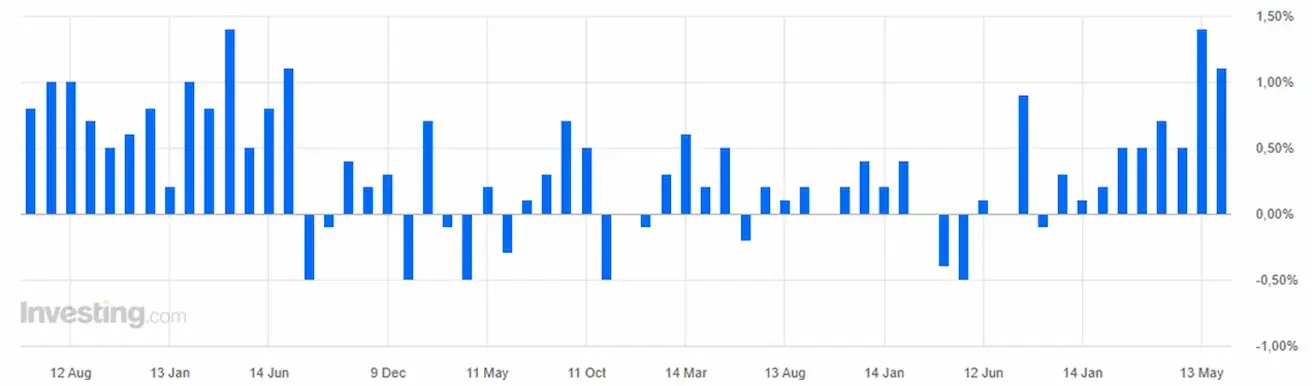
- Core CPI (MoM): 0.2% (previous: 0.4%).
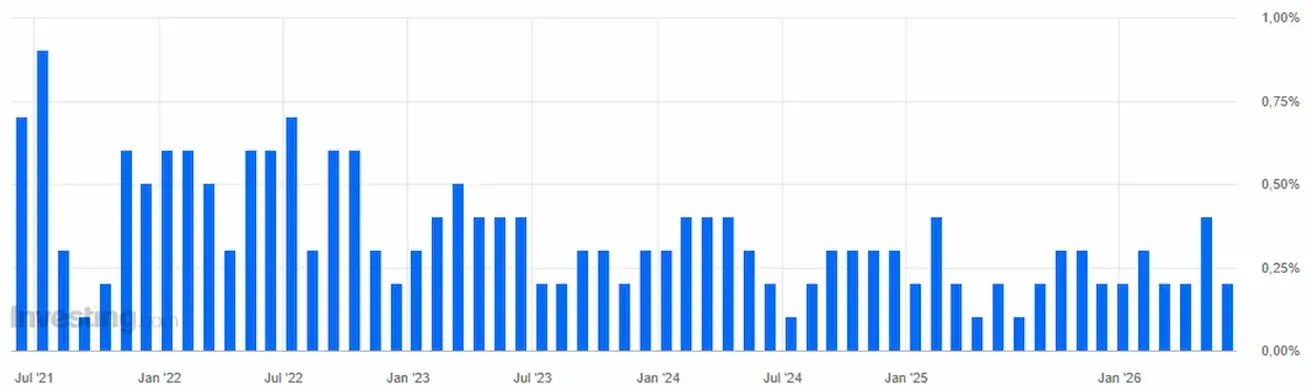
- Core CPI (YoY): 2.9% (previous: 2.8%).
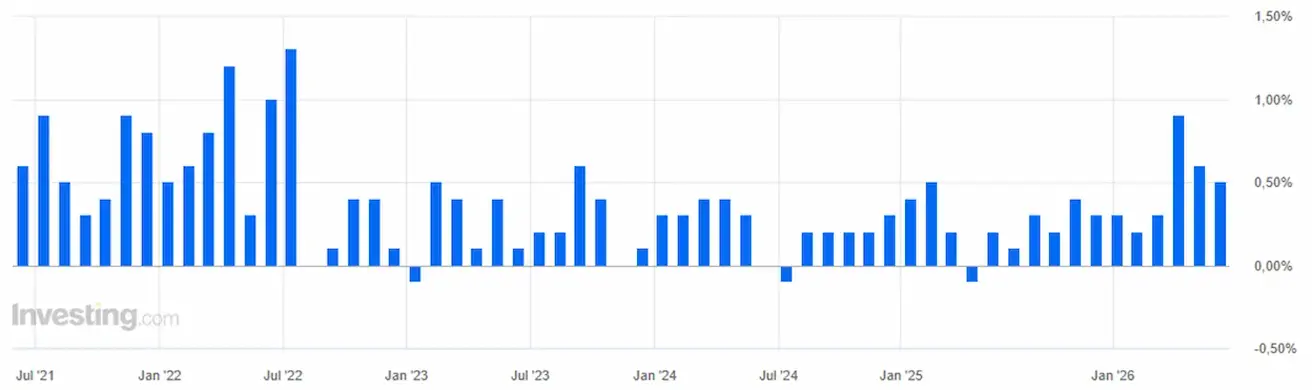
- CPI (MoM): 0.5% (previous: 0.6%).
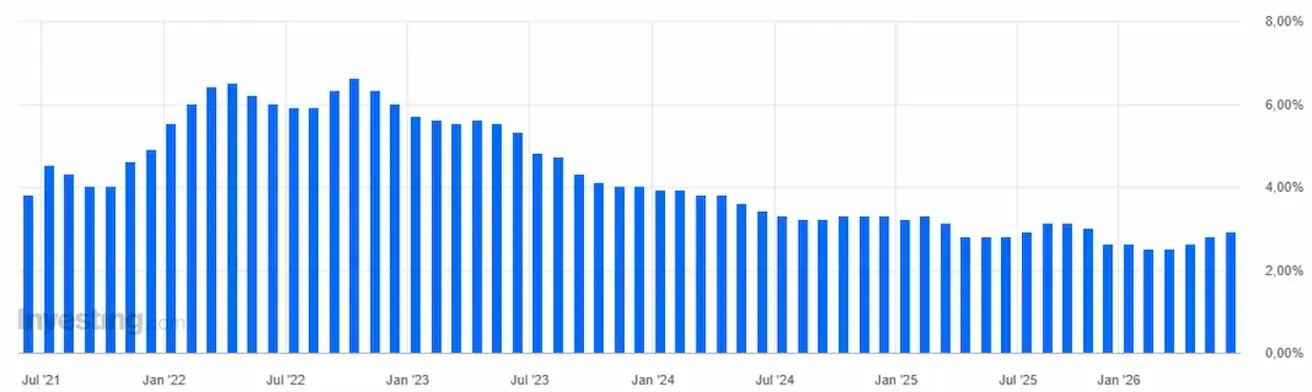
- CPI (YoY): 4.2% (previous: 3.8%).
PRODUCER PRICE INDEX (MAY):
- PPI (MoM): 1.1% (previous: 1.4%).
- Core PPI (MoM): 0.4% (previous: 1.0%).
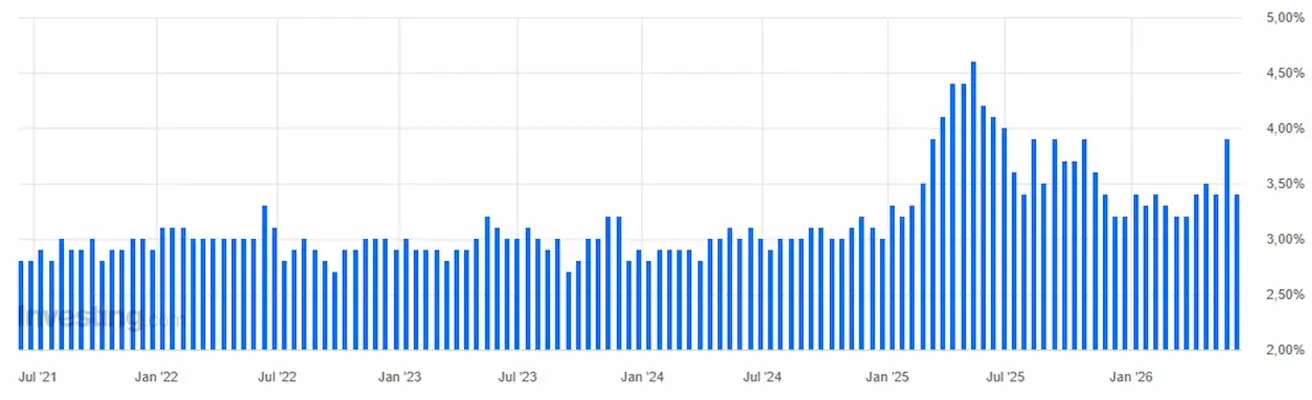
INFLATION EXPECTATIONS (MICHIGAN) (MAY):
- 12-month Inflation Expectations: 4.6% (previous: 4.8%).
- 5-Year Inflation Expectations: 3.4% (previous: 3.9%).
GDP (U.S. Bureau of Economic Analysis, BEA) — Q1 2025 annualized growth rate, second estimate: +2.0% (Q4 2024: +0.5%); consensus forecast: +2.0%.
GDPNow (the Atlanta Fed’s real-time estimate of official GDP growth ahead of release): 3.3% (previous: 3.0%).
BUSINESS ACTIVITY INDEX (PMI) (MAY):
(Above 50 indicates expansion; below 50 indicates contraction)
- Services PMI: 50.7 (previous: 50.9).
- Manufacturing PMI: 55.1 (previous: 54.5).
- Composite PMI: 51.5 (previous: 51.7).
LABOR MARKET (BLS) (MAY)
- Unemployment Rate: 4.3% (previous: 4.3%).
- Continued Jobless Claims: 1.795 million (previous: 1.786 million).
- Initial Jobless Claims: 229K (previous: 225K).
- Nonfarm Payrolls (NFP): +172K (previous: +179K).
- Private Nonfarm Payrolls: +120K (previous: +177K).
- Average Hourly Earnings (YoY): 3.4% (previous: 3.6%).
- JOLTS Job Openings: 6.866 million (previous: 6.922 million).
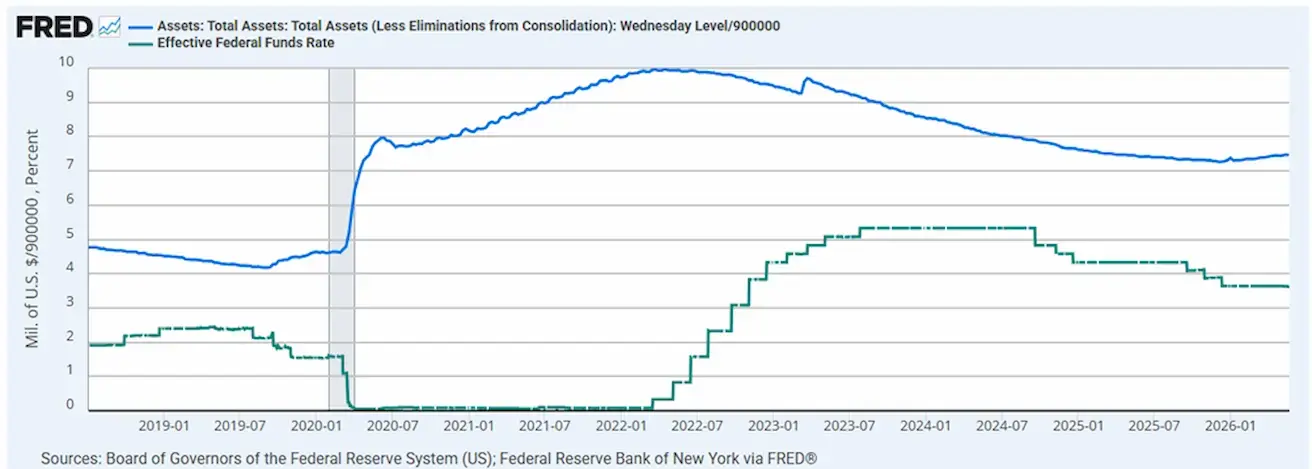
MONETARY POLICY
Effective Federal Funds Rate (EFFR): 3.50%–3.75%.
Federal Reserve Balance Sheet: $6.725 trillion, up 2.91% since the suspension of quantitative tightening (QT) ($6.535 trillion).
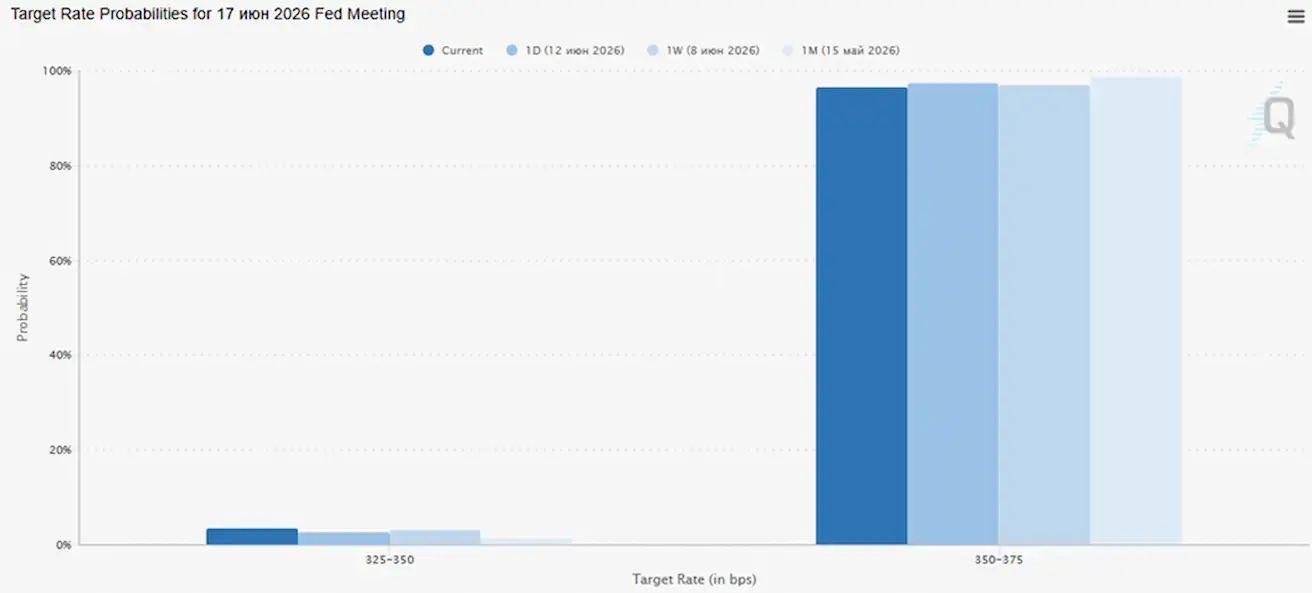
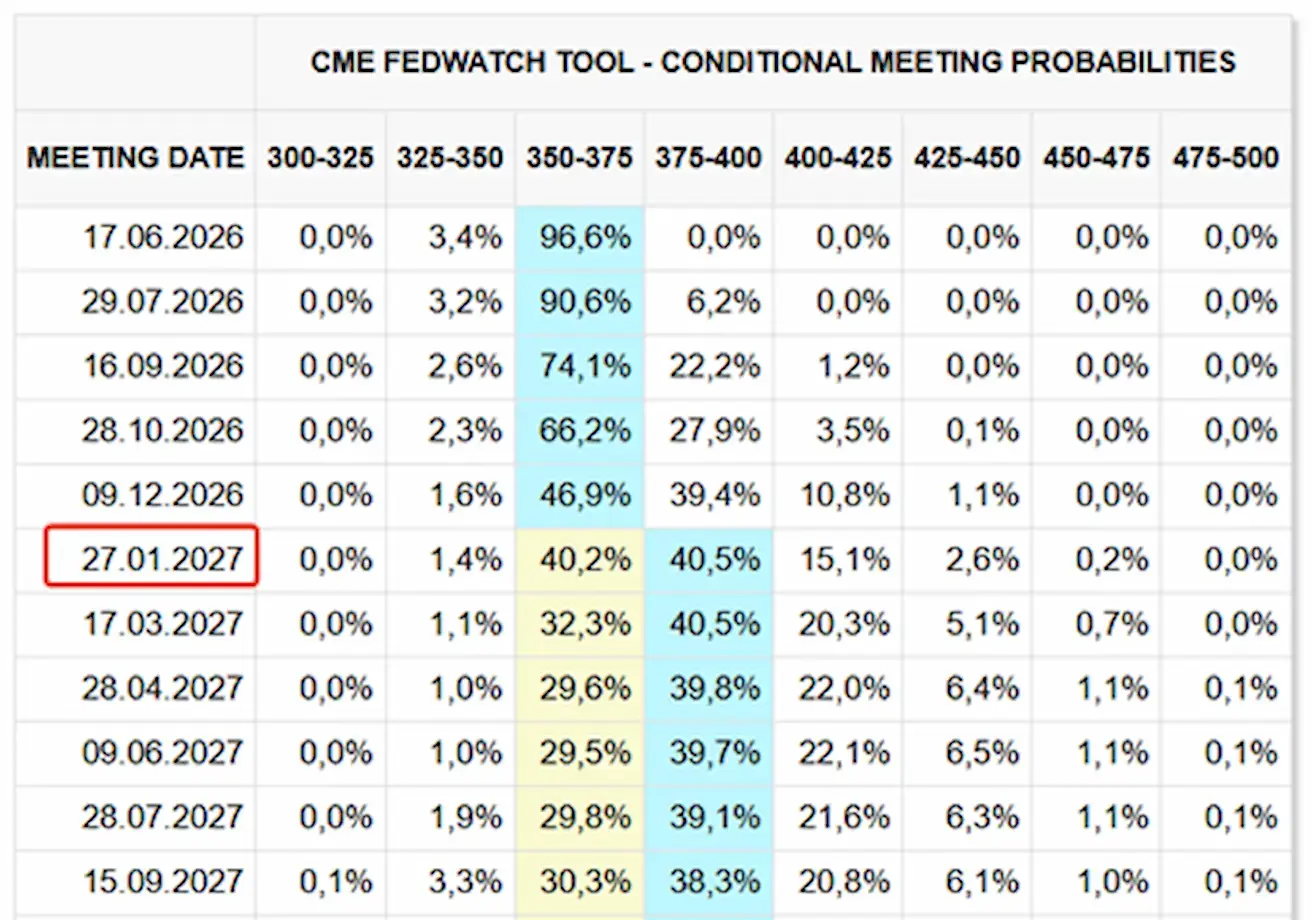
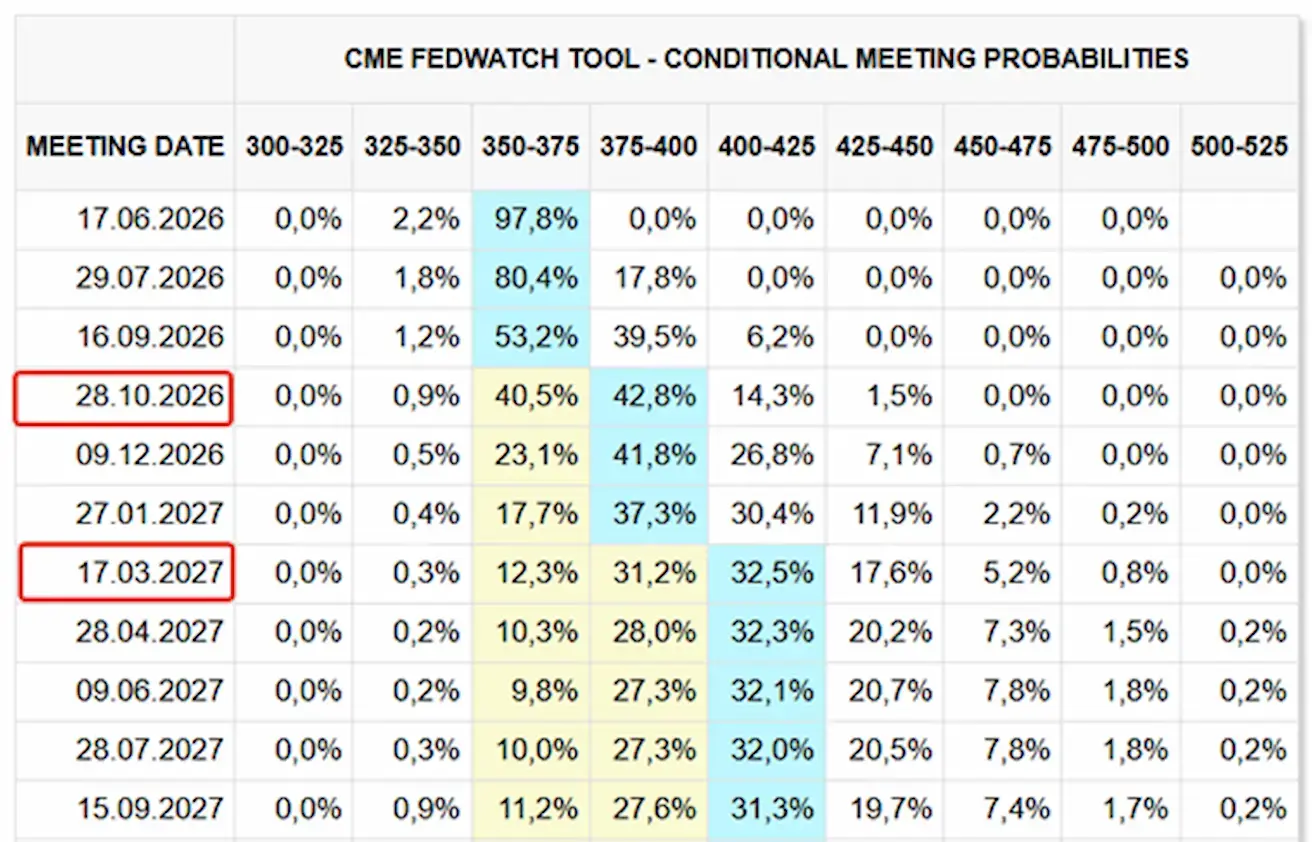
MARKET FORECAST FOR RATE (FEDWATCH)
Ahead of the next FOMC meeting (June 17), the market is pricing in no change to the policy rate, with an implied probability of 96.59% that the current target range will be maintained.
Today and a week earlier:
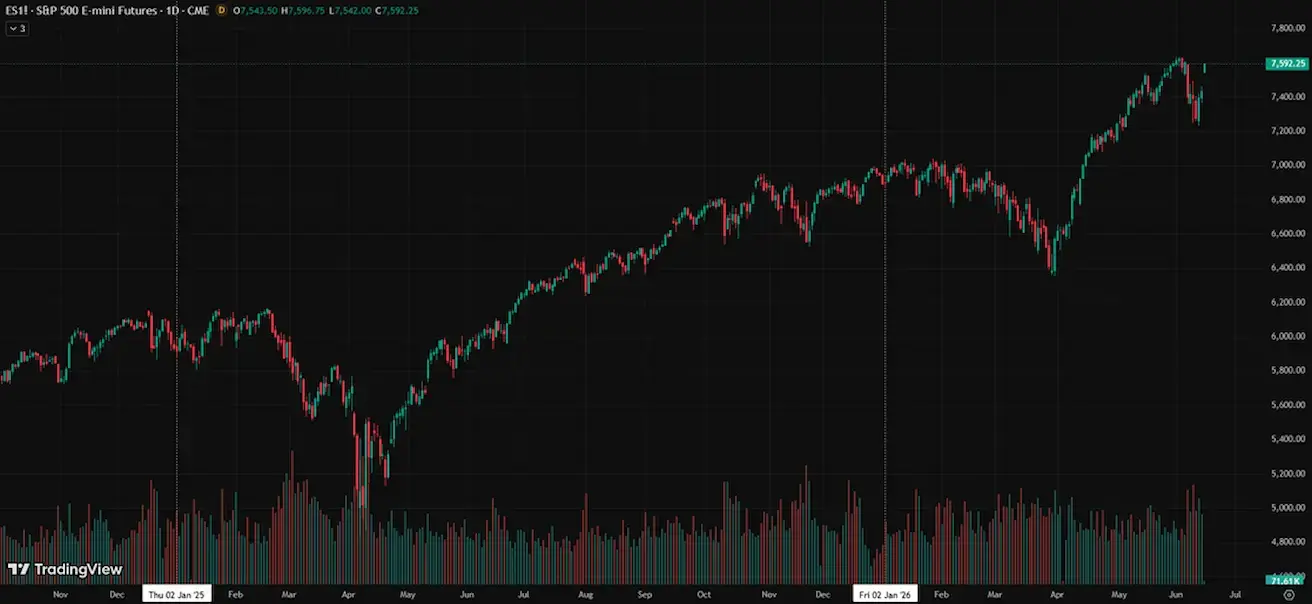
SP500
Weekly performance: +0,69% (week-end close: 4735,00); year-to-date: +8,61%.
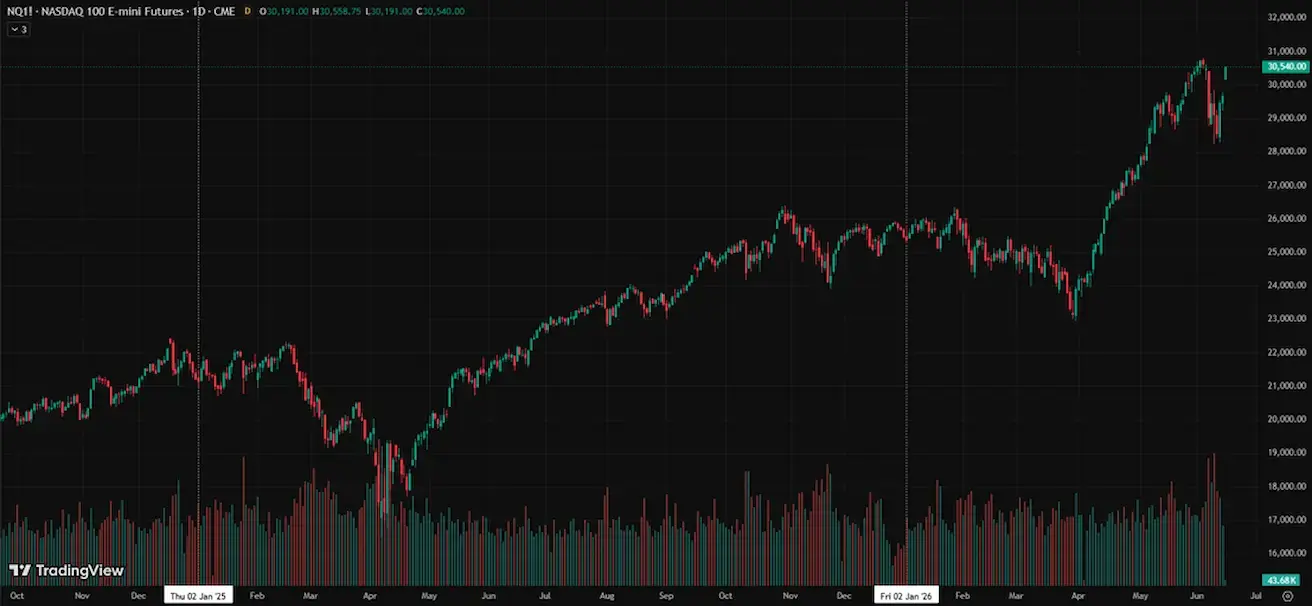
NASDAQ100
Weekly performance: +2,43% (week-end close: 29662); year-to-date:+17,47%.
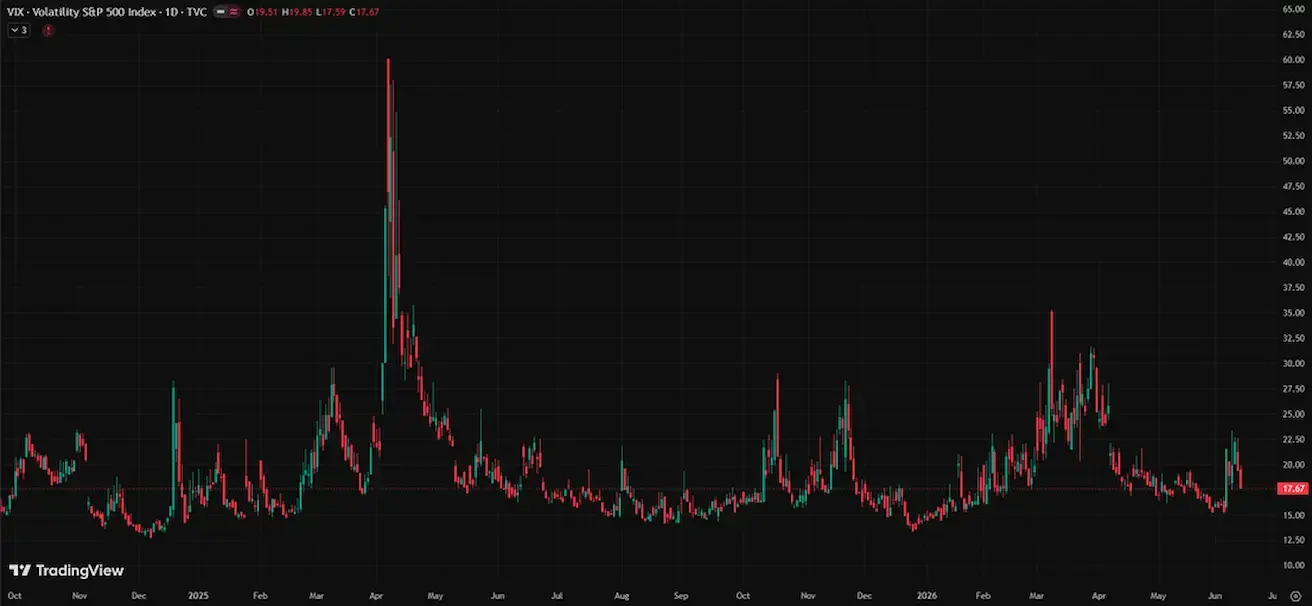
VIX
VIX (volatility index): week closing at 17,67 points.
FactSet Earnings Insight Weekly Report (June 5, 2026)
Key Highlights:
- For the second quarter of 2026, companies in the S&P 500 Index are expected to report year-over-year earnings growth of 21.7% and revenue growth of 12.0%.
- If the actual earnings growth rate for the quarter reaches 21.7%, it will mark the second consecutive quarter in which S&P 500 earnings growth has exceeded 20%.
- The 12-month forward P/E ratio for the S&P 500 is 20.1x, above both the 5-year average of 19.9x and the 10-year average of 19.0x.
- For Q3 2026, analysts project earnings growth of 25.1% and revenue growth of 10.7%.
- For Q4 2026, analysts project earnings growth of 22.6% and revenue growth of 10.2%.
- For full-year 2026, analysts forecast earnings growth of 22.8% and revenue growth of 10.8%.
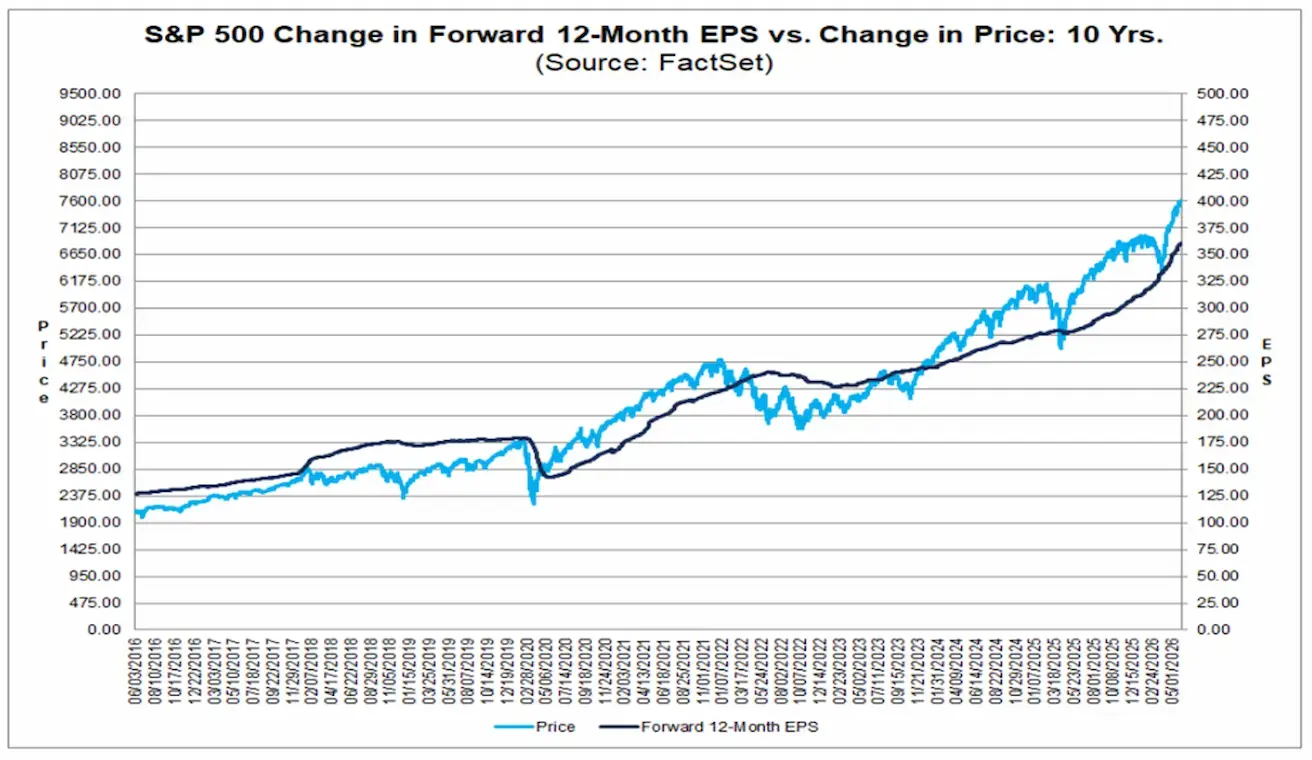
This represents a strong bullish signal for the S&P 500. Over the past decade, the chart clearly shows that the S&P 500 Index level (blue line) and forward earnings expectations for constituent companies (dark line) have moved largely in tandem over meaningful periods.
The market’s advance in 2025 and 2026 is being supported not only by multiple expansions, but also by robust underlying growth in corporate earnings. This suggests that the rally is fundamentally driven by improving business performance rather than valuation re-rating alone.
Eurozone
- The European Central Bank (ECB) has raised interest rates, while maintaining a hawkish policy stance, reflecting growing concerns over inflationary pressures.
- As the conflict in the Middle East has intensified, the ECB has revised its GDP growth forecasts downward and raised its inflation projections for the coming years.
Interest Rates
- Deposit Facility Rate: 2.25% (previous: 2.00%).
- Marginal Lending Facility Rate: 2.65% (previous: 2.40%) — the rate at which banks can obtain overnight liquidity from the ECB.
- Main Refinancing Rate (policy rate): 2.40% (previous: 2.15%).
Prior to the latest geopolitical developments, ECB officials continued to maintain a distinctly hawkish tone, signaling a commitment to further monetary tightening in response to persistent inflationary pressures.
Key Takeaways from ECB Officials' Statements:
- Further Rate Hikes Remain on the Table: The ECB remains firmly focused on combating rising inflation and does not appear inclined to pause its tightening cycle in the near term.
- July Rate Increase Is a Real Possibility: Comments from Joachim Nagel explicitly suggest that the July meeting is being actively considered as an opportunity for another rate hike.
- A Pre-emptive Policy Approach: Gabriel Makhlouf emphasized concerns that the ECB could fall behind the inflation curve. In his view, failing to act would pose a greater risk than tightening policy further, reinforcing the central bank’s proactive stance toward inflation control.
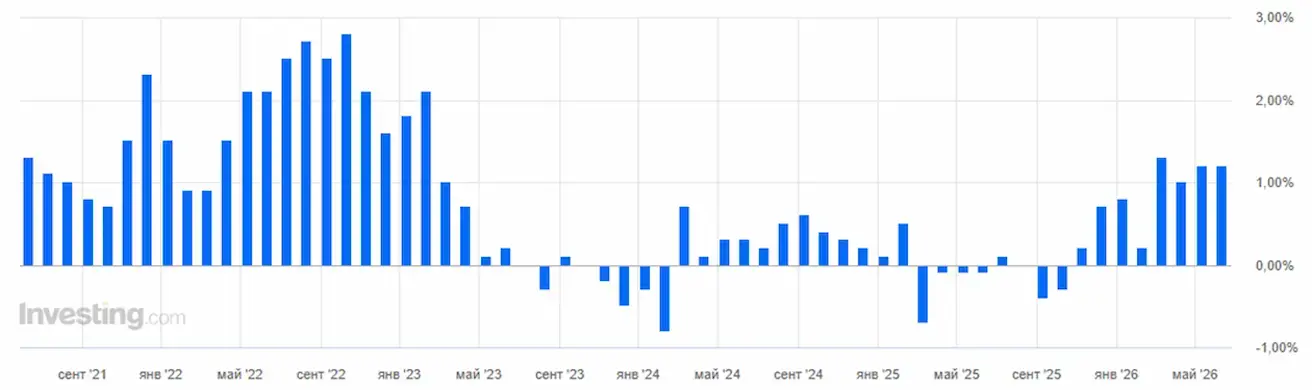
Inflation – Consumer Price Index (CPI) (May):
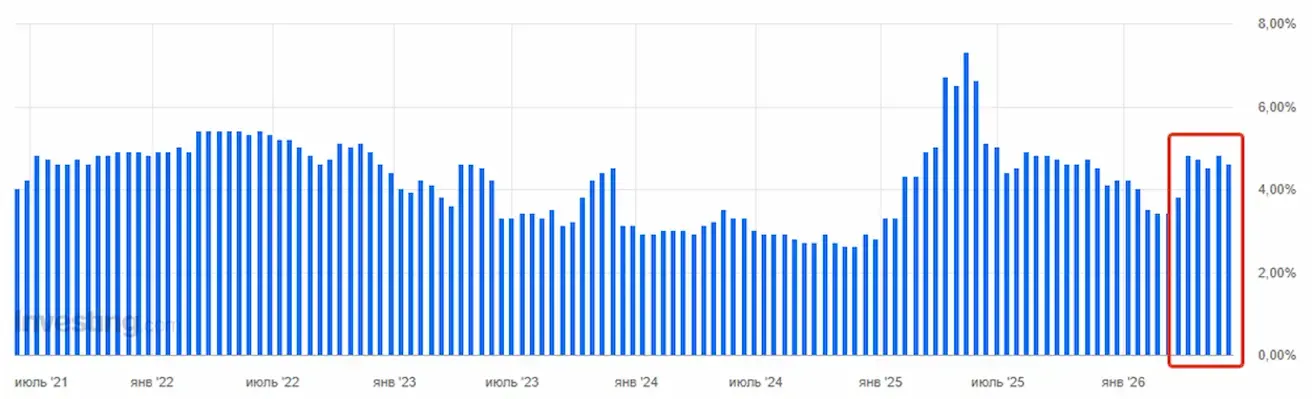
- Core CPI (YoY): 2.5% (previous: 2.2%).
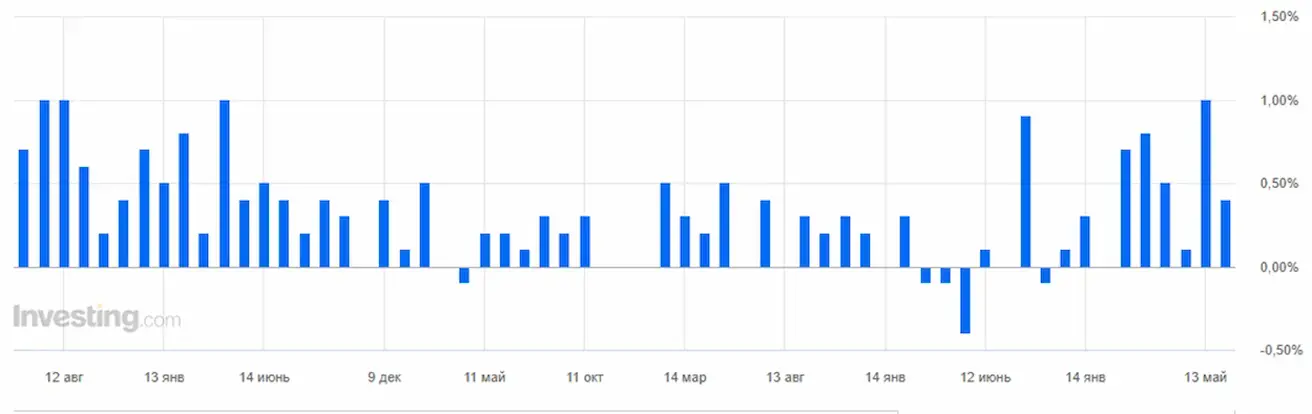
- CPI (MoM): 0.1% (previous: 1.0%).
- CPI (YoY): 3.2% (previous: 3.0%).
GDP (Q1, Preliminary Estimate):
- Quarter-over-Quarter (QoQ): -0.2% (previous: 0.1%).
- Year-over-Year (YoY): 0.3% (previous: 1.2%).
Labour Market:
- Unemployment Rate (May): 6.3% (previous: 6.3%).
Industrial Production:
- Industrial Production (MoM) (February): 0.4% (previous: -0.8%).
PMI Indicators (May) (above 50 indicates expansion; below 50 indicates contraction):
- Services PMI: 47.7 (previous: 47.6).
- Manufacturing PMI: 51.8 (previous: 52.2).
- S&P Global Composite PMI: 48.5 (previous: 48.8).
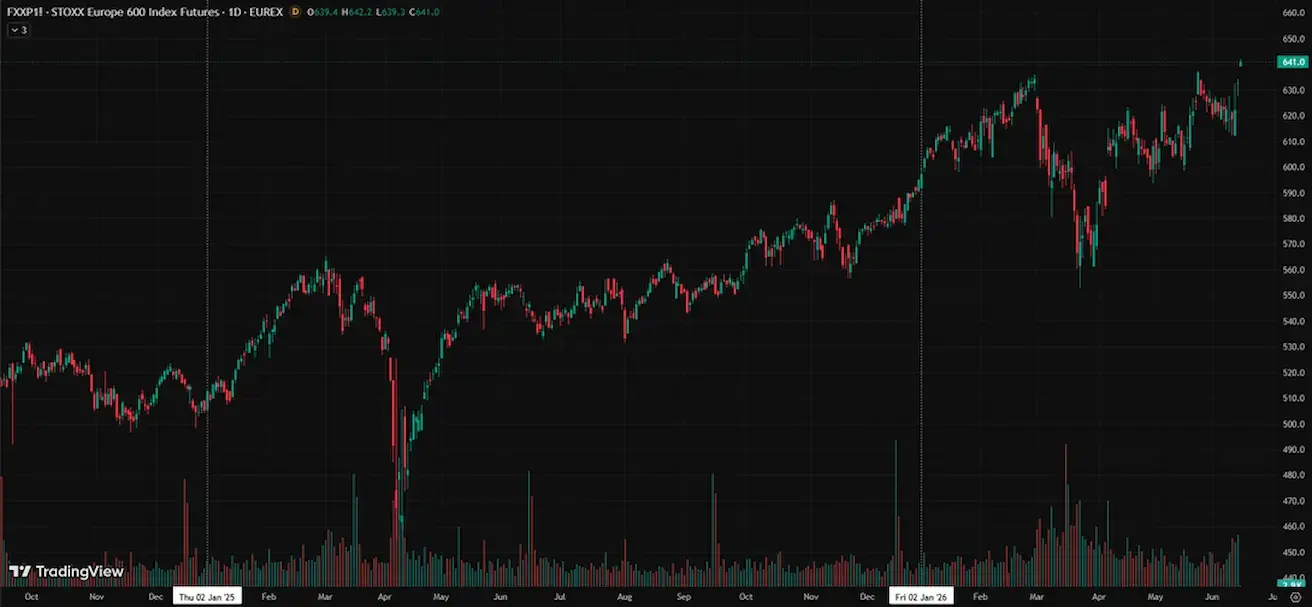
EURO STOXX 600 (FXXP1!)
Weekly performance: +2,76% (week-end close: 632,9); year-to-date: +6,55%.
China
Economic activity continues to stabilize, supported primarily by strong export performance, while domestic demand and investment are gradually recovering. Policy support remains targeted and measured rather than broad-based.
- Interest rates remain unchanged.
- Monetary policy remains accommodative, with authorities maintaining a supportive stance toward economic growth.
China has reaffirmed its commitment to fiscal support measures under its 2026 economic plan, including initiatives aimed at:
- Stimulating domestic demand;
- Optimizing tax incentives and subsidy programs;
- Accelerating industrial modernization and upgrading strategic sectors.
Interest Rates:
- 1-Year Loan Prime Rate (LPR) – the benchmark rate for medium-term lending: 3.00%.
- 5-Year Loan Prime Rate (LPR) – the reference rate for mortgage lending: 3.50%.
Inflation Indicators (May):
- Consumer Price Index (CPI) (MoM): -0.1% (previous: 0.3%).
- Consumer Price Index (CPI) (YoY): 1.2% (previous: 1.3%).
- Producer Price Index (PPI) (YoY): +3.9% (previous: +2.8%).
Trade and Economic Activity
- Imports (May, YoY): +27.4% (previous: +25.3%).
- Exports (May, YoY): +19.4% (previous: +14.1%).
- Trade Balance (May): USD 105.43 billion (previous: USD 84.80 billion).
GDP (Q1 2026):
- Quarter-over-Quarter (QoQ): +1.3% (previous: +1.2%).
- Year-over-Year (YoY): +5.0% (previous: +4.5%).
Labour Market:
- Unemployment Rate (April): 5.2% (previous: 5.4%).
Industrial Activity and Domestic Demand:
- Industrial Production (April, YTD YoY): +5.6% (previous: +6.1%).
- Fixed Asset Investment (April, YoY): -1.6% (previous: +1.7%).
- Retail Sales (April, YoY): +0.9% (previous: +1.3%).
PMI Indicators (May) (a reading above 50 indicates expansion, while a reading below 50 indicates contraction)
- Manufacturing PMI: 50.0 (previous: 50.3).
- Non-Manufacturing PMI: 50.1 (previous: 49.4).
- Composite PMI: 50.5 (previous: 50.1).
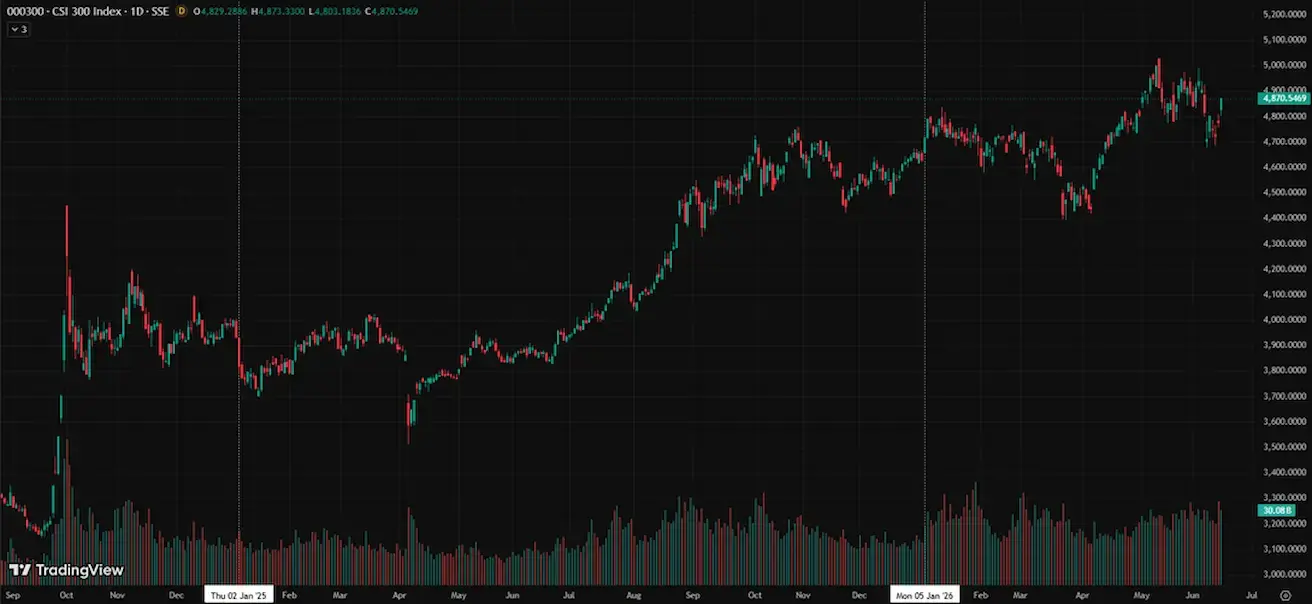
CSI 300 INDEX (000300.HK)
Weekly performance: +0,98% (week-end close: 4777,32); year-to-date: +2,48%.
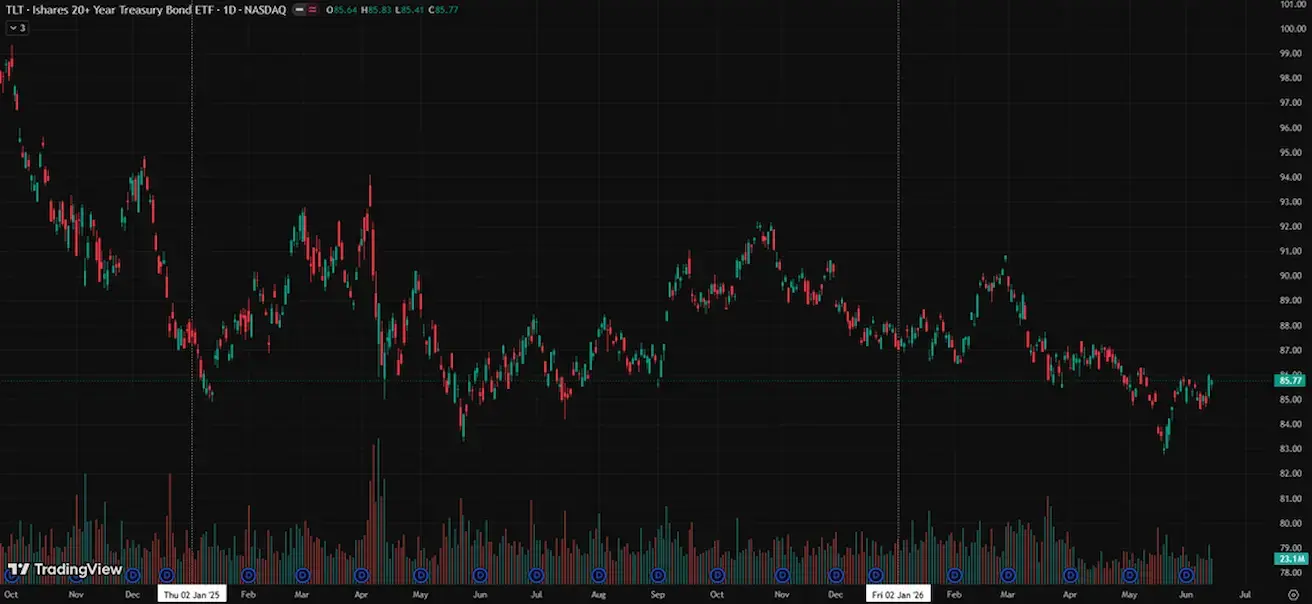
BOND MARKET
U.S. Bond Market – Decline in Yields U.S. Treasury Bonds 20+ Years (TLT ETF): +0.83% for the week (weekly close: 85.77); -1.59% year-to-date.
YIELDS AND SPREADS
- Market Yield on U.S. Treasury Securities at 10-Year Constant Maturity: 4.42% (previous: 4.57%).
- 2-Year Treasury Yield: 4.03% (previous: 4.19%).
- ICE BofA BBB U.S. Corporate Index Effective Yield: 5.33% (previous: 5.34%).
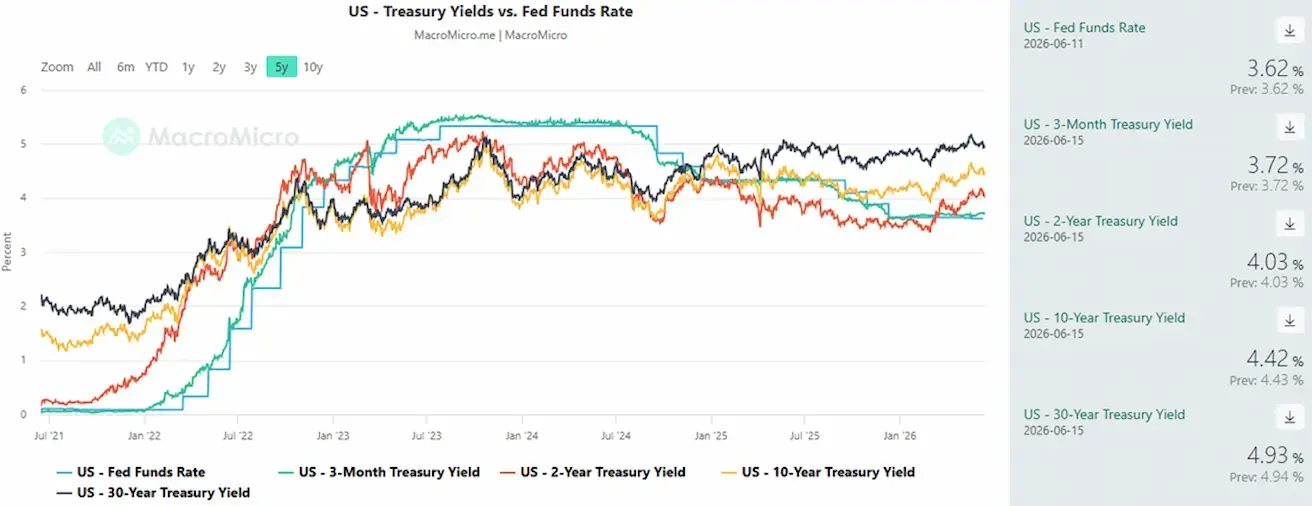
- The yield spread between 10-year and 2-year U.S. Treasury securities stands at 39 basis points (previous: 38 basis points).
- The yield spread between 10-year and 3-month U.S. Treasury securities stands at 70 basis points (previous: 84 basis points).
The cost of a 5-year U.S. Credit Default Swap (CDS) (default insurance) is 38.21 basis points (vs. 38.21 basis points last week).
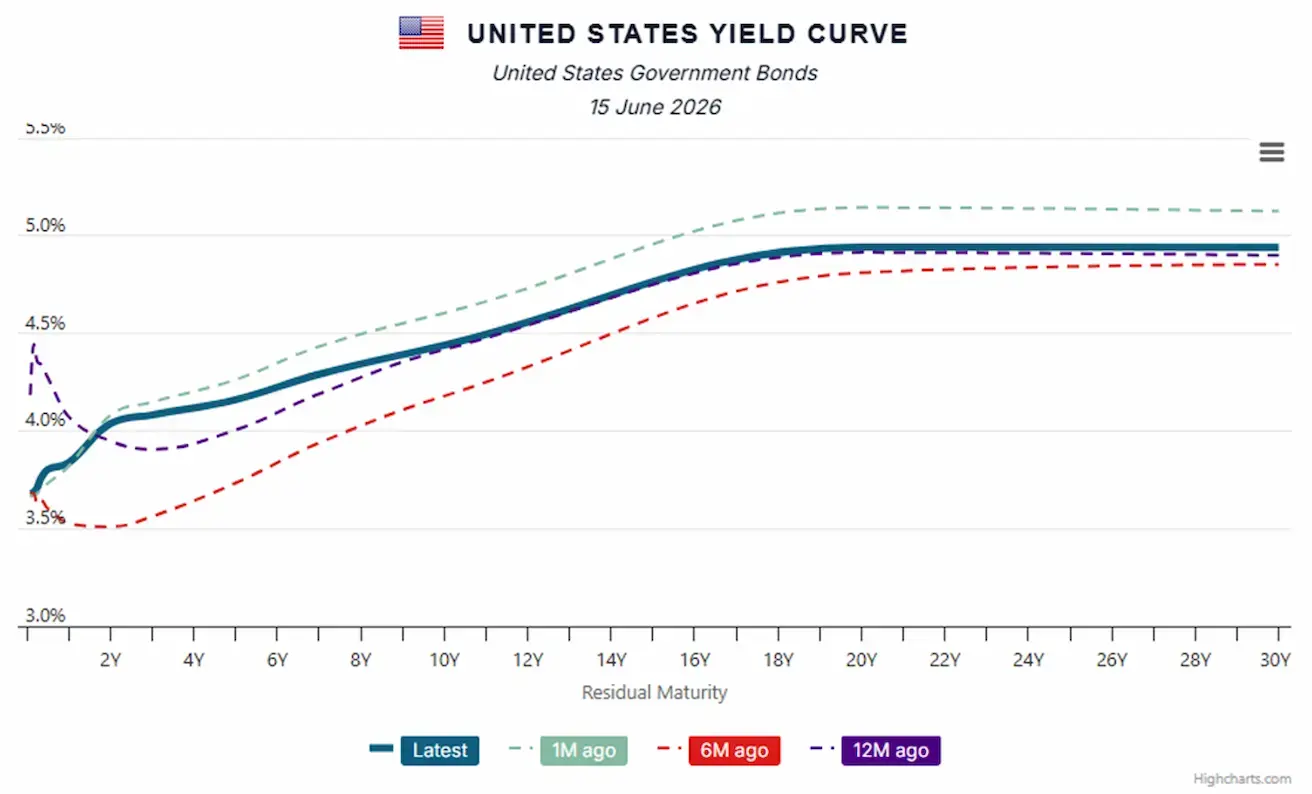
U.S. Treasury Yield Curve:
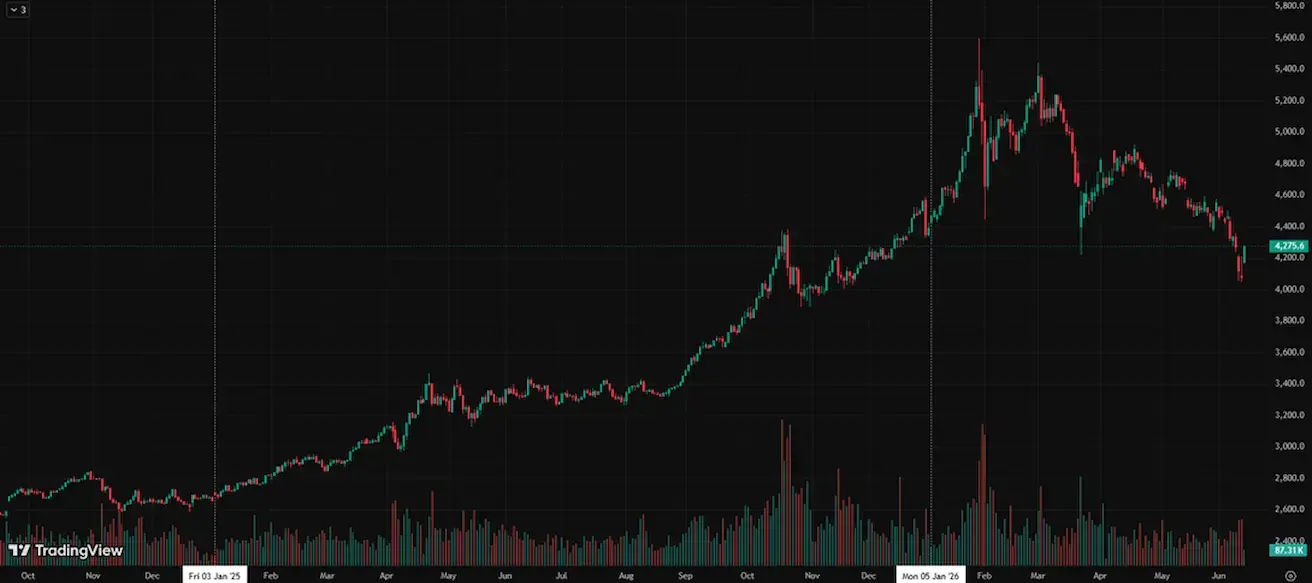
GOLD FUTURES (GC)
Weekly performance: -4,89% (week close: $4081,3 per troy oz); year-to-date: -5,79%
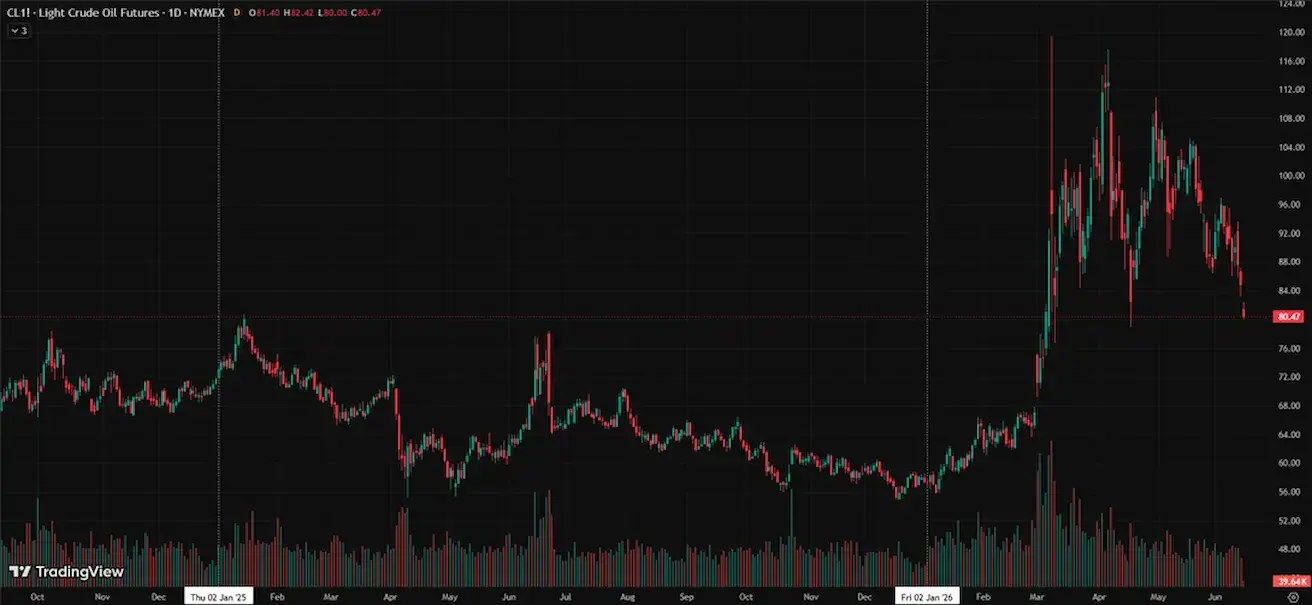
OIL FUTURES
Weekly performance: -6,25% (week close: $84,88 per barrel); year-to-date: +47,85%
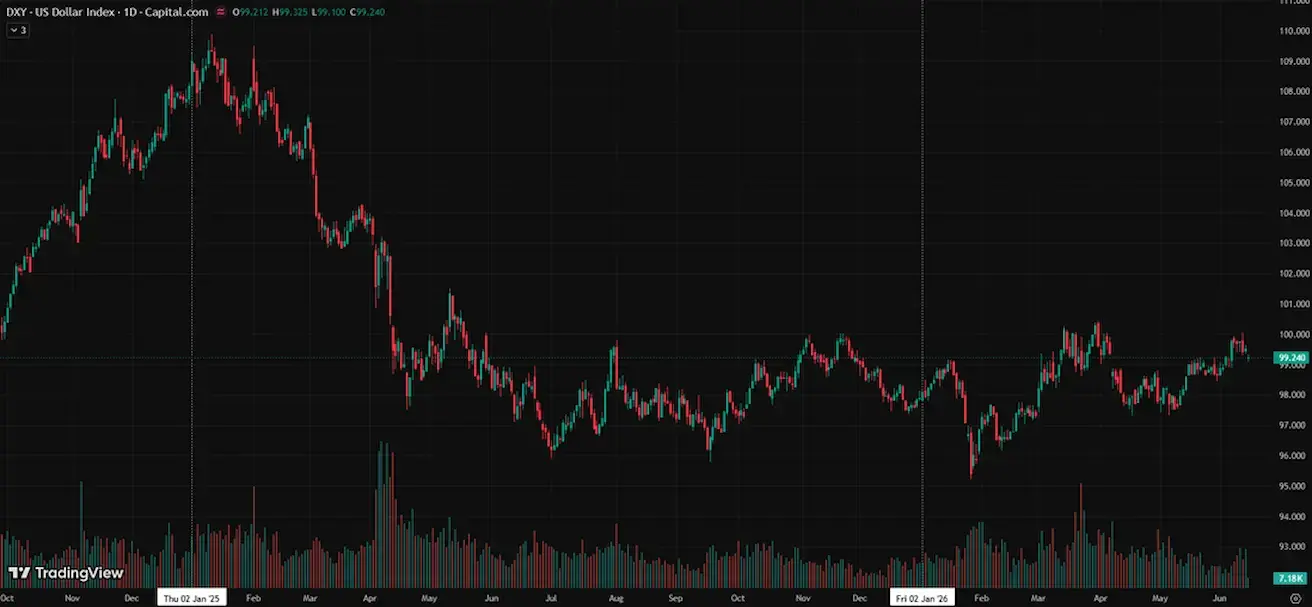
DOLLAR INDEX FUTURES (DX)
Weekly performance: -0,27% (week close: 99,519); year-to-date: +1,56%.
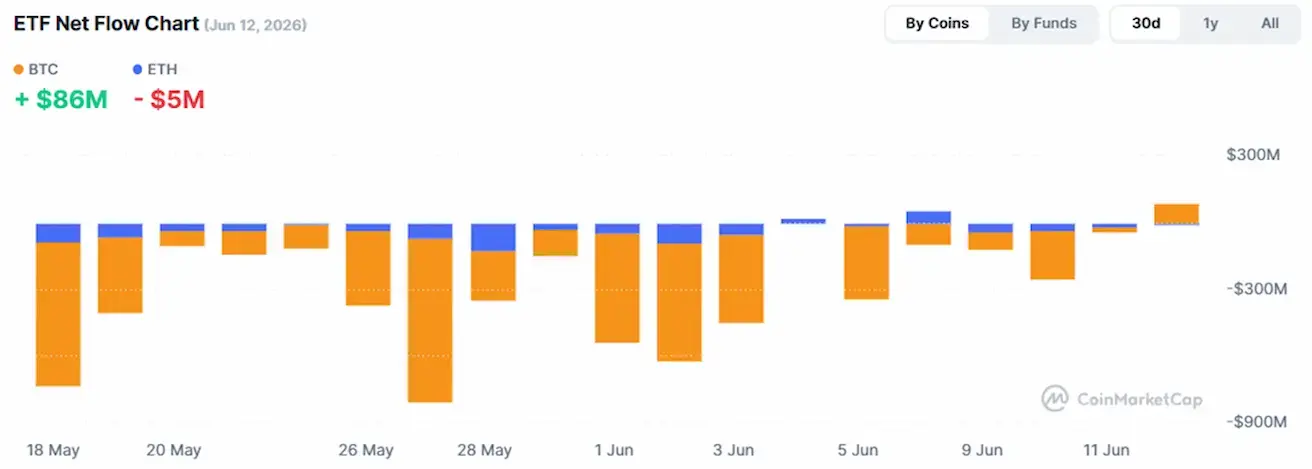
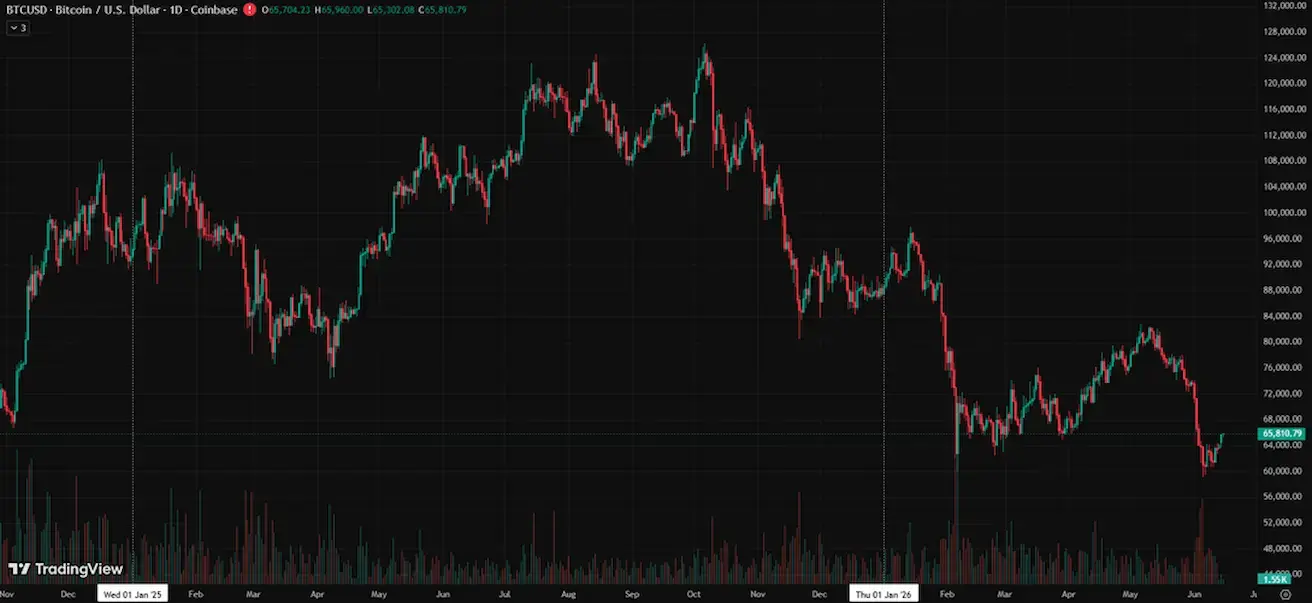
BTC FUTURES
Weekly performance: +3,80% (week close: $65706,6); year-to-date: -25,10%.
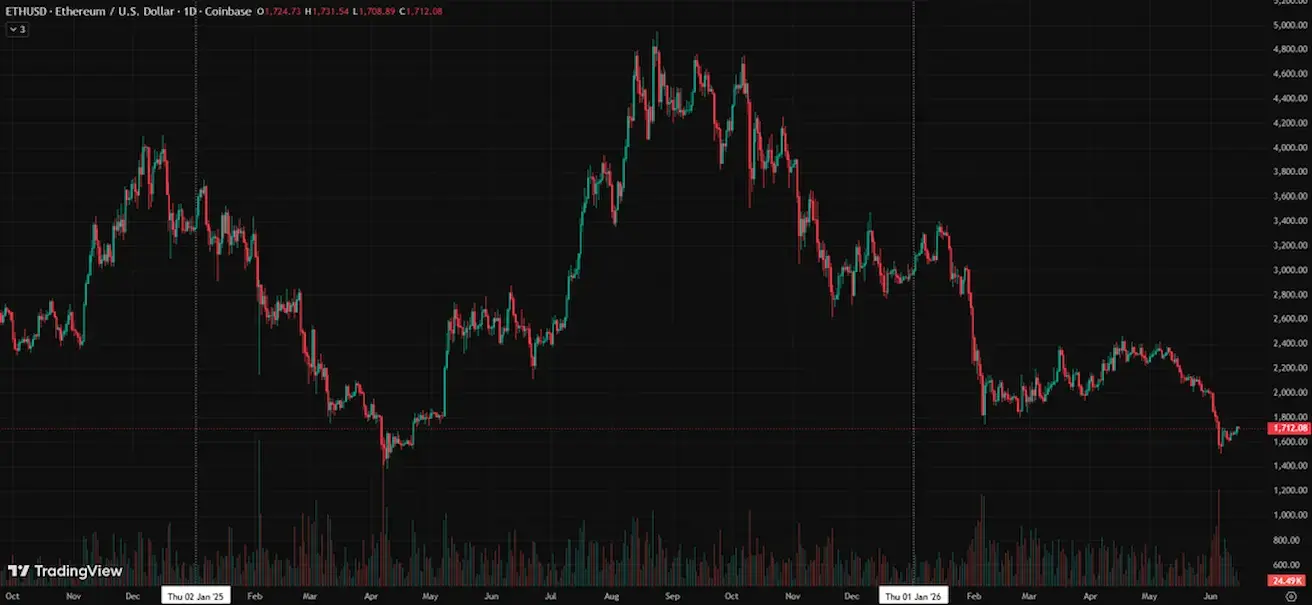
ETH FUTURES
Weekly performance: +2,03% (week close: $1724); year-to-date: -42,03%.
TOTAL CRYPTOCURRENCY MARKET CAPITALIZATION
Total crypto market capitalization: $2,2 trillion (vs $2,17 trillion a week earlier) (coinmarketcap.com).
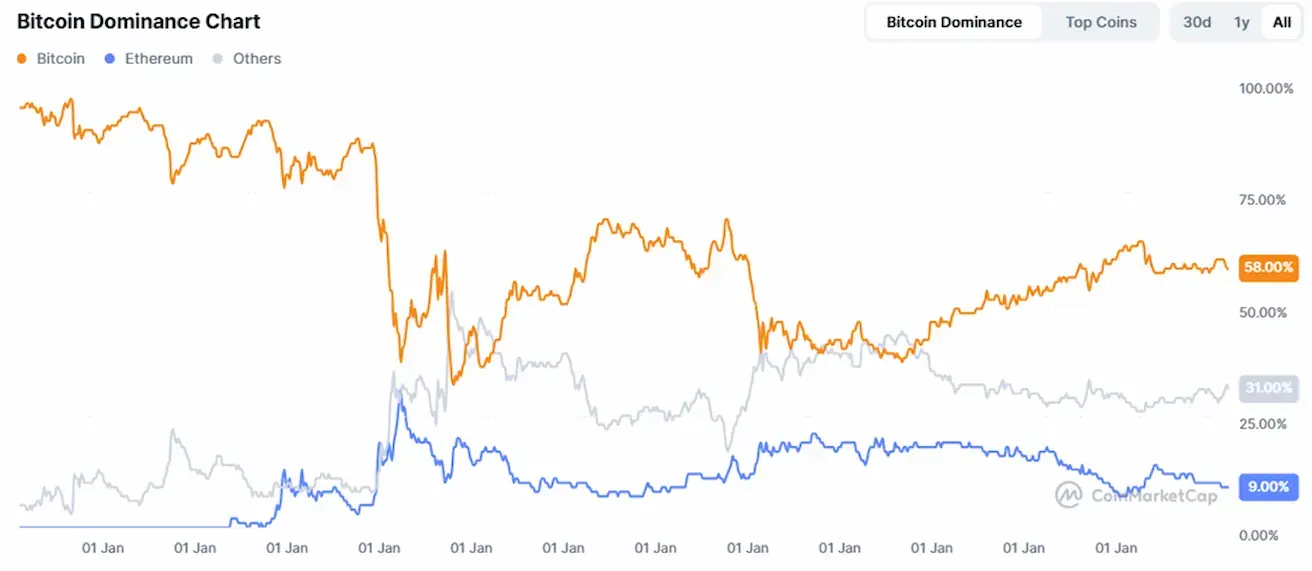
Crypto asset market shares:
- Bitcoin 58,8% (prev. (58,4%)
- Ethereum 9,3% (prev. 9,3%)
- Others 31,9% (prev. 32,4%)
ETF Net Flows Chart: