 Lietuvių
 Русский
 Қазақша
 Eesti
EestiJune 30 - July 04, 2025: Weekly economic update
Key market updates

MACROECONOMIC STATISTICS
INFLATION
- Core Consumer Price Index (CPI) (m/m) (May): 0.1% (previous: 0.2%)
- Consumer Price Index (CPI) (m/m) (May): 0.1% (previous: 0.2%)
- Core Consumer Price Index (CPI) (y/y) (May): 2.8% (previous: 2.8%)
- Consumer Price Index (CPI) (y/y) (May): 2.4% (previous: 2.3%)
INFLATION EXPECTATIONS (MICHIGAN)
- 12-month expected inflation (May): 5.0% (prev: 6.6%)
- 5-year expected inflation (April): 4.0% (prev: 4.2%)
GDP (U.S. Bureau of Economic Analysis, BEA) – Q1 2025
- Annualized (third estimate): -0.5% (second estimate: -0.2%; Q4 2024: 2.4%)
- Federal Reserve Bank of Atlanta's GDPNow estimate for Q2: 2.5% (vs. 2.9%)
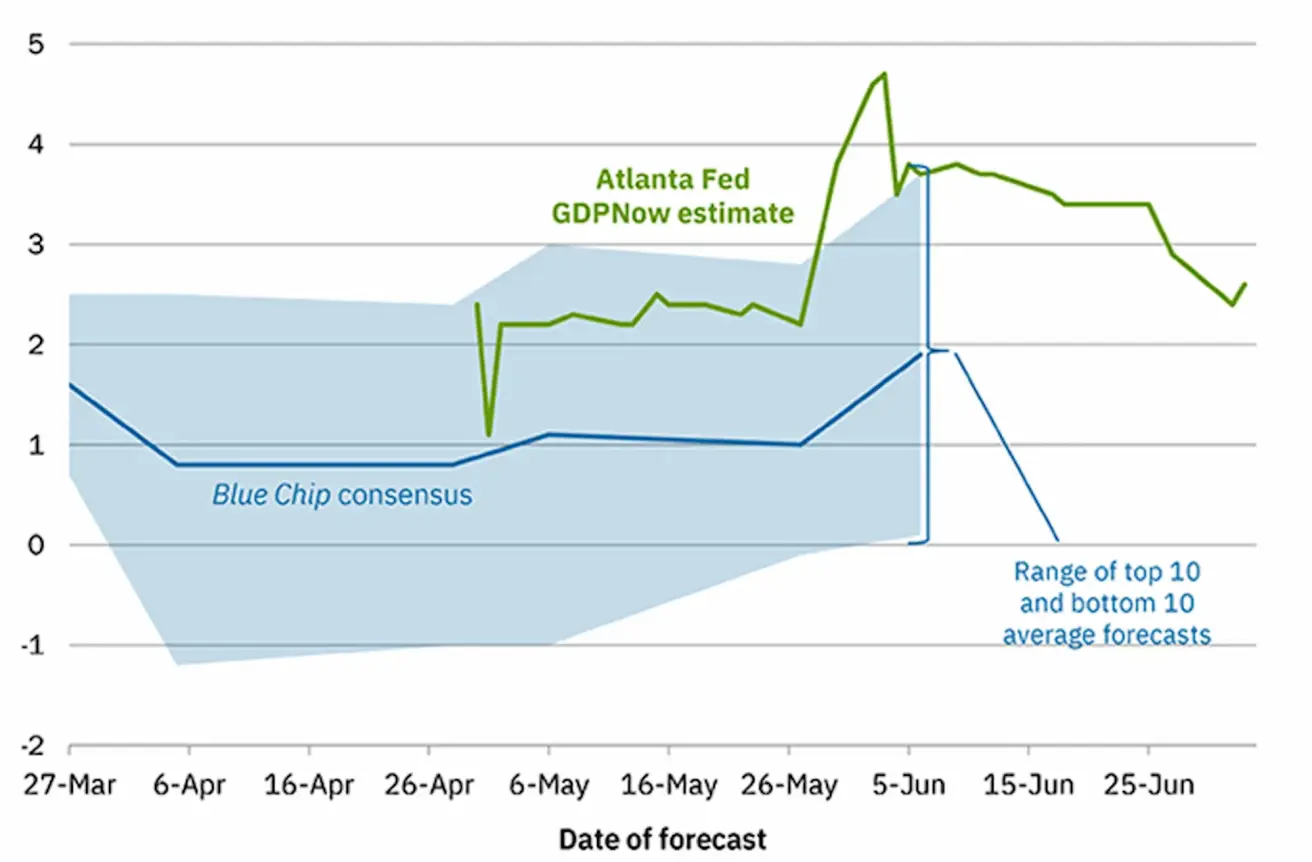 *(The GDPNow forecasting model provides a “real-time” estimate of official GDP growth ahead of its release, using a methodology similar to that employed by the U.S. Bureau of Economic Analysis.)
Business Activity Index (PMI):
(Above 50 indicates expansion; below 50 indicates contraction)
- Services sector (June): 52.9 (previous: 53.1)
- Manufacturing sector (June): 52.9 (previous: 52)
- S&P Global Composite (June): 52.9 (previous: 52.8)
LABOR MARKET:
- Unemployment rate (June): 4.1% (previous: 4.2%)
- Nonfarm payroll employment change (June): 147K (previous: 144K revised)
- Change in U.S. private nonfarm payrolls (June): 74K (previous: 137K)
- Average hourly earnings (June, y/y): 3.7% (previous: 3.8%)
- JOLTS job openings (May): 7.769M (vs. 7.395M)
MONETARY POLICY
- Federal Funds Effective Rate (EFFR): 4.25% - 4.50% (unchanged)
- Federal Reserve balance sheet increased: $6.659T (vs. previous week: $6.681T)
MARKET FORECAST FOR RATE
Today:
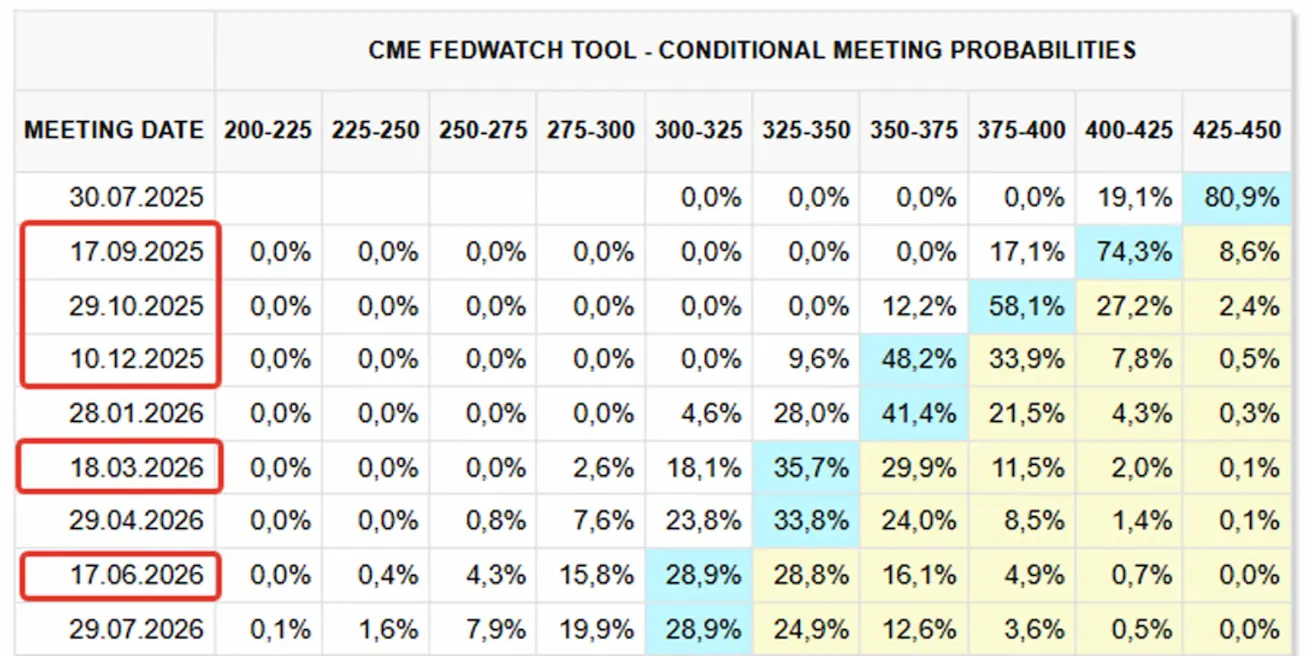
А week earlier:
Commentary
Risk-on sentiment persisted last week, with major U.S. equity indexes once again hitting record highs.
Statistics: The Atlanta Fed’s GDPNow estimate for Q2 declined in June from 3.8% to 2.5%. Business activity indices show a mixed picture: growth in the manufacturing sector contrasts with a decline in services. Labor market data is also contradictory.
On one hand, the unemployment rate has fallen to 4.1%, and job openings have increased for a second consecutive month, reaching 7.769 million. Job openings reflect labor market demand and supply dynamics—sustained growth in vacancies tends to drive wage growth, which in turn fuels inflation.
On the other hand, private nonfarm payrolls have dropped sharply, coming in well below the average at just 74K.
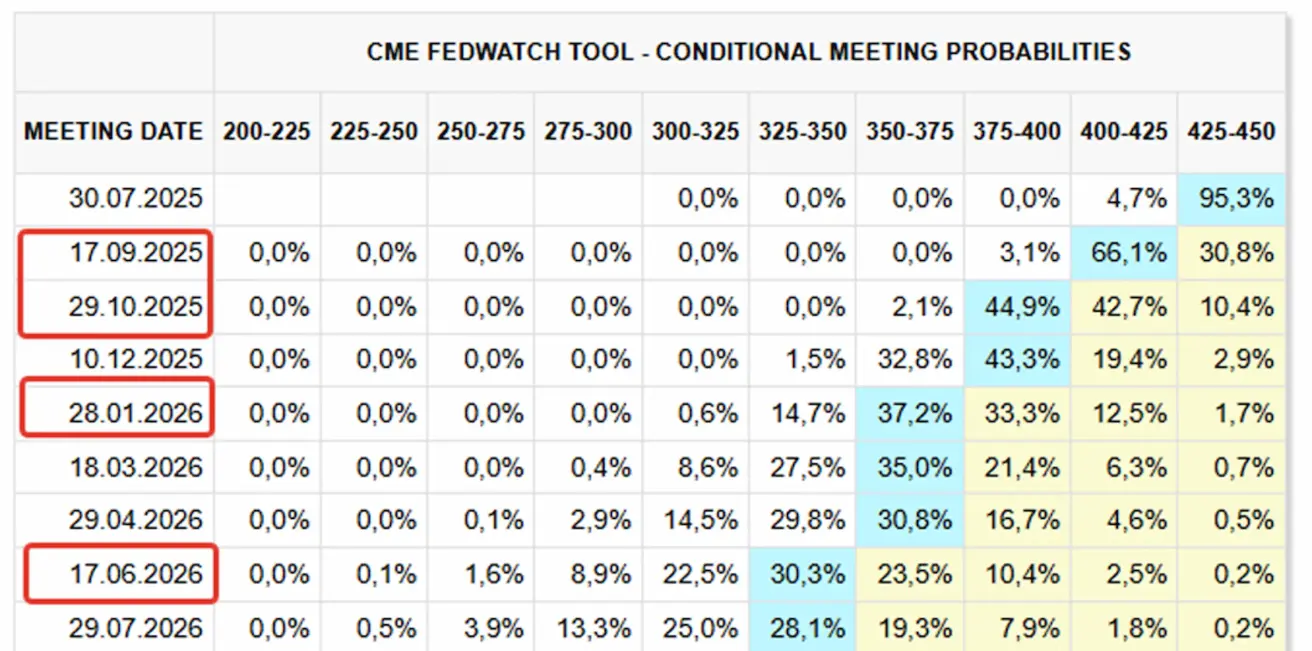
Market expectations based on FedWatch:
- Next FOMC meeting (July 30): no change expected — over 95% probability of no rate cut.
- Next 12 months: the market is pricing in four 25bps rate cuts, bringing the target range down to 3.25–3.50%. The first cut is expected in September this year.
Key Takeaways from the ECB Governing Council’s Monetary Policy Meeting Held in Frankfurt am Main on Tuesday to Thursday, June 3–5, 2025
- Macroeconomic data from both the euro area and the U.S. have recently surprised to the upside, challenging the narrative of an impending recession in either region.
- Consensus Economics forecasts for real GDP growth in the eurozone for 2025, which were revised downward following the announcement of tariffs in April, have since been gradually revised upward. The expected economic impact of those tariffs is now seen as less severe than originally priced in.
- According to the baseline of the ECB staff’s June projections, headline inflation — as measured by the Harmonized Index of Consumer Prices (HICP) — is expected to average 2.0% in 2025, 1.6% in 2026, and 2.0% in 2027.
- The expected uptick in inflation in 2027 reflects temporary upward pressure from climate-related fiscal measures, notably the introduction of the EU Emissions Trading System 2 (ETS2).
- Core inflation (HICP excluding energy and food) is projected to average 2.4% in 2025, and 1.9% in both 2026 and 2027.
- Survey data point to weaker GDP growth in the eurozone in Q2 amid heightened uncertainty.
- The labor market remained resilient. According to Eurostat’s preliminary estimate, employment rose by 0.3% in Q1 2025, compared to 0.1% in Q4 2024. The unemployment rate held steady, reaching a record low of 6.2% in April, unchanged since October 2024.
- June projections for real GDP growth suggest annual average growth of 0.9% in 2025, 1.1% in 2026, and 1.3% in 2027.
Trade Wars
- Trump announced that his administration will begin sending letters to trade partners on Friday, imposing unilateral tariffs to be enforced starting August 1.
- Countries aligned with BRICS policies will face an additional 10% tariff.
- The Trump administration has lifted licensing requirements for exports of electronic design automation (EDA) software to China as part of a new trade agreement aimed at easing technological restrictions.
Market
Equity Market
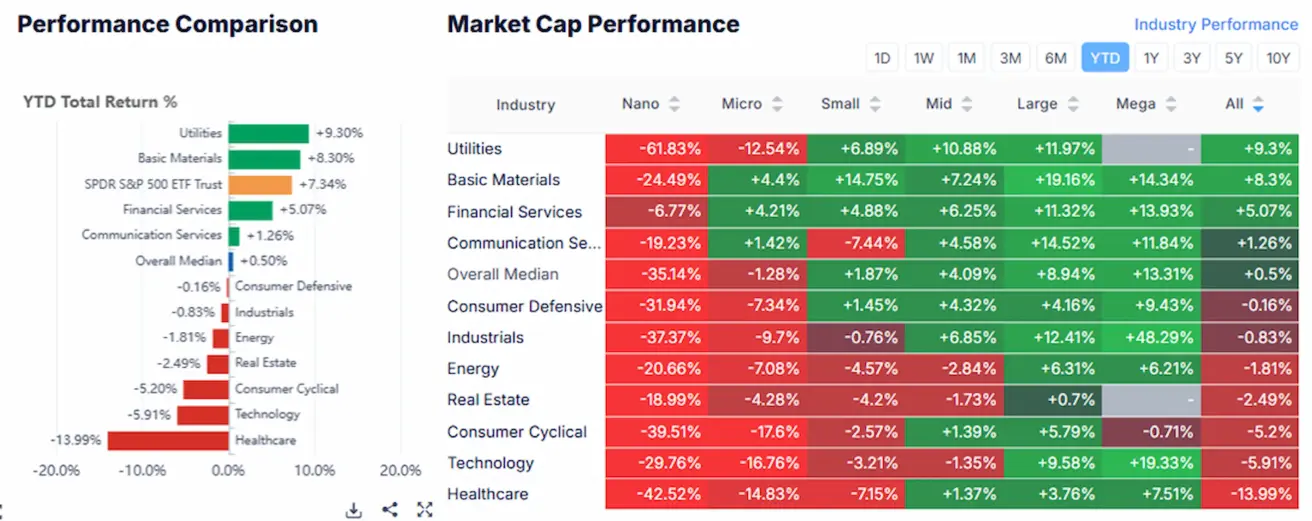
The week ended with a broad-based rally across all sectors and market capitalizations — a “green sweep”. The median gain was +2.60%, with consumer discretionary, industrials, and basic materials leading the advance.
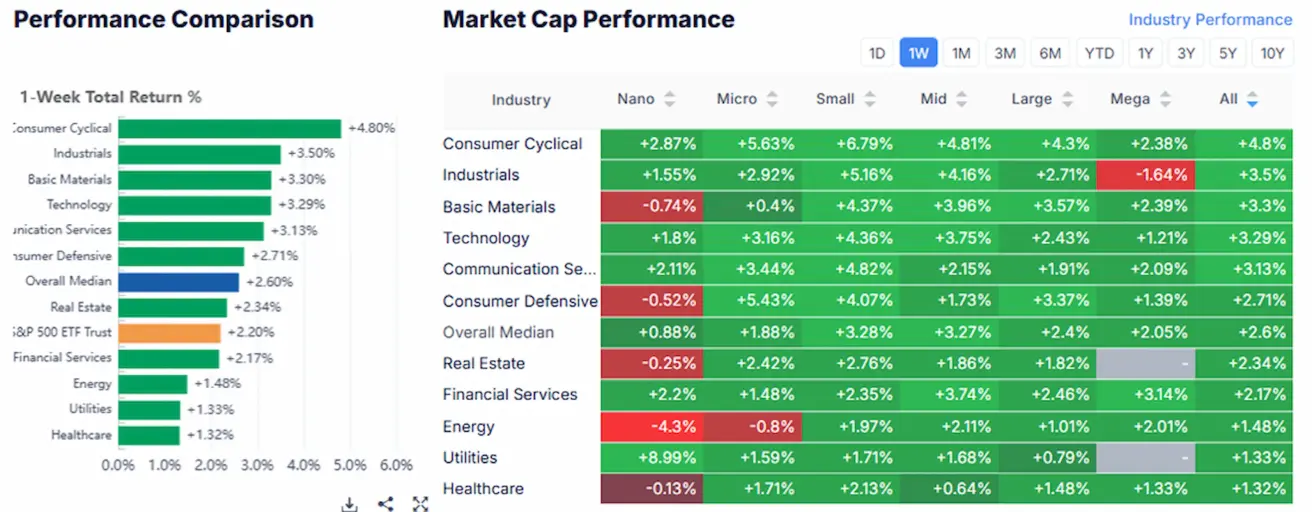
YTD Performance (Year-to-Date — from the beginning of the year to date): +0.50%. Year-to-date, utilities, basic materials, and financials remain the top-performing sectors.
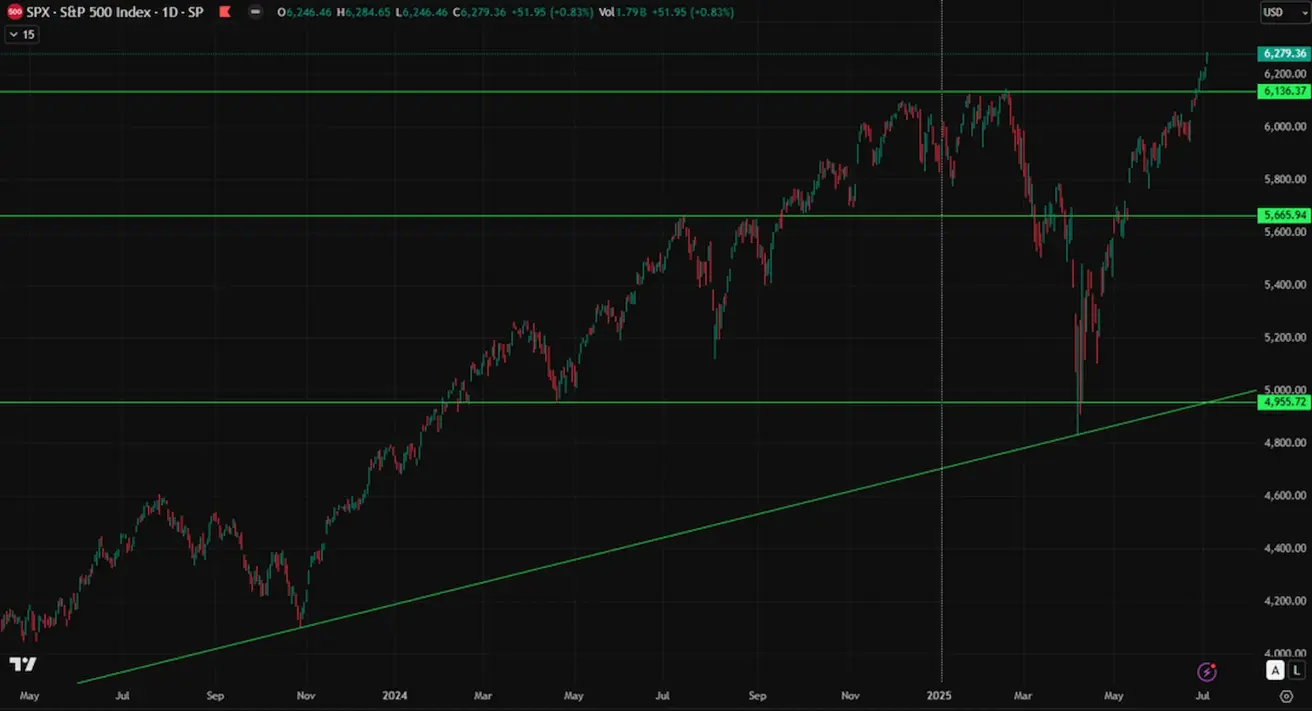
SP500
Weekly: +1.72% (weekly close: 6279,36), 2025 YTD: +6.37%
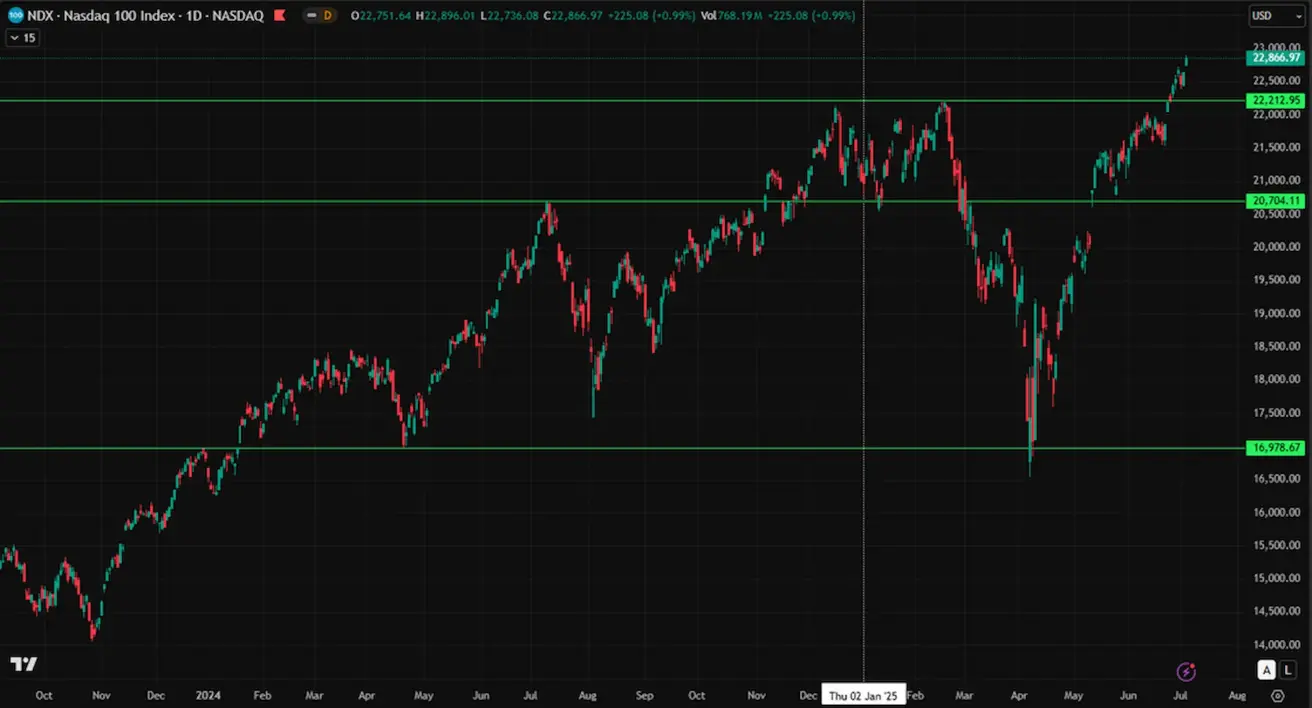
NASDAQ100
Weekly: +1.48% (weekly close: 22866.97), YTD: +8.27%
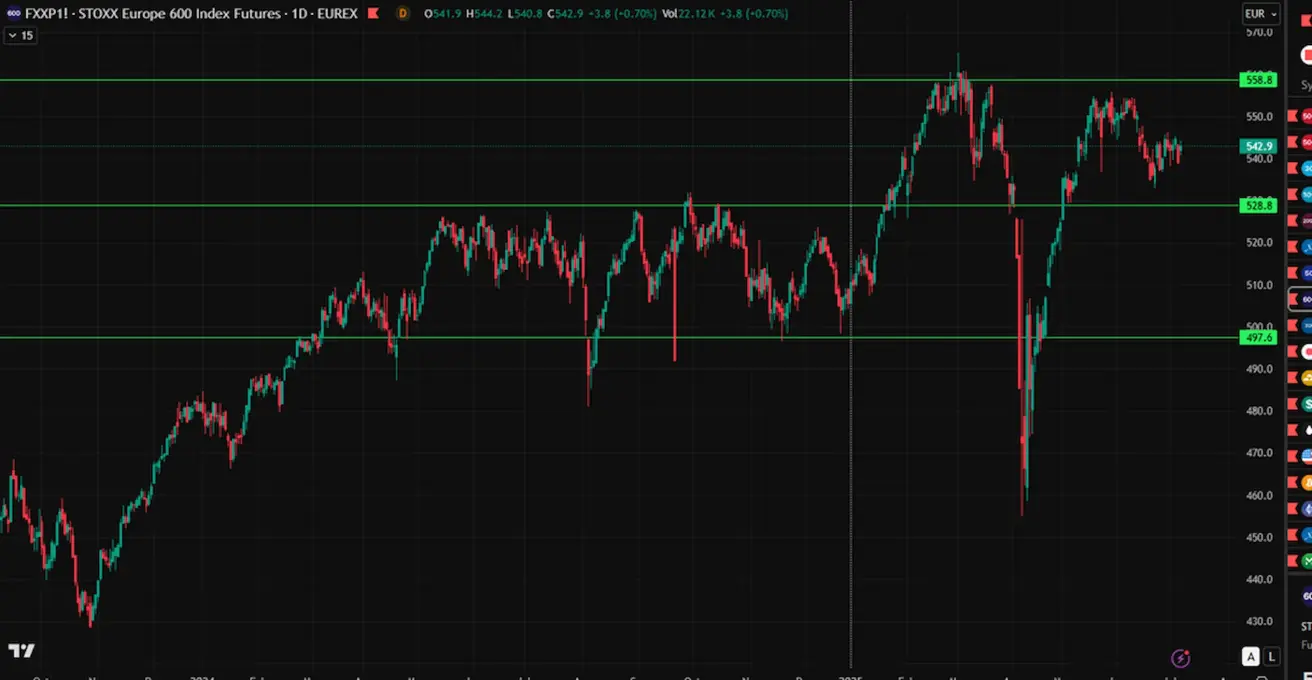
Euro Stoxx 600:
Weekly: -1.01% (weekly close: 539,1), YTD: +6.63%
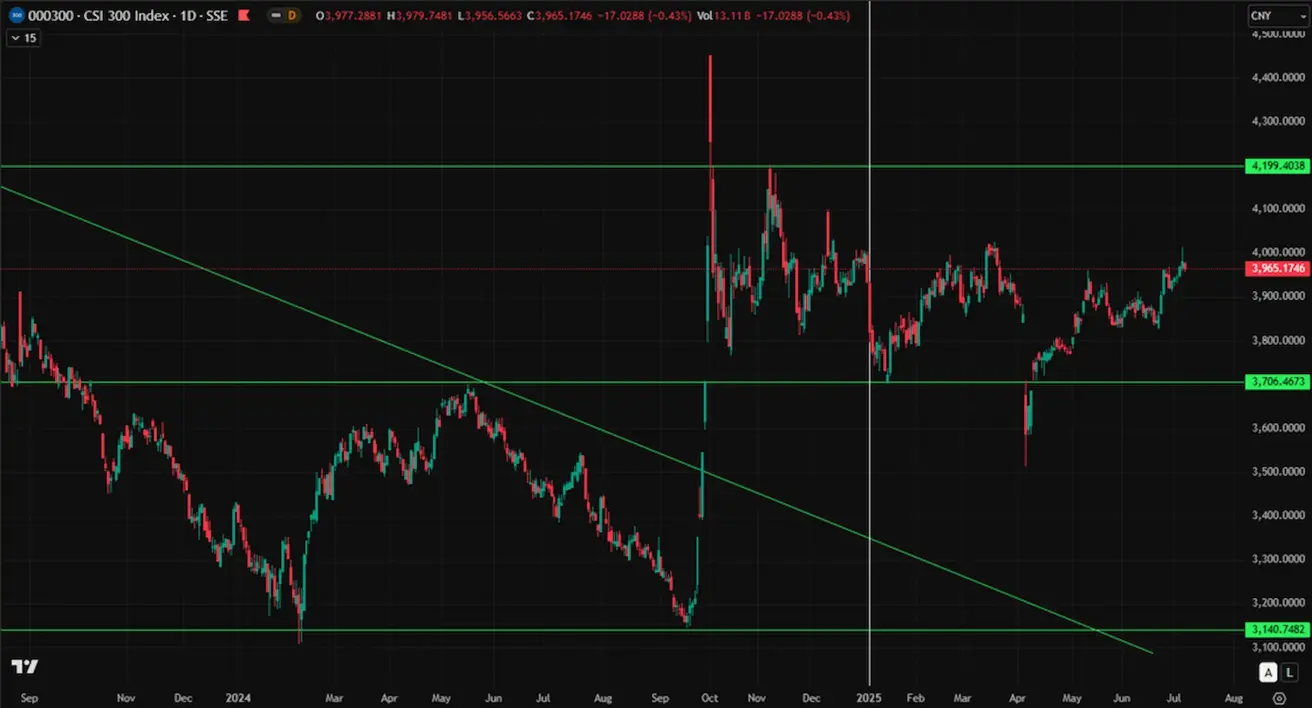
CSI Index
Weekly +0.35% (weekly close: 3965), YTD: +0.86%
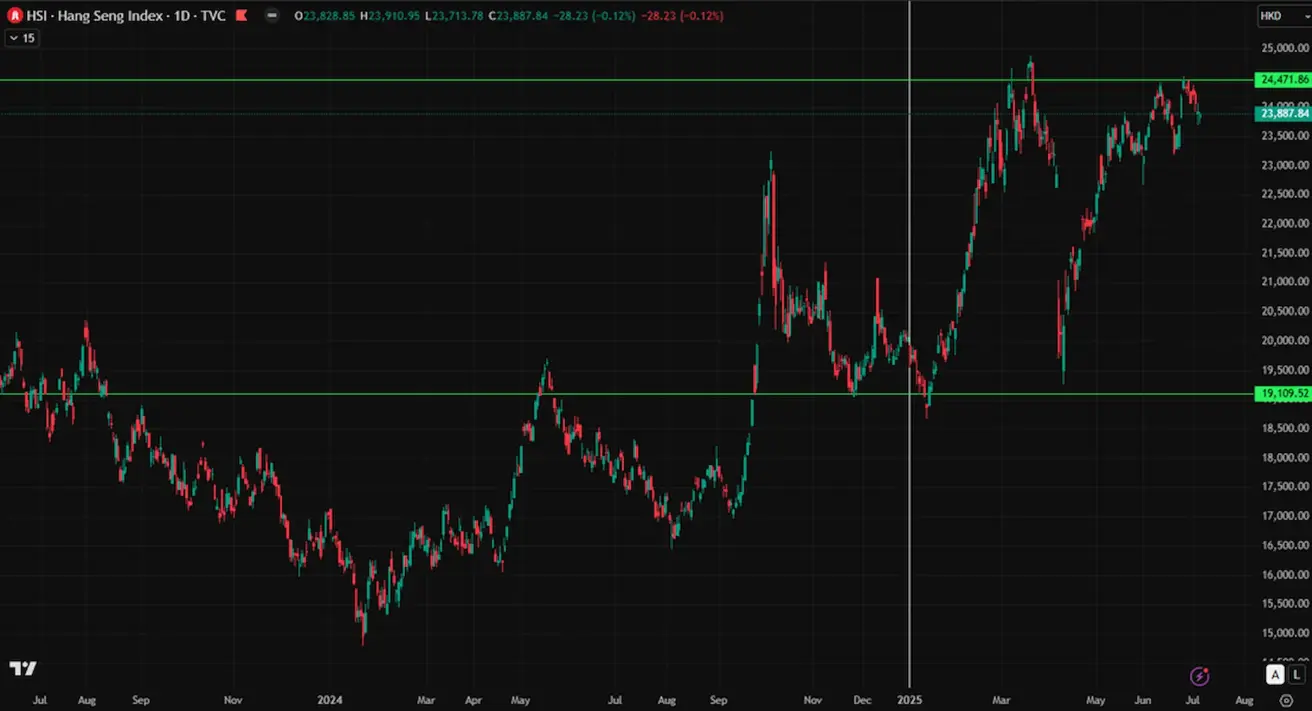
Hang Seng
Weekly: -1.27% (weekly close: 23916), YTD: +19.99%
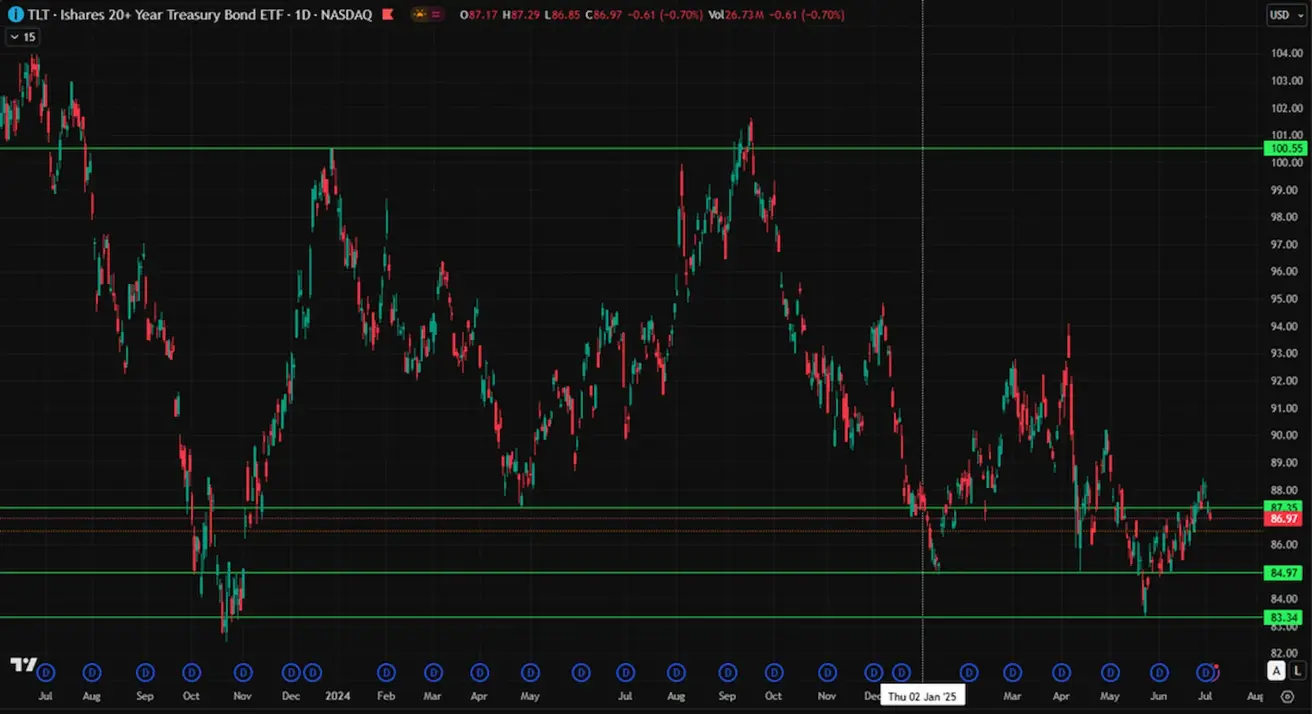
BOND MARKET
20+ Year U.S. Treasury Bonds (ETF TLT): -0.48% (weekly close: $86.97). YTD: 0.95%
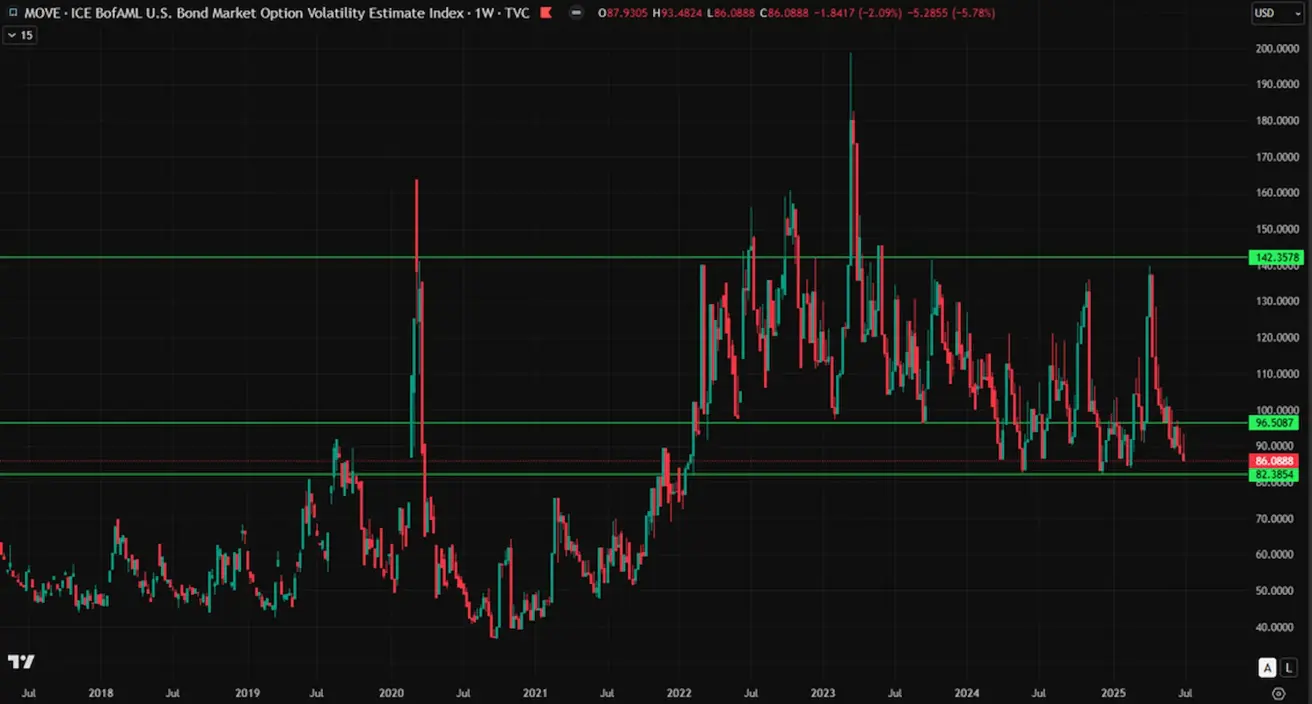
Implied volatility on short-term U.S. Treasury bill options has declined toward the lower bound of its long-term range, following the tariff-driven spike in April. The market continues to price in an imminent rate cut.
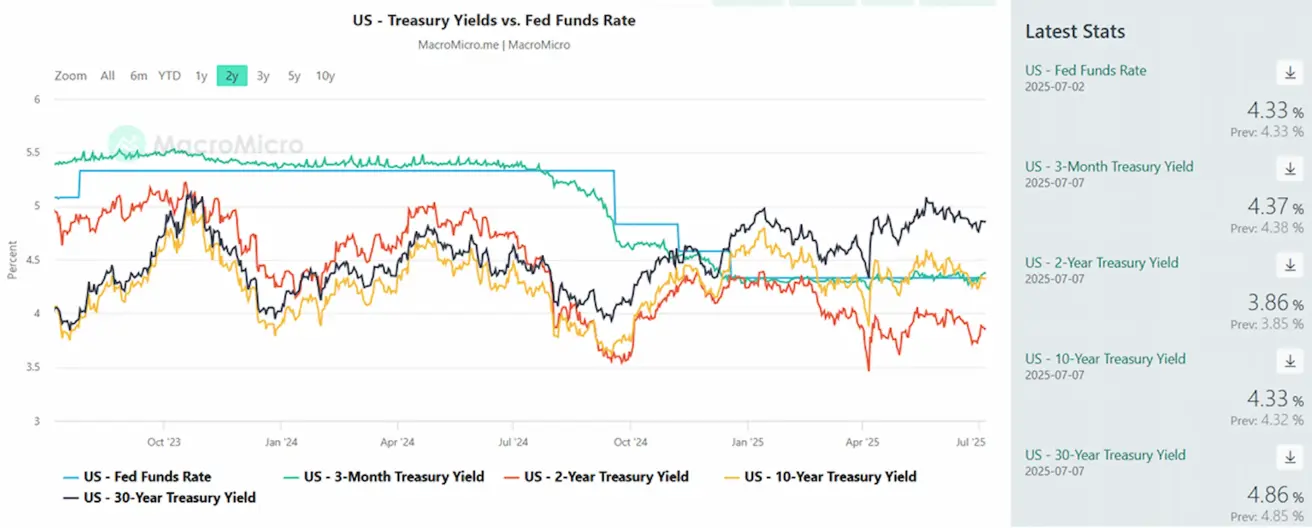
YIELDS AND SPREADS 2025/06/30 vs 2024/07/07
- Market Yield on 10-Year U.S. Treasuries: 4.33% (vs. 4.27%)
- ICE BofA BBB U.S. Corporate Index Effective Yield: 5.22% (vs. 5.24%)
- Yield Spread: 10-year vs. 2-year Treasuries: 47.0 vs. 50.0 bps
- Yield Spread: 10-year vs. 3-month Treasuries: -4.0 vs. 4.0 bps
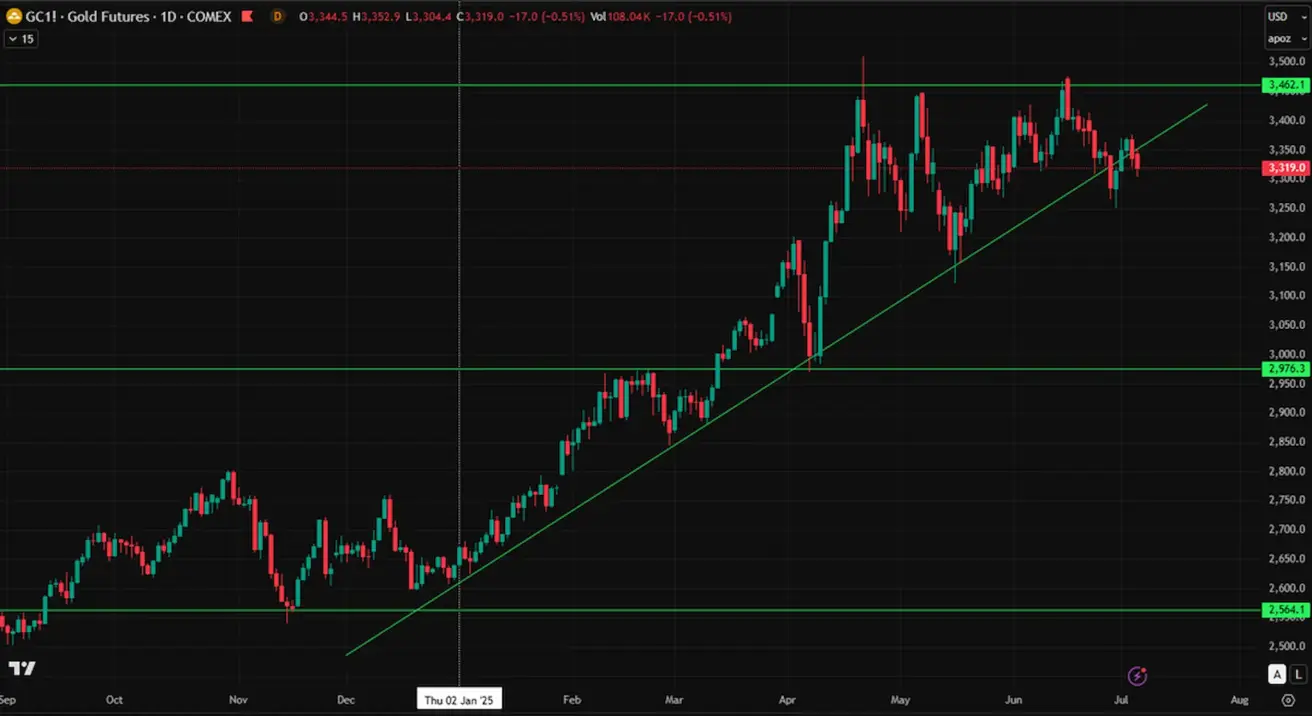
GOLD FUTURES (GC)
Weekly: +1.52%, weekly close: $3,336.0/oz, YTD: +26.32%
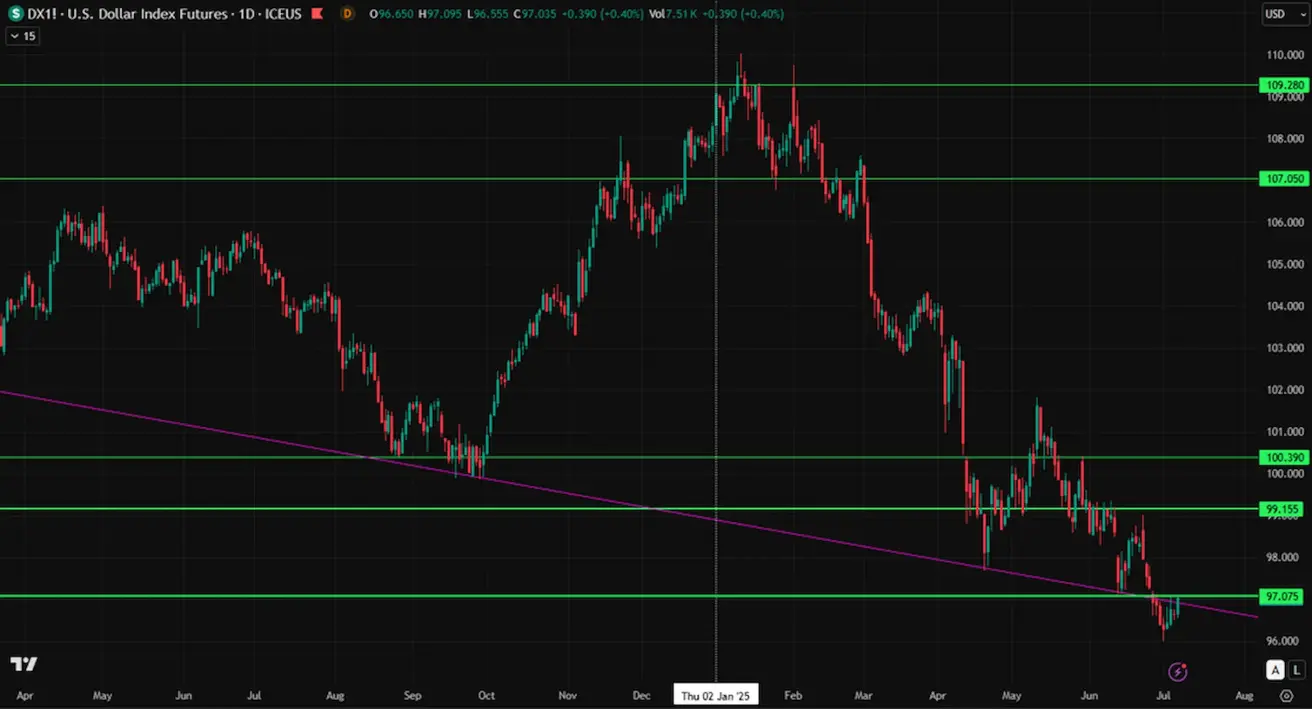
DOLLAR INDEX FUTURES (DX)
Weekly: - 0.24%, weekly close: 96.645, YTD: -10.79%
OIL FUTURES
Weekly: +3.24%, weekly close: 67.18, YTD: -6.50%
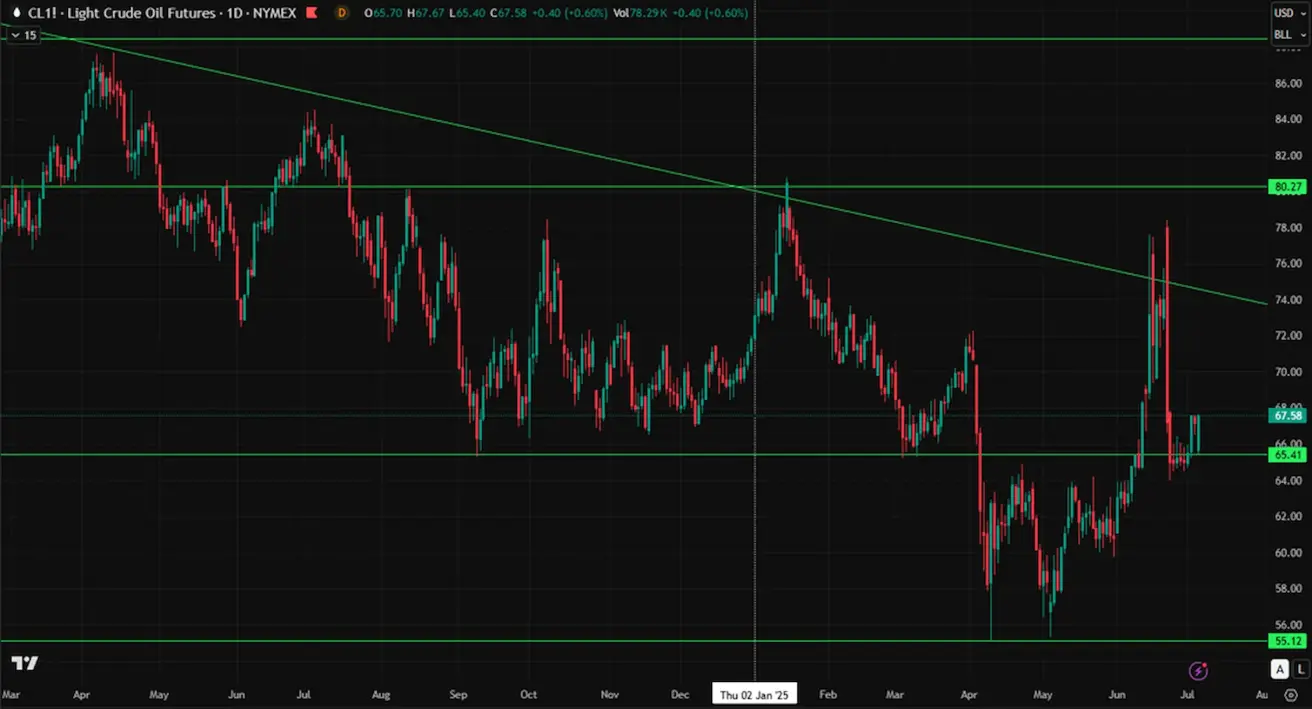
OPEC+ has announced a larger-than-expected production increase for August — +548K barrels per day, compared to the previously planned +411K bpd. The production hike has raised concerns about potential oversupply, yet oil prices continue to climb.
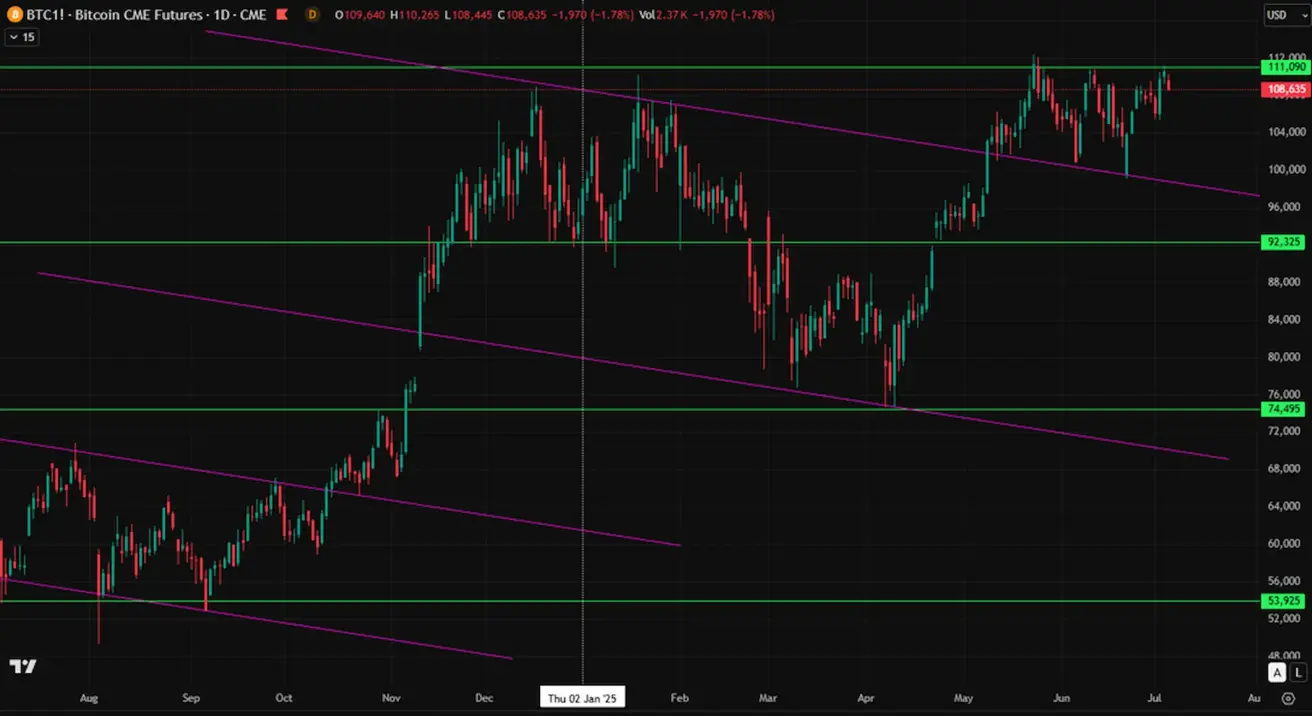
BTC FUTURES
Weekly: +2.66%, weekly close: $110,605, YTD: 16.10%
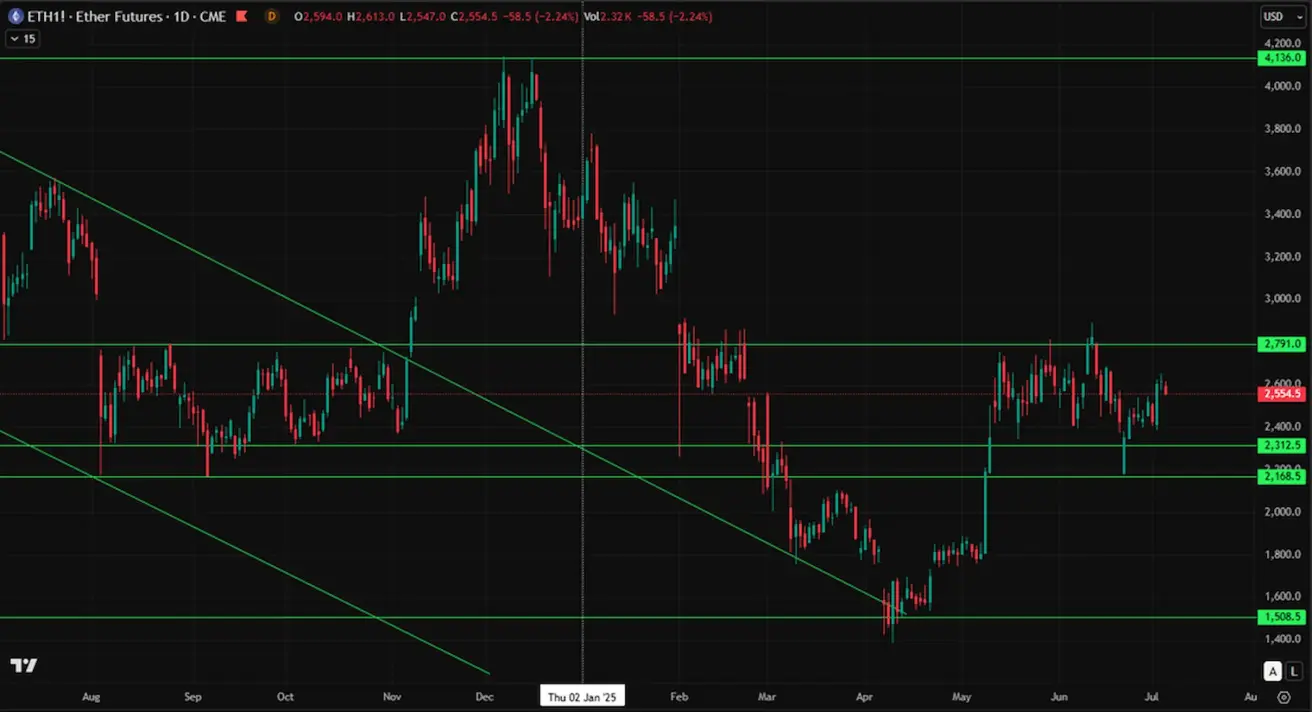
ETH FUTURES
Weekly: +7.09%, weekly close: $2,613.00, YTD: -22.78%
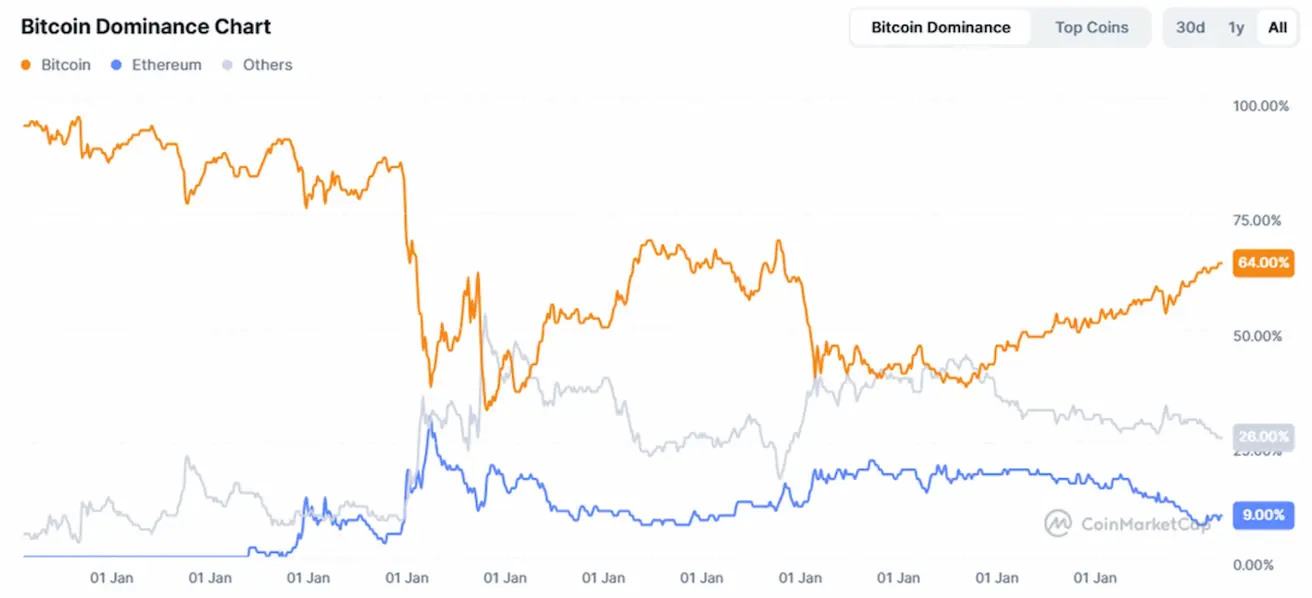
Cryptocurrency Market Capitalization:
- $3.35T (vs. $3.31T a week earlier) (coinmarketcap.com)
- Bitcoin dominance: 64.4% (64,6%), Ethereum: 9.2% (up from 9.0%), others: 26.4% (26.4%):
June 2025: Solana emerges as the undisputed leader in transaction volume.
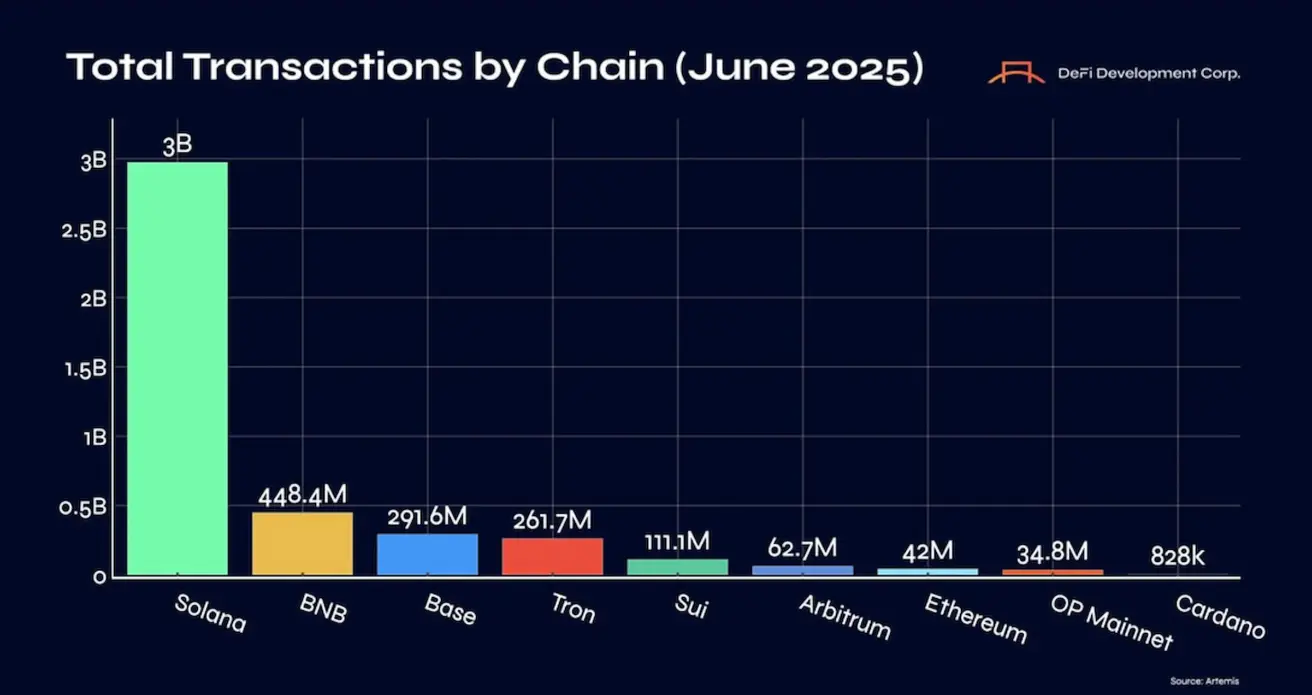
Solana has solidified its position as the leading mass-scale operating platform for high-frequency, low-cost transactions. This reflects both its technological edge and the maturity of its ecosystem, particularly in the context of emerging decentralized consumer applications and physical infrastructure networks.