Lietuvių
 Русский
 Қазақша
 Eesti
EestiMarch 24 - 28, 2025: Weekly economic update
Key market updates

MACROECONOMIC STATISTICS
INFLATION
- Core Consumer Price Index (CPI) (m/m) (February): 0.2% (prev: 0.4%);
- Consumer Price Index (CPI) (m/m) (February): 0.2% (prev: 0.5%);
- Core Consumer Price Index (CPI) (y/y) (February): 3.1% (prev: 3.3%);
- Consumer Price Index (CPI) (y/y) (February): 2.8% (prev: 3.0%).
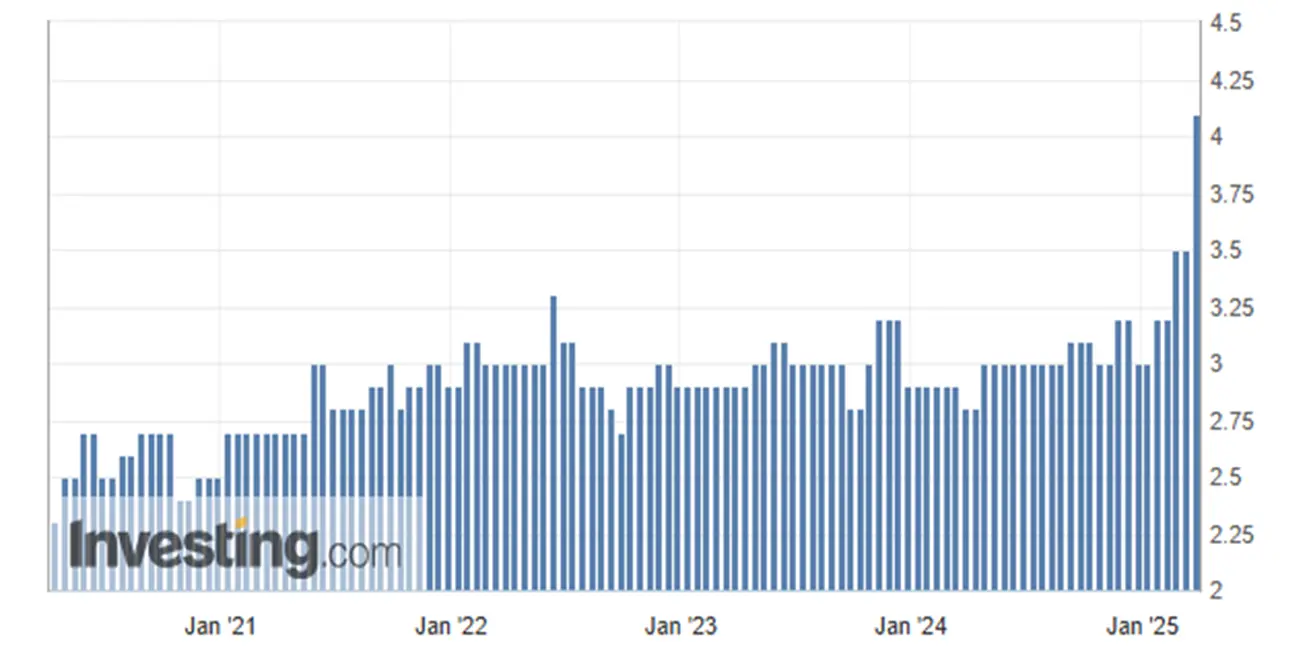
INFLATION EXPECTATIONS (MICHIGAN)
- 12-month expected inflation (March): 5.0%, prev: 4.3%;
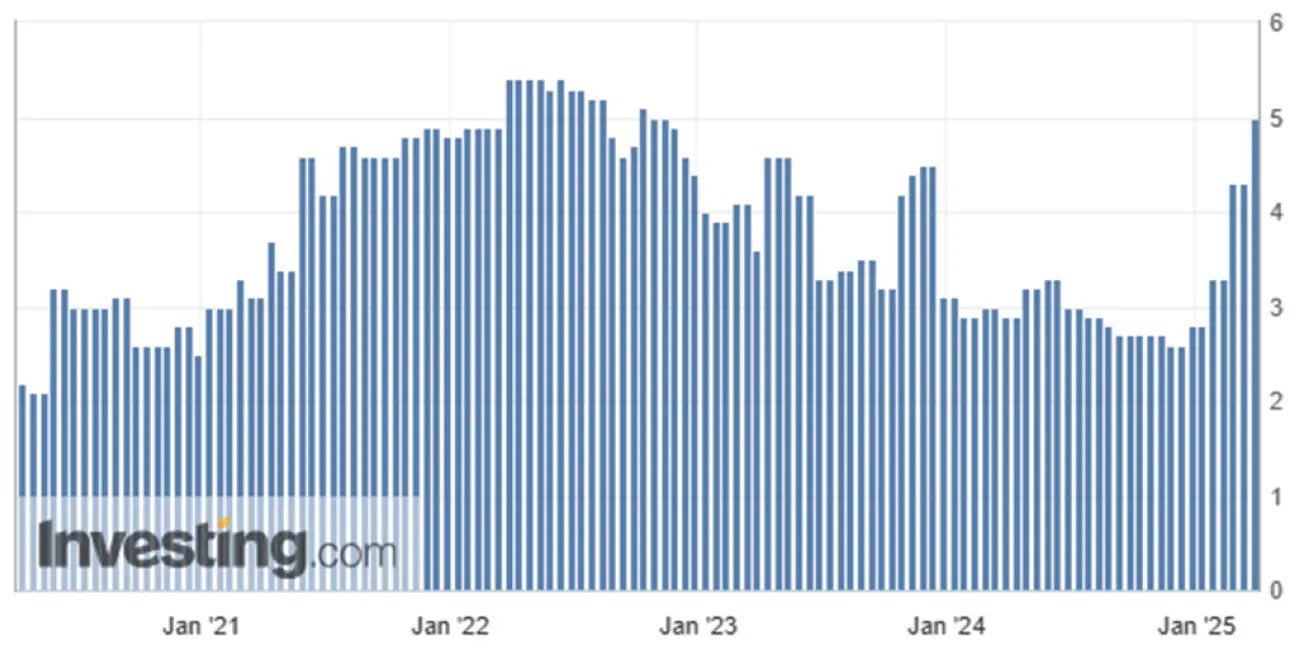
- 5-year expected inflation (March): 4.1%, prev: 3.5%.
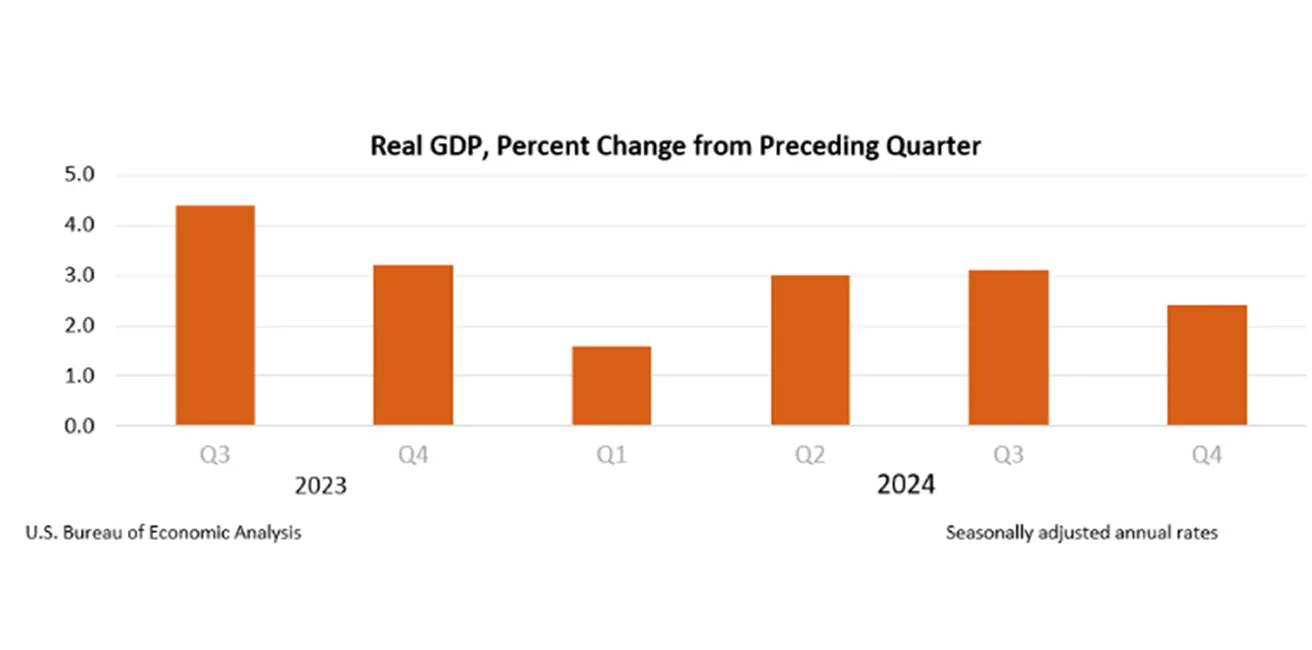
GDP (BEA – U.S. Bureau of Economic Analysis) (4Q24 annualized): (third estimate): 2.4%; second estimate: 2.3%; (3rd quarter: 3.1%).
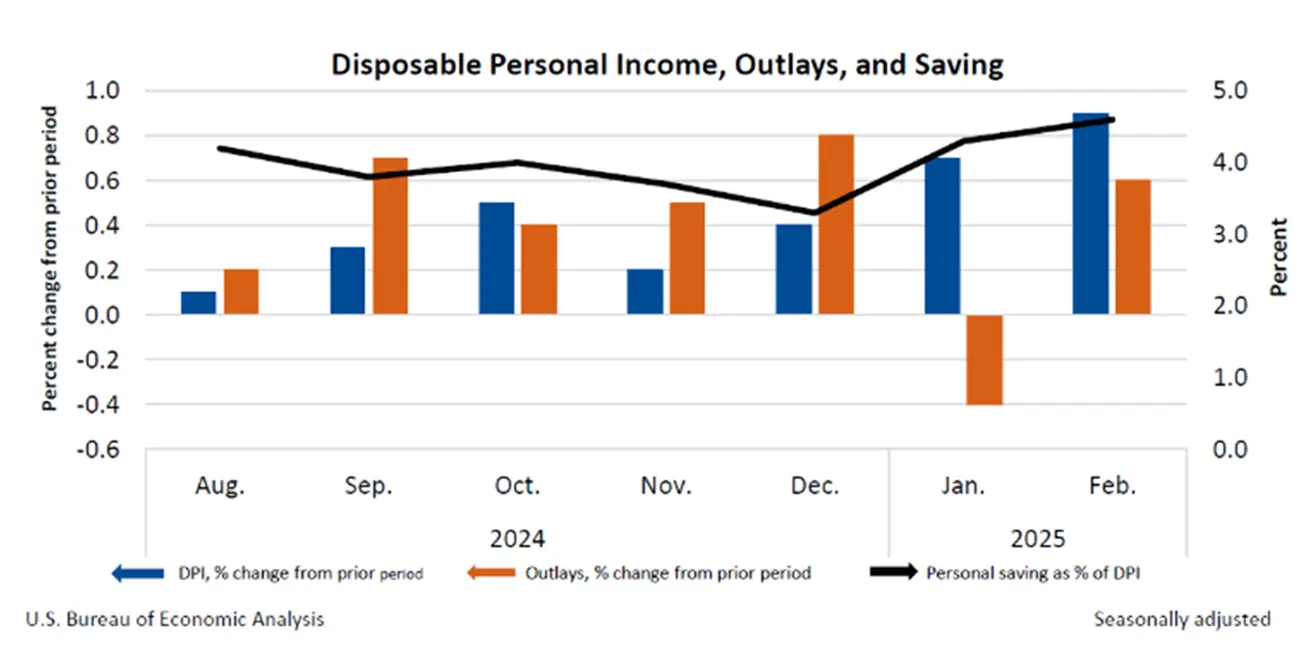
- Personal income in February increased by $194.7 billion (0.8% month-over-month);
- Personal consumption expenditures (PCE) rose by $87.8 billion (0.4%);
- Personal savings amounted to $1.02 trillion in February, with the personal savings rate—savings as a percentage of disposable personal income—standing at 4.6%.
The GDPNow indicator of the Federal Reserve Bank of Atlanta: -2.8%.
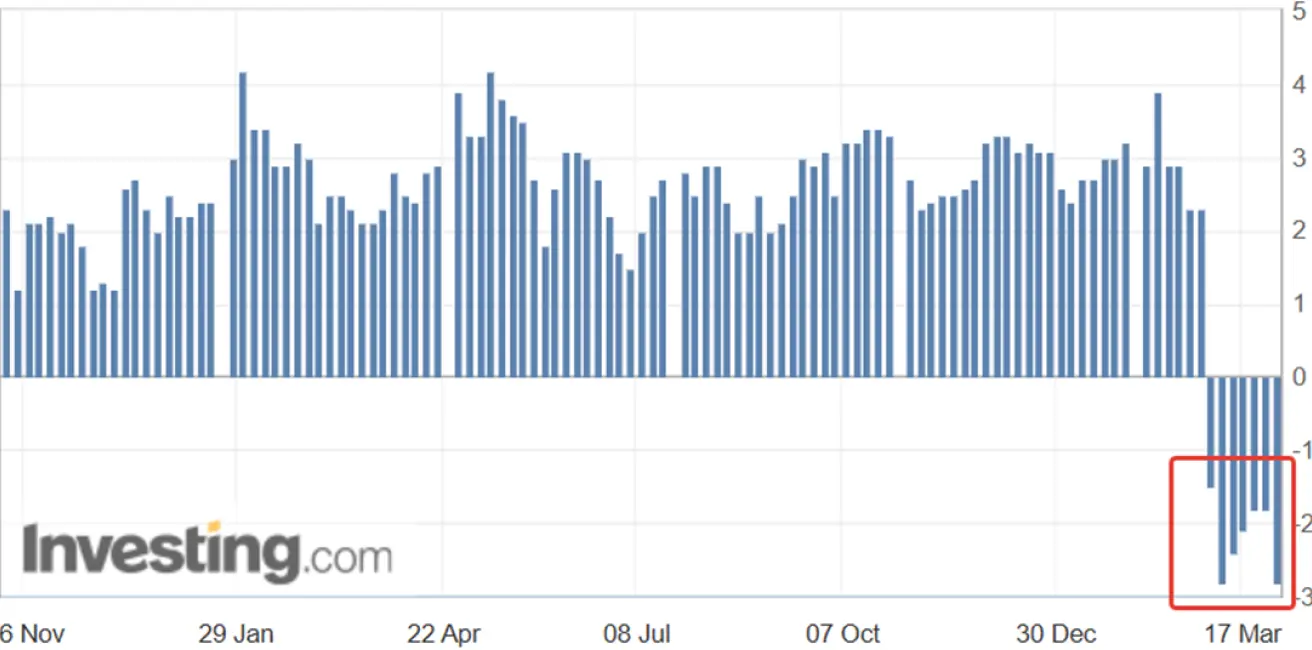 The GDPNow forecasting model provides the "current" version of the official estimate prior to its release, evaluating GDP growth using a methodology similar to that employed by the U.S. Bureau of Economic Analysis.
BUSINESS ACTIVITY INDEX (PMI):
- Services Sector (March): 54.3 (prev: 50.1);
- Manufacturing Sector (March): 49.8 (prev: 52.7);
- S&P Global Composite (March): 53.5 (prev: 51.6).
LABOR MARKET:
- Unemployment Rate (February): 4.1% (prev: 4.0%);
- The change in non-agricultural employment for February stands at 151K (prev 81K);
- Average Hourly Earnings (February, y/y): 4.0% (prev: 3.9%).
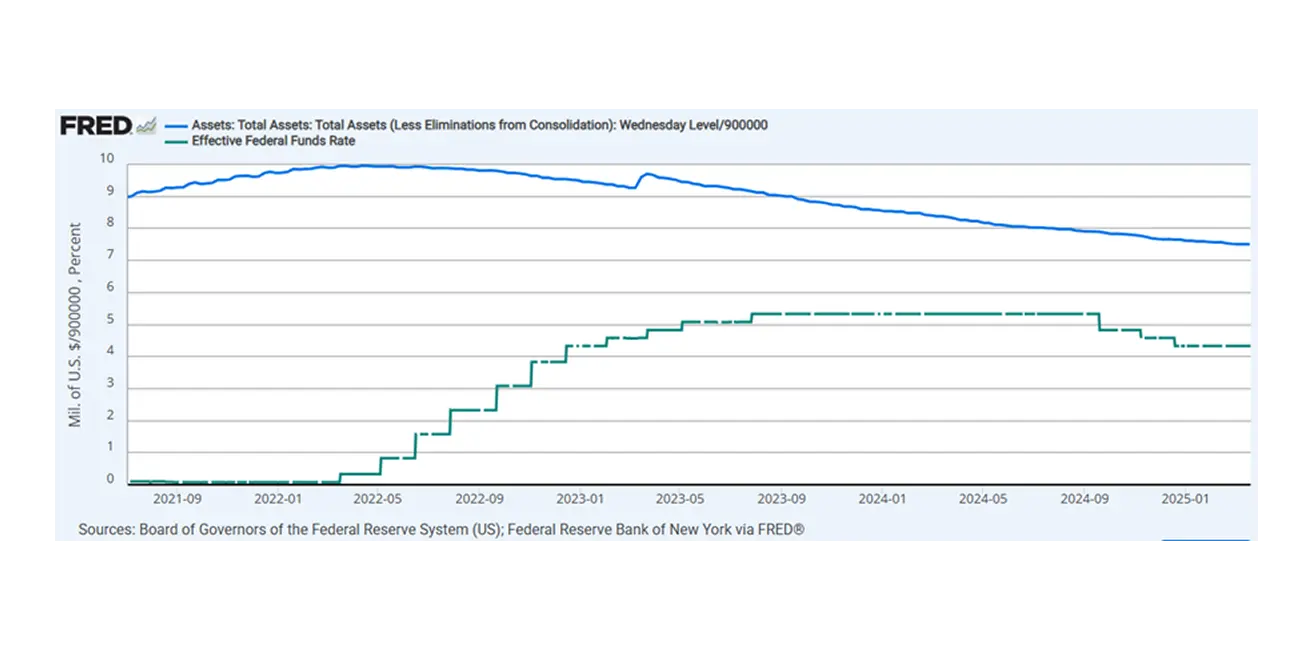
MONETARY POLICY
- Federal Funds Rate (EFFR): 4.25%–4.50% (dotted line);
- Fed Balance Sheet (blue): $6.740 trillion (vs previous week: $6.756 trillion)
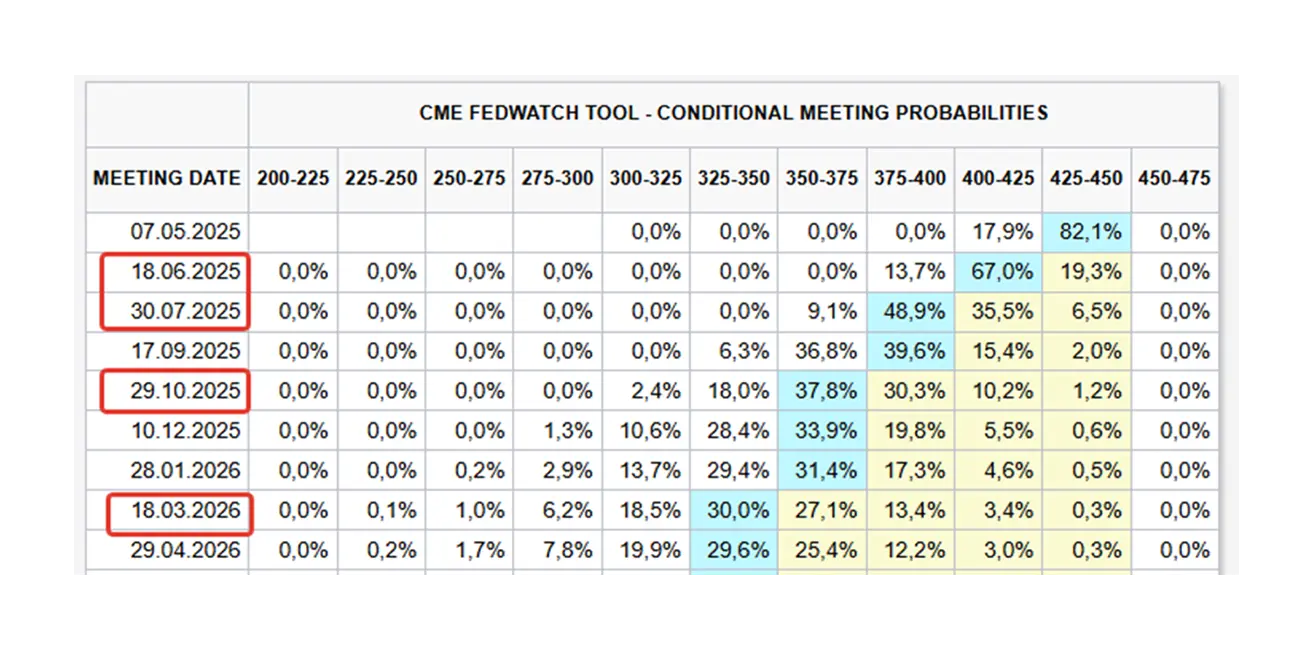
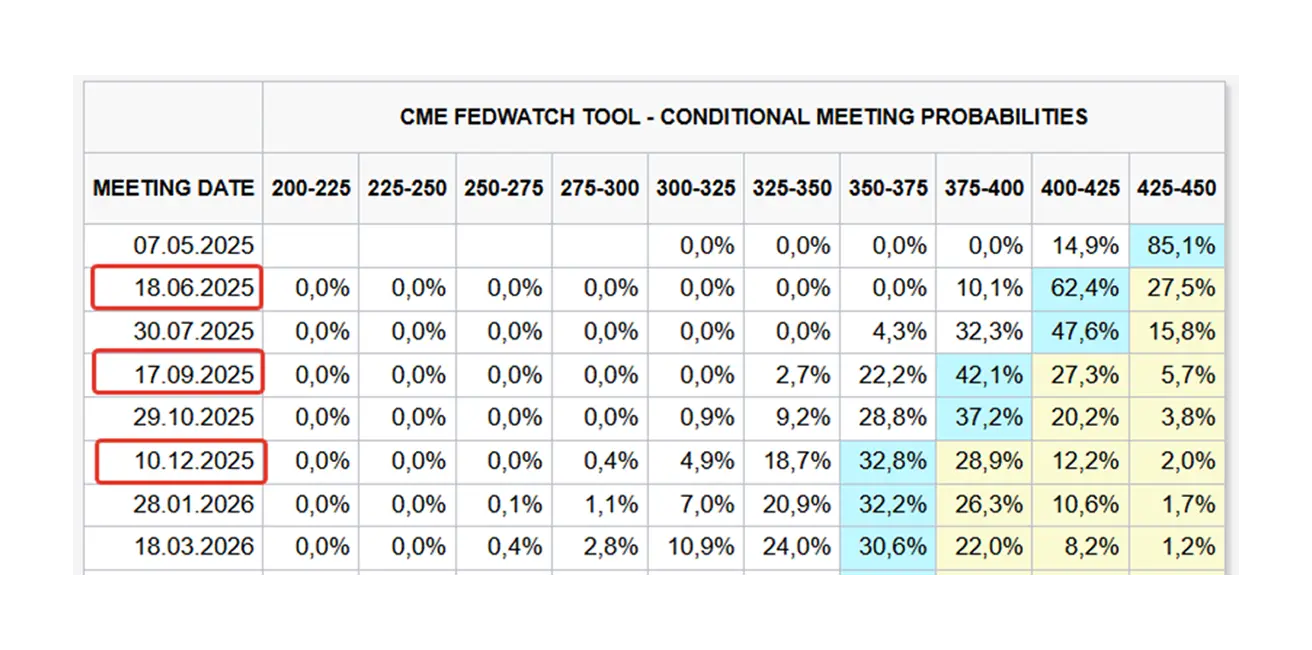
MARKET FORECAST FOR RATE
Today:
А week earlier:
Commentary: The third update on the 4th-quarter GDP release. Real GDP was revised upward by 0.1 percentage points compared to the second estimate, reaching 2.4% (with a downward revision of imports). The GDP growth in the fourth quarter primarily reflected an increase in consumer and government spending. The current GDPNow indicator from the Federal Reserve Bank of Atlanta has worsened to -2.8%, signaling a lower GDP release for the first quarter of 2025.
Amid rising incomes and increased spending, inflation expectations continue to grow. The 12-month inflation expectations rose to 5.0%, while the 5-year expectations increased to 4.1%. The current rate is 4.25-4.50%, and the Fed's balance sheet is slowing down its reduction pace.
Market expectations according to the FedWatch tool: three rate cuts of 0.25% from June to December, with an expected level of 3.50-3.75% for 2025. The market anticipates two consecutive cuts in June and July, plus a fourth in March 2026 – in this regard, the market is ahead of the Fed’s outlook.
MARKET
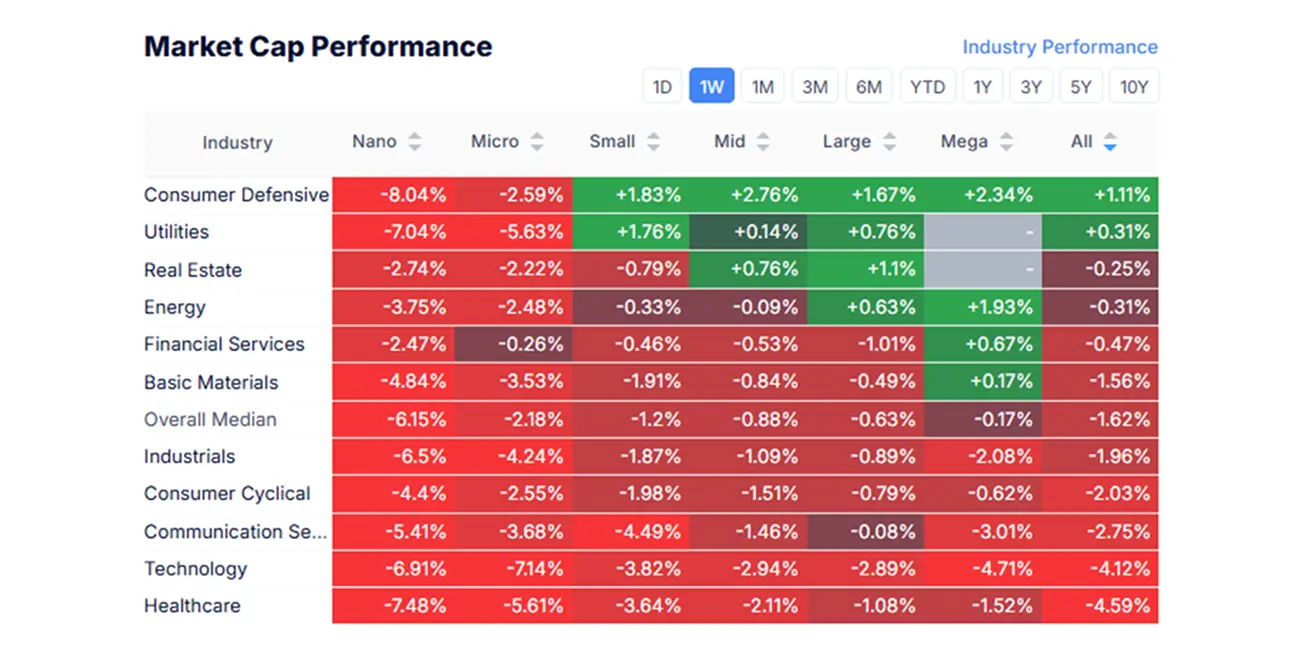
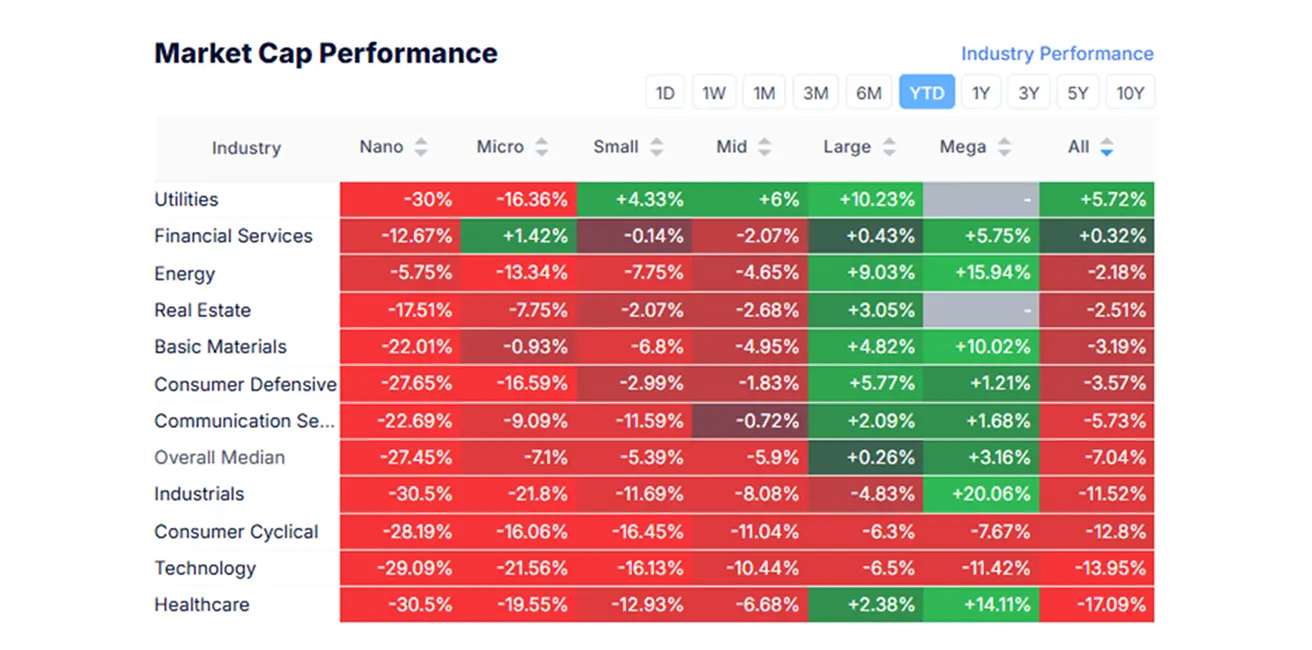
MARKET CAP PERFORMANCE
Last week, following the macroeconomic data and aggressive rhetoric from Trump (with a new tariff barrier program to be announced on April 2), the stock market continued its decline. The median drop was 1.62%. All sectors experienced sell-offs, with the exception of defensive sectors, particularly the defensive consumer sector and utilities. The underperformers were the technology and healthcare sectors.
YTD (Year-to-Date: the period from the beginning of the year to the present date).
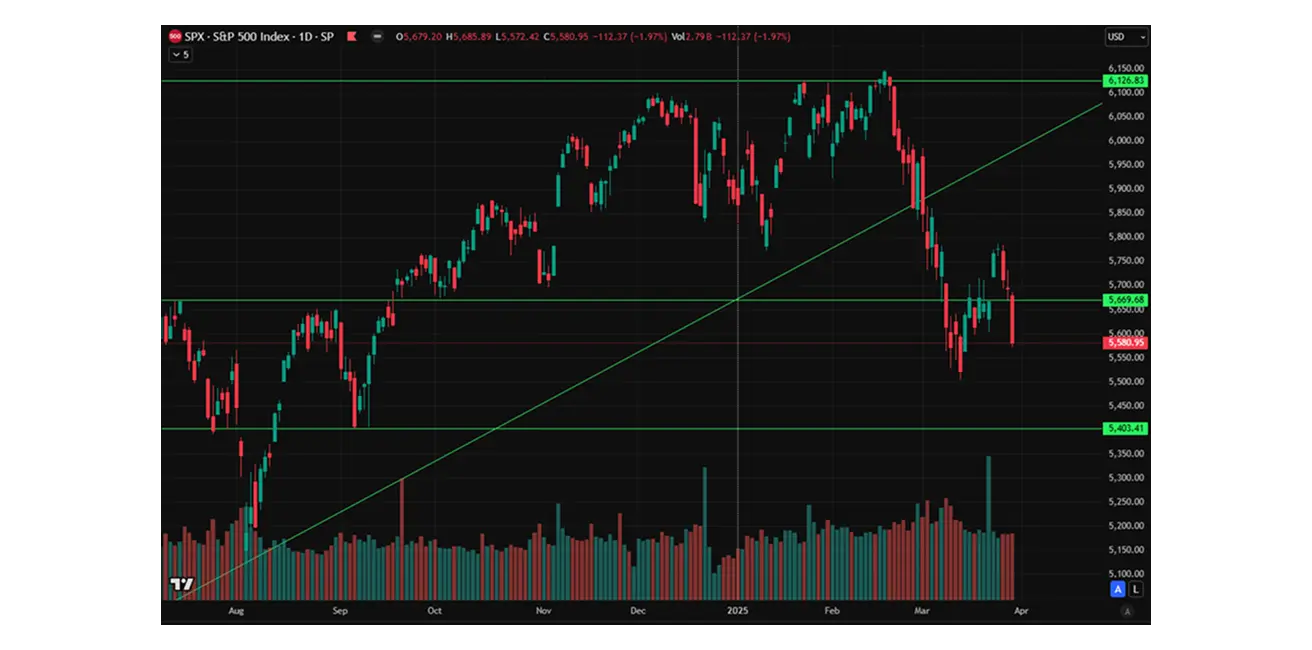
SP500
Weekly performance: -1,53% (week's closing at 5 580,95). Year-to-date fall in 2025: -5,46%.
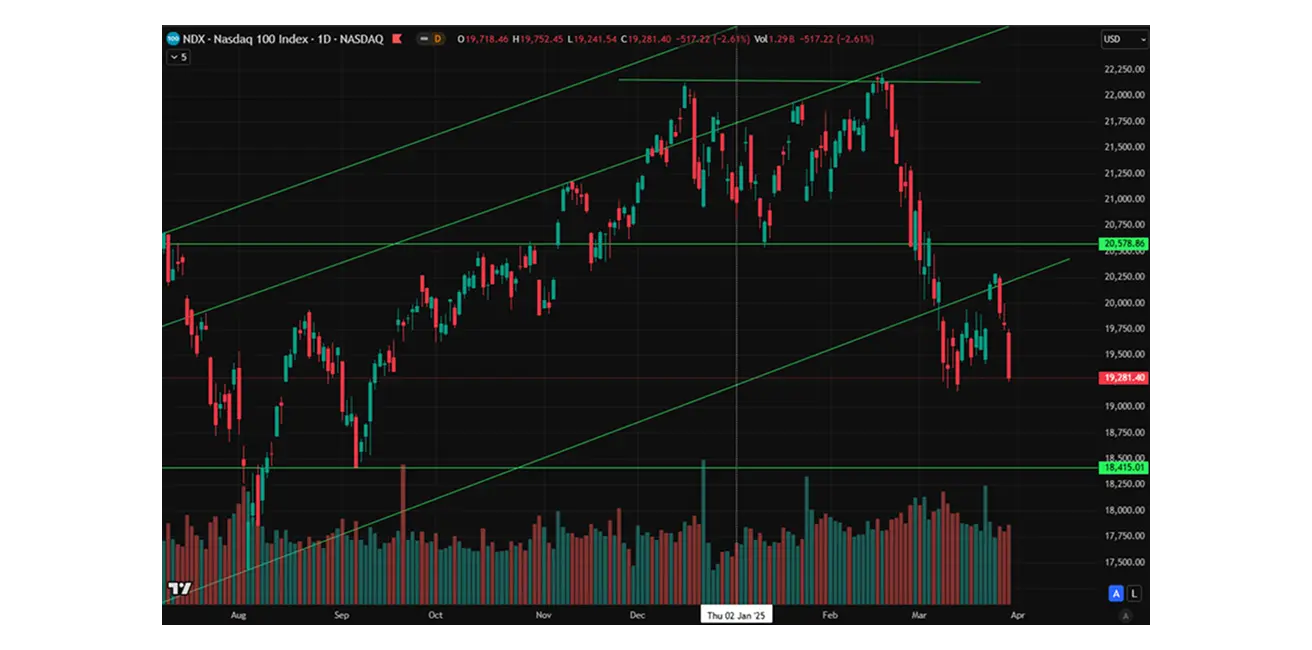
NASDAQ100
Nasdaq 100: Weekly performance: -2,39% (week’s closing at 19 281,4). Year-to-date decline in 2025: -8,71%.
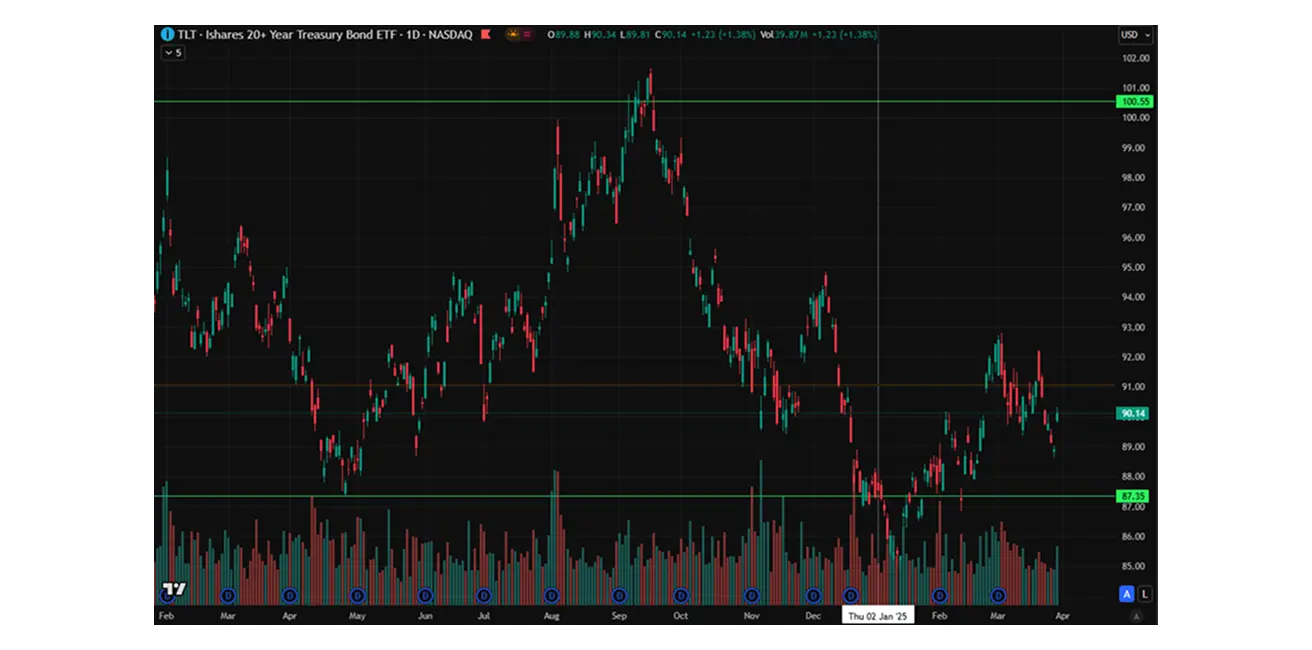
BOND MARKET
Treasury Bonds 20+ (ETF TLT): -0,62% (week’s closing at $90,14). Year-to-date performance in 2025: +2,67%.
YIELDS AND SPREADS 2025/03/31 vs 2024/03/24
- Market Yield on U.S. Treasury Securities at 10-Year Constant Maturity: 4.207% (vs 4.283%)
- ICE BofA BBB U.S. Corporate Index Effective Yield: 5.43% (vs 5.32%)
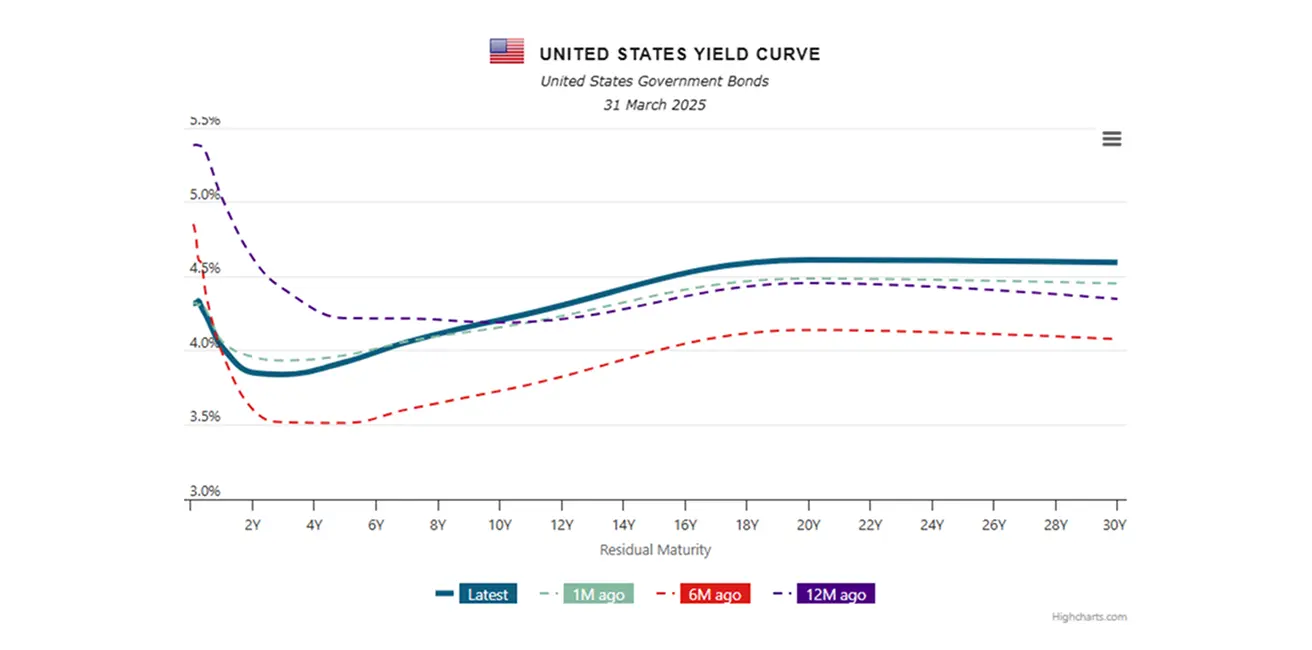
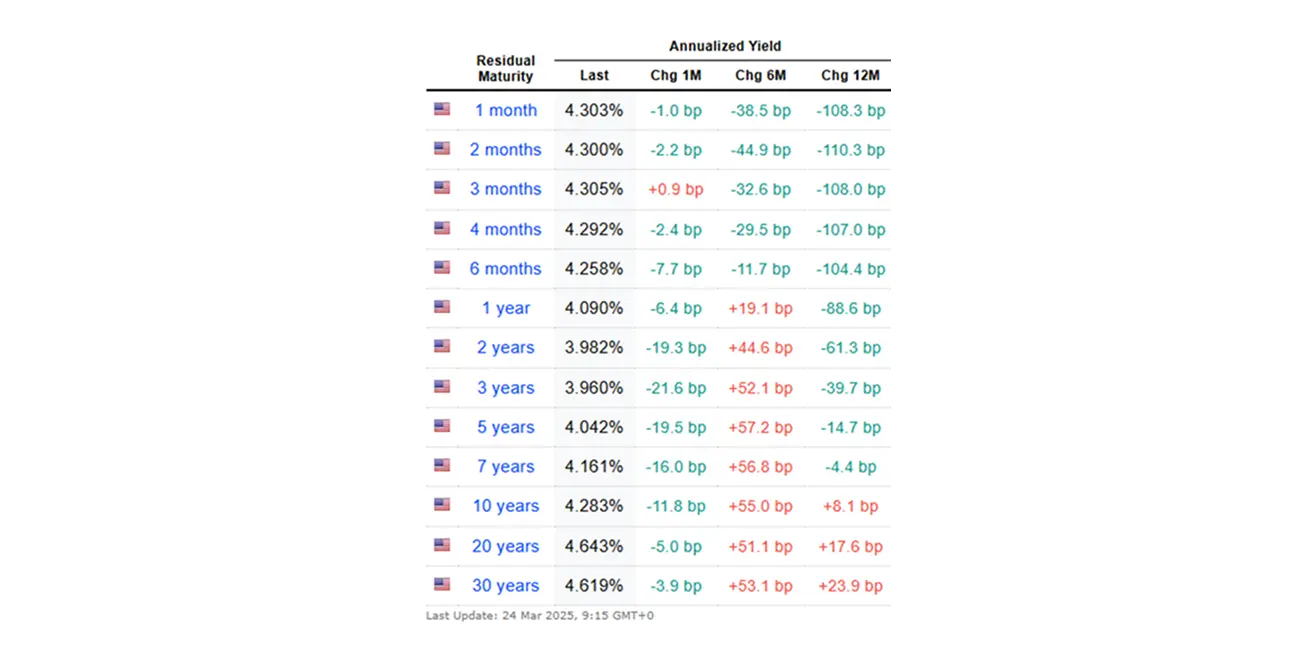
The yield spread between 10-year and 2-year U.S. government bonds stands at 35.3 vs. 30.1 basis points (the difference in yield between long-term and short-term debt).
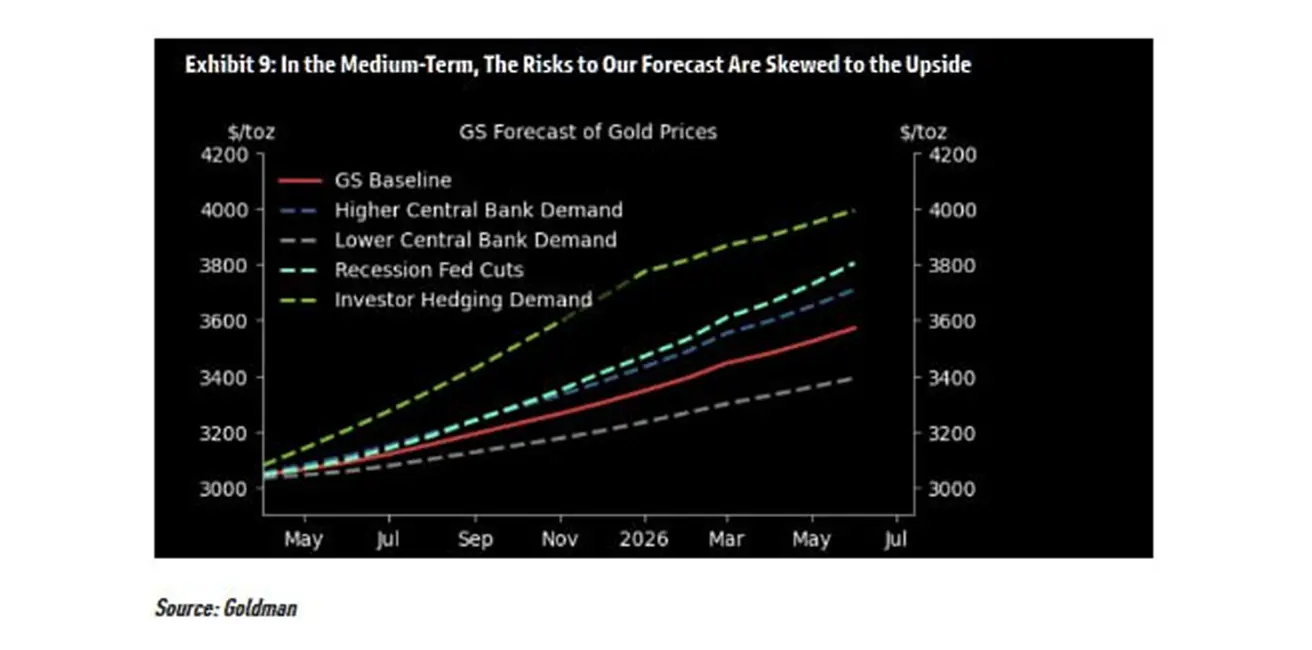
GOLD FUTURES (GC)
- Gold futures: +4,17%, weekly close at $3 154,4 per troy ounce.
- Year-to-date 2025: +19,45%.
According to Goldman Sachs' forecast (bottom chart), in the event of a negative scenario, gold could soar to $4,500 within 12 months. The negative scenario is defined by a prolonged escalation of trade wars, a slowdown in the global economy, and rising inflation. In the case of a recession, the bank forecasts a rise to $3,800.
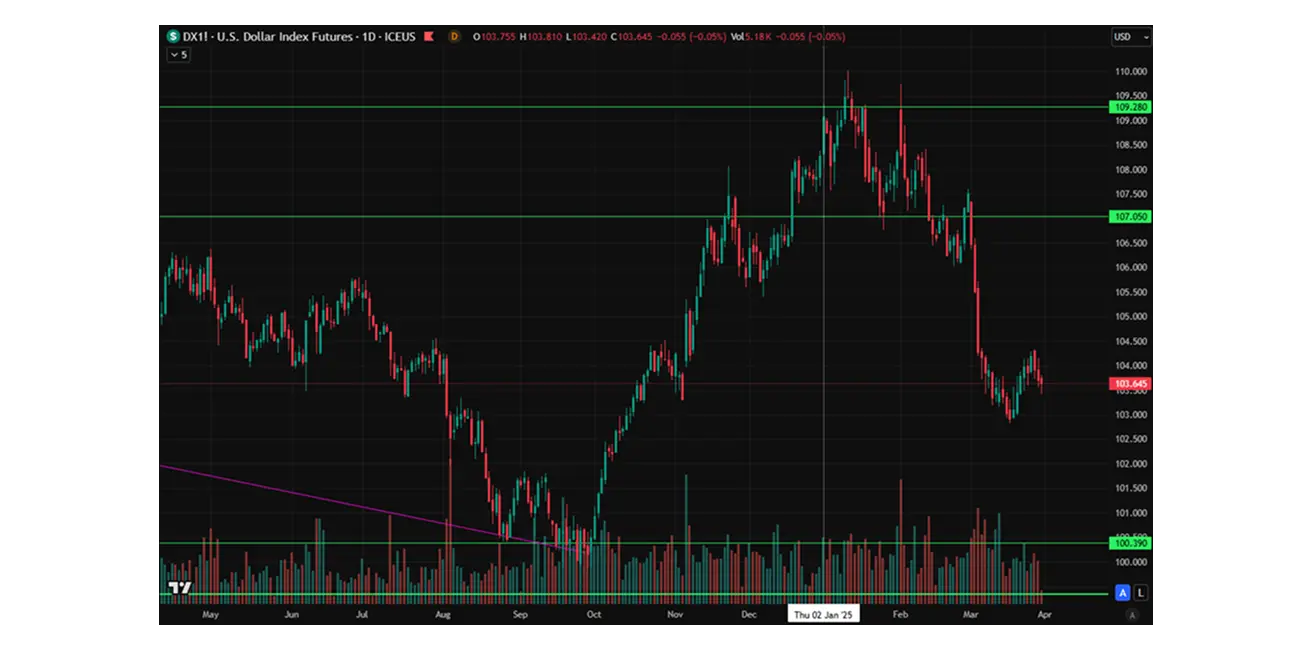
DOLLAR INDEX FUTURES (DX)
- U.S. Dollar Index futures (DX): -0,13%, weekly close at 103,65.
- Year-to-date 2025: -4,32%.
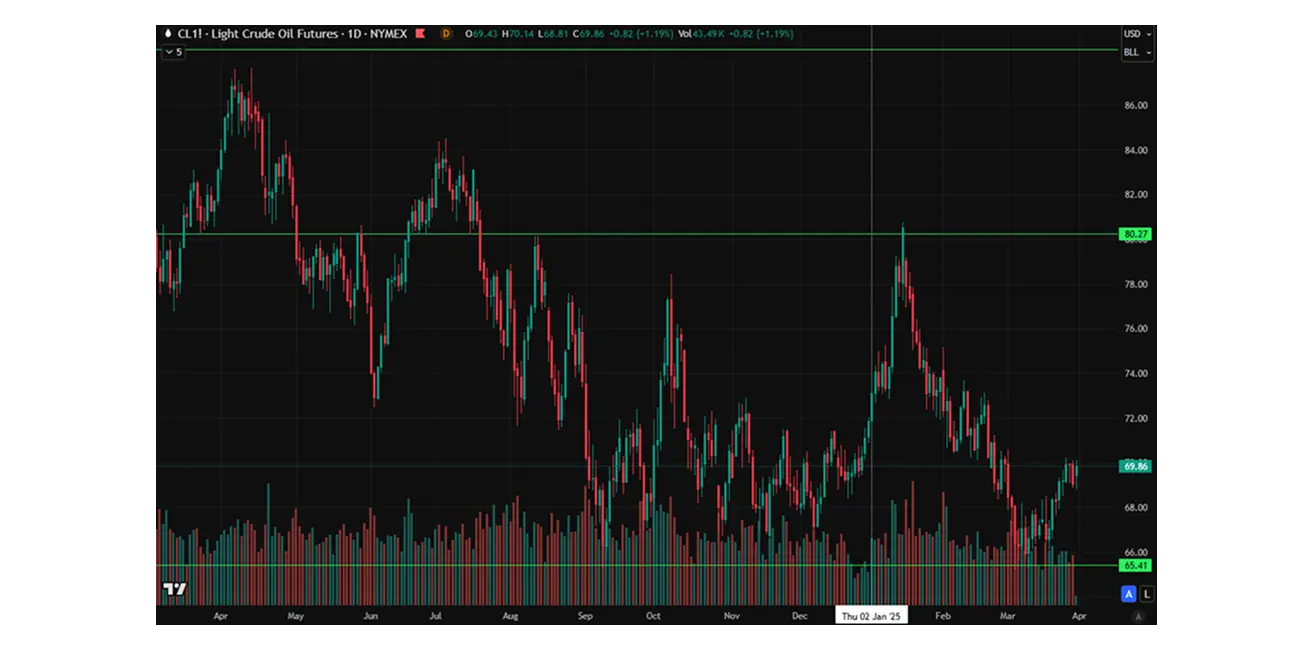
OIL FUTURES
- Weekly performance: +1,10%, closing at $69,04 per barrel.
- Year-to-date performance: - 3,91%.
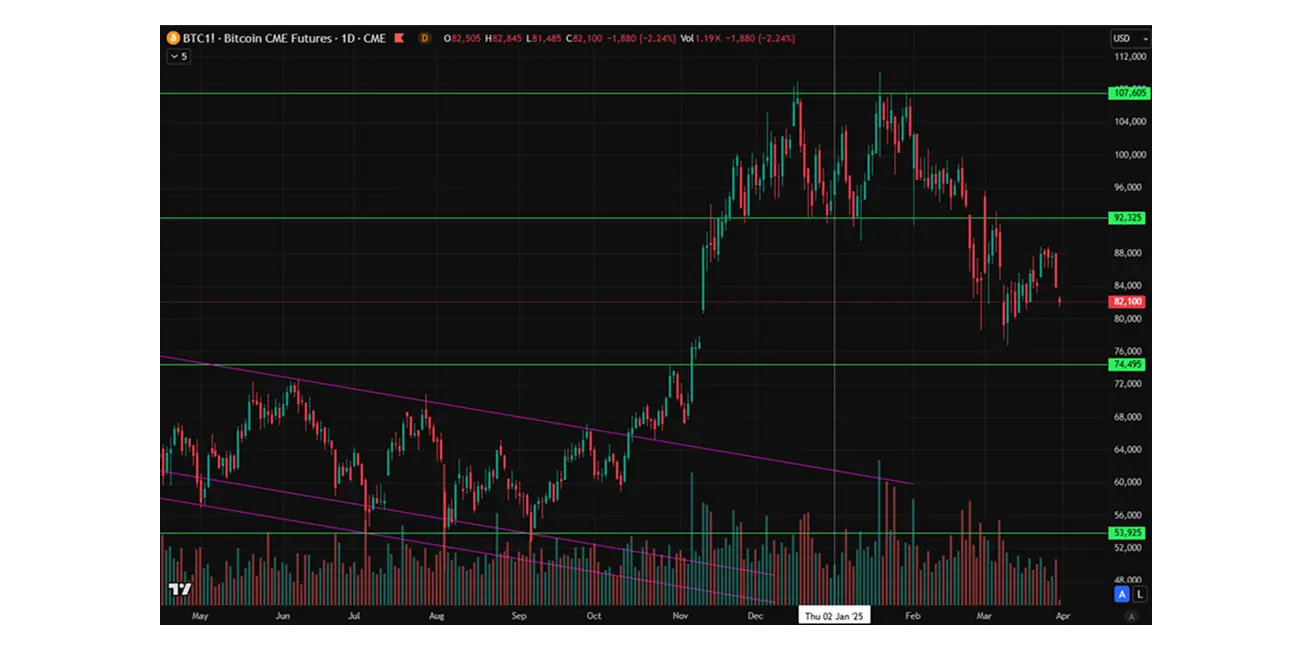
BTC FUTURES
- Weekly performance: -0,24% ($83980).
- Year-to-date performance in 2025: -11,85%.
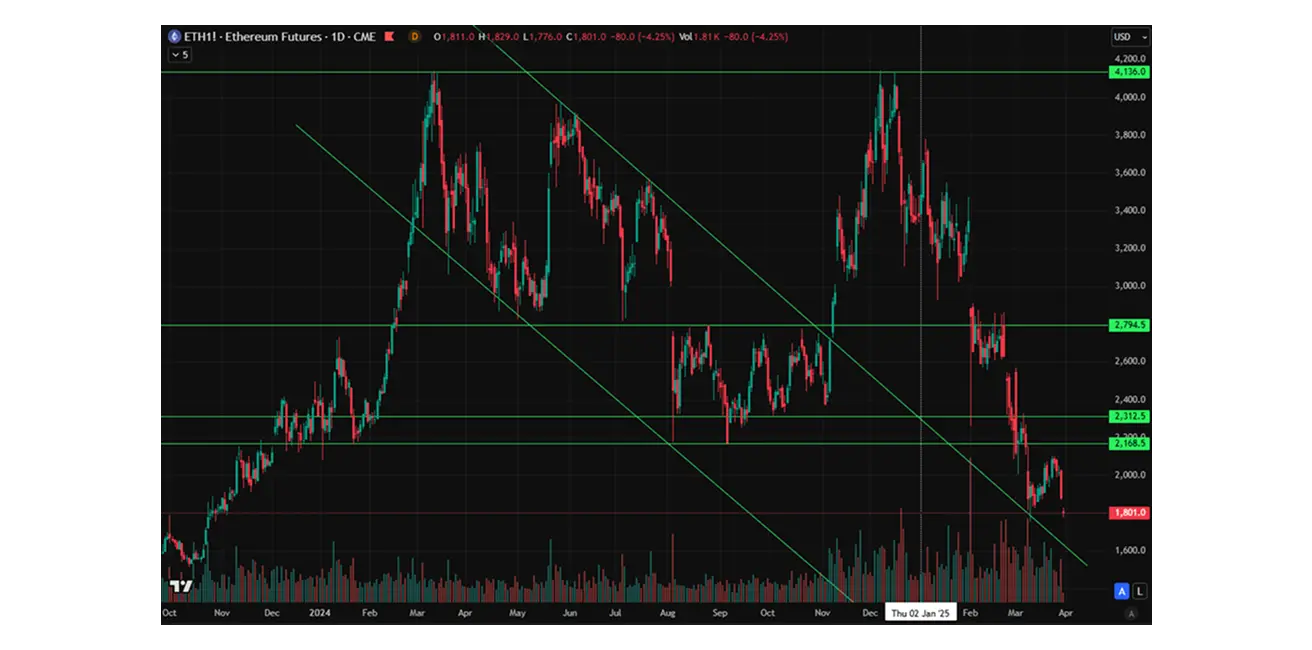
ETH FUTURES
- Weekly performance: -4,76% ($1881,0).
- Year-to-date performance in 2025: -44,41%.
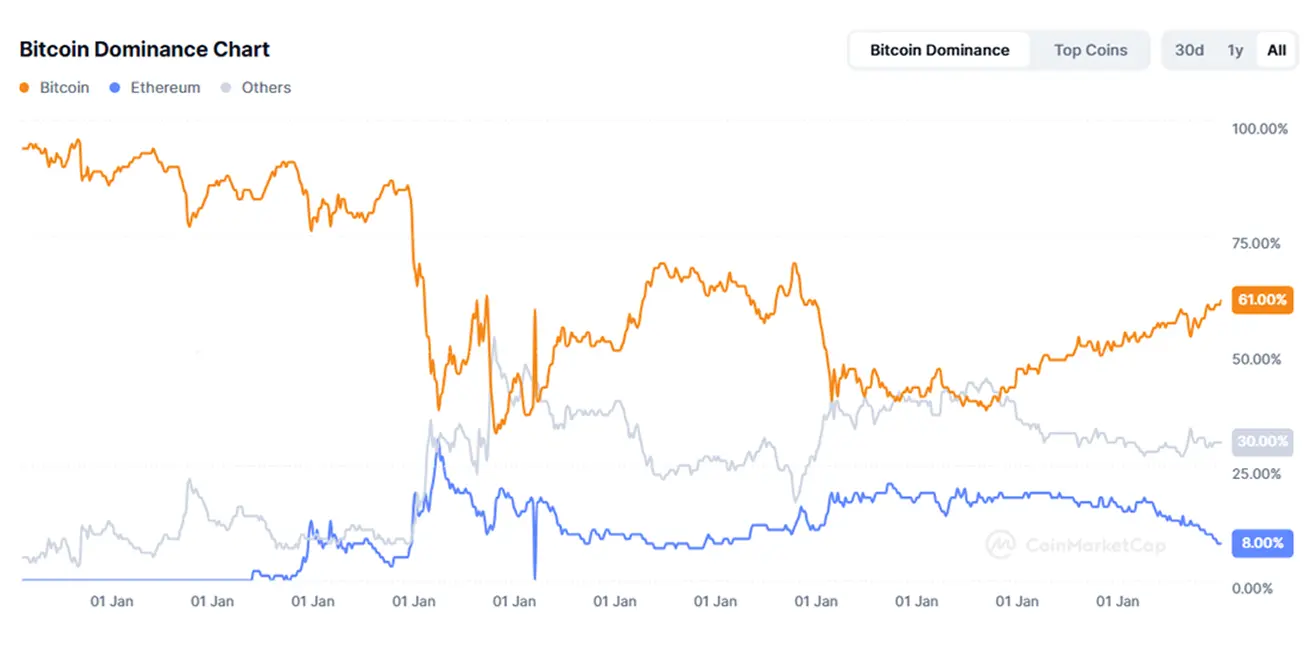
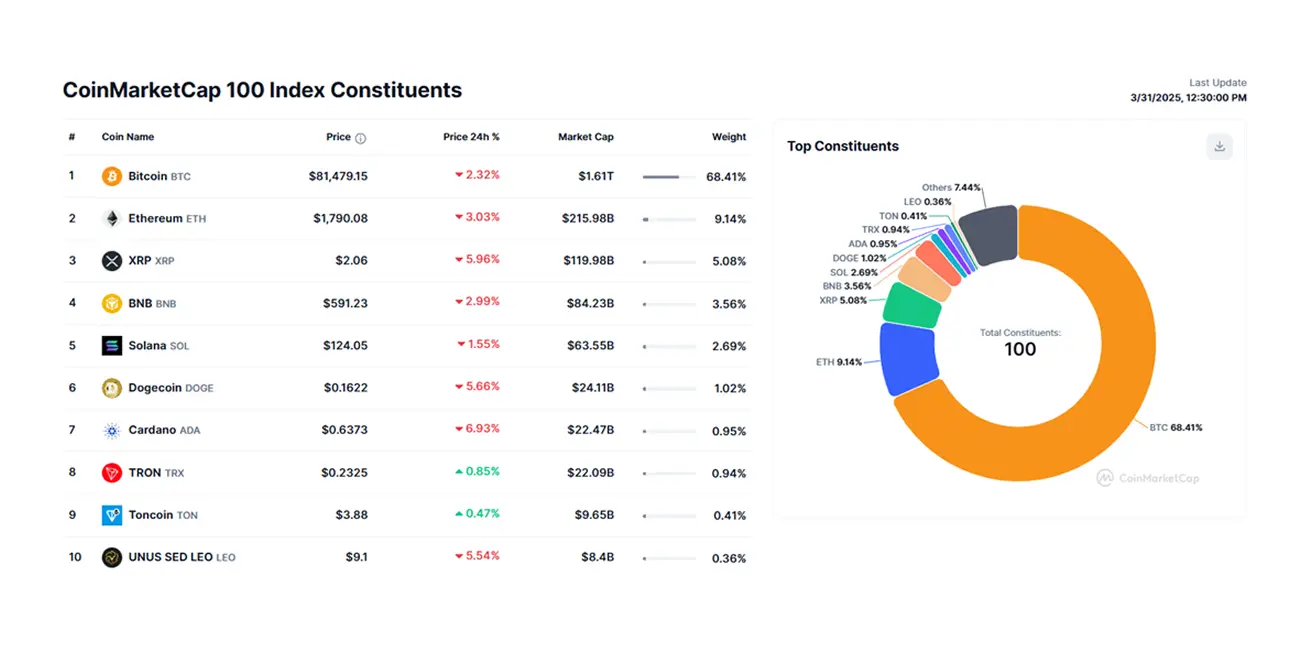
The market capitalization of the cryptocurrency market stands at $2.63 trillion, compared to $2.86 trillion the previous week (coinmarketcap.com).
- Bitcoin dominance: 61.0% (previously 61.0%),
- Ethereum dominance: 8.2% (previously 8.8%),
- Others: 30.3% (previously 30.5%).