 Lietuvių
 Русский
 Қазақша
 Eesti
EestiSeptember 16 — 20: Weekly economic update
Key market insights

In our weekly column, we share with you the main macroeconomic indicators for the market.
MACROECONOMIC STATISTICS
INFLATION
- Core Consumer Price Index (CPI) (YoY) (June): 3.2%, (pre: 3.2%);
- Consumer Price Index (CPI) (YoY) (June): 2.5%, (pre: 2.9%).
THE FED'S INFLATION TARGET
- Core price index of personal consumption expenditure PCE (YoY) (July): 2.6% (pre: 2.6%);
- The price index of personal consumption expenditures (YoY) (July): 2.5%, (pre: 2.5%).
INFLATION EXPECTATIONS
- 12-month expected inflation (August): 2.7%, (pre: 2.8%);
- 5-year expected inflation (August): 3.1% (pre: 3.0%).
GDP (q/q) (2Q.) (second estimate): 3.0% (first: 2.8%, pre: 1.4%), GDP deflator (q/q) (2 Q.): 2.5% (pre: 3.1%).
Federal Reserve Bank of Atlanta GDPNow: Q3 2,9% (pre: 3,0%):
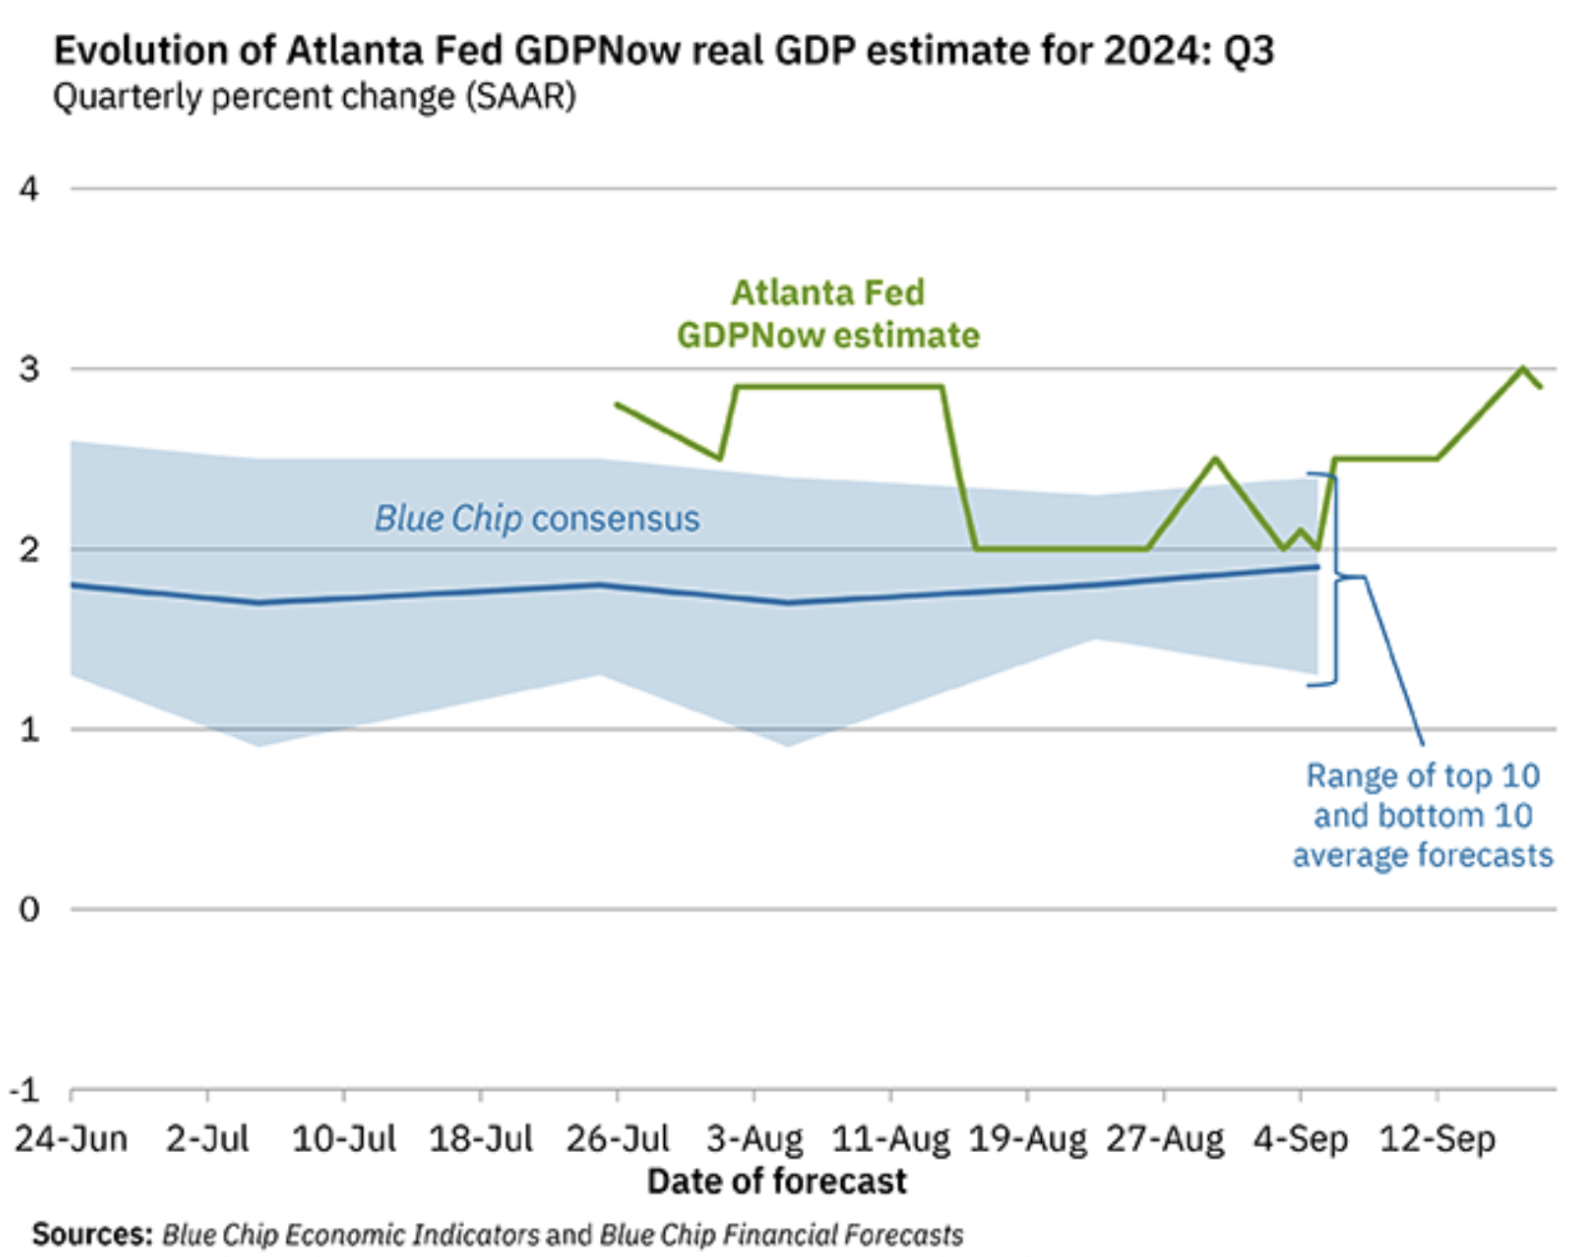
The Atlanta Fed's GDPNow forecasting model estimates GDP growth using a methodology similar to that employed by the U.S. Bureau of Economic Analysis (BEA).
GDPNow is not an official forecast; rather, it is best viewed as a real-time estimate of actual GDP growth based on available economic data for the current measured quarter. Typically, these releases correlate well, and current forecasts remain at elevated levels.
BUSINESS ACTIVITY INDEX (PMI)
- Services sector (June): 55.7 (pre: 55.0);
- Manufacturing sector (August): 47.9 (pre: 49.6, review).
- S&P Global Composite (June): 54.6 (pre: 54.3, review).
LABOR MARKET
- Unemployment rate (August): 4.2% (pre: 4.3%);
- Non-farm Payrolls (August): 142K (pre: 89K, review);
- Change in non-farm private sector employment (August): 118K, (pre: 74K, review);
- Average hourly earnings (August, YoY): 3.8%, (pre: 3.3%);
- Number of initial applications for unemployment benefits: 219K, (pre: 231K, review).
MONETARY POLICY
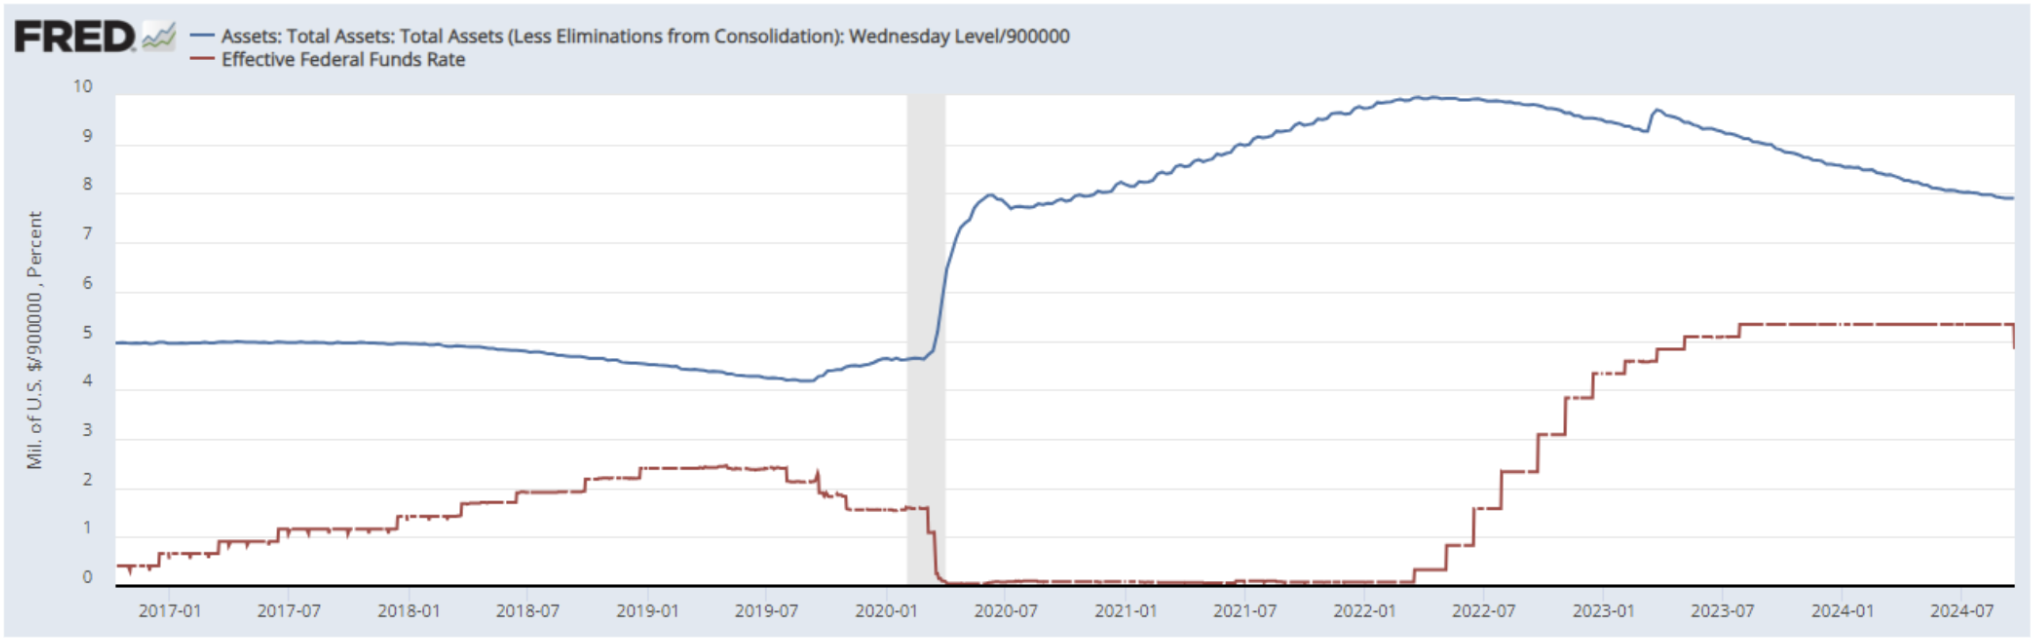
- Federal Funds Rate (EFFR) — 4.75%-5.00% (in red line);
- Fed balance sheet (blue) declined from the previous week: $7.109 trillion (vs last week: $7.115 trillion).
MARKET FORECAST FOR RATE
Today VS a week ago:
COMMENTARY
The Federal Reserve reduced the federal funds rate by 0.05% to a range of 4.75%-5.00%. Macroeconomic statistics and current financial conditions based on the NFCI and ANFCI indices allow the regulator to proceed cautiously without rushing into further rate cuts. This leads the market to question why the decision was made. There are several potential reasons:
- A political move ahead of the U.S. presidential election;
- The Federal Reserve foresees high risks ahead in the economy and financial markets;
- The rapid pace of government borrowing at high rates in 2023-2024, which could result in a sharp increase in debt servicing costs.
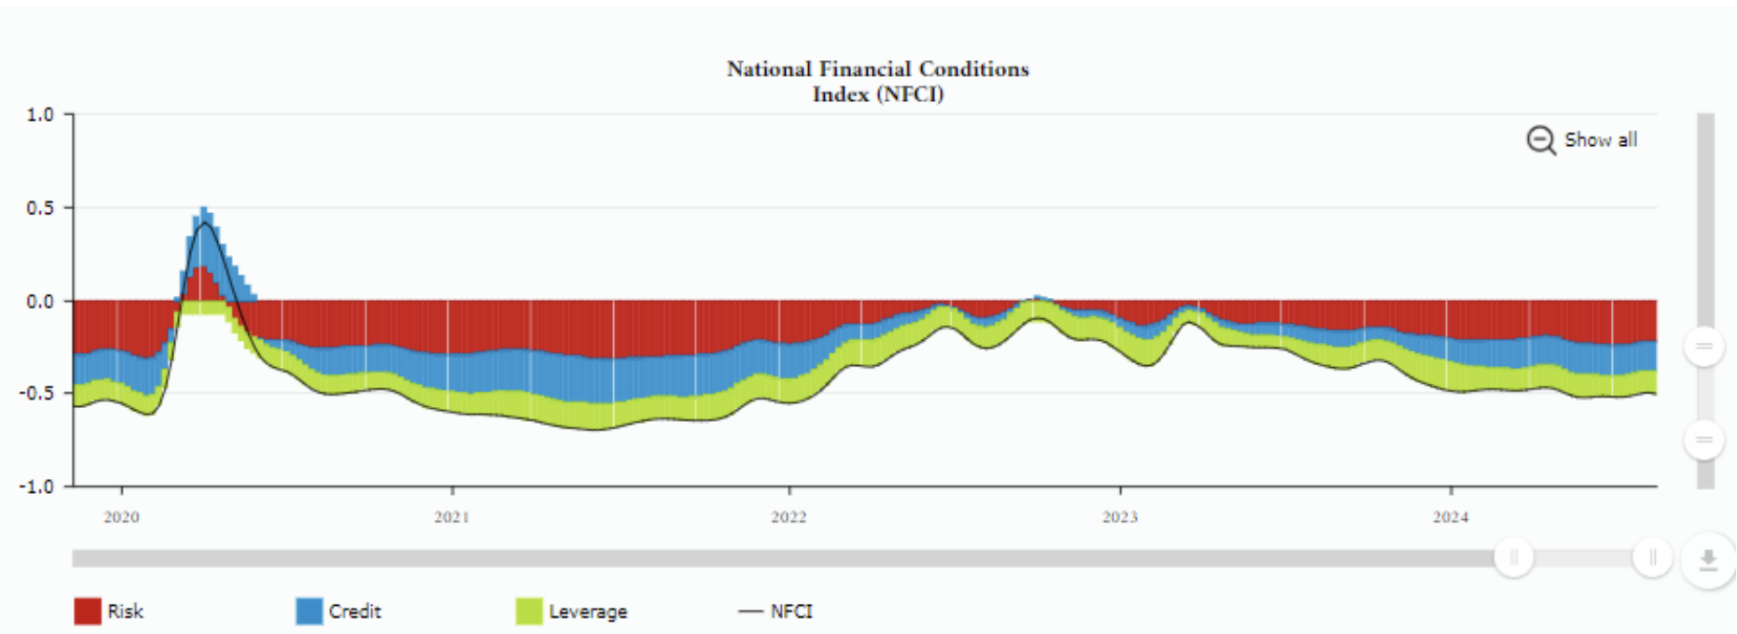
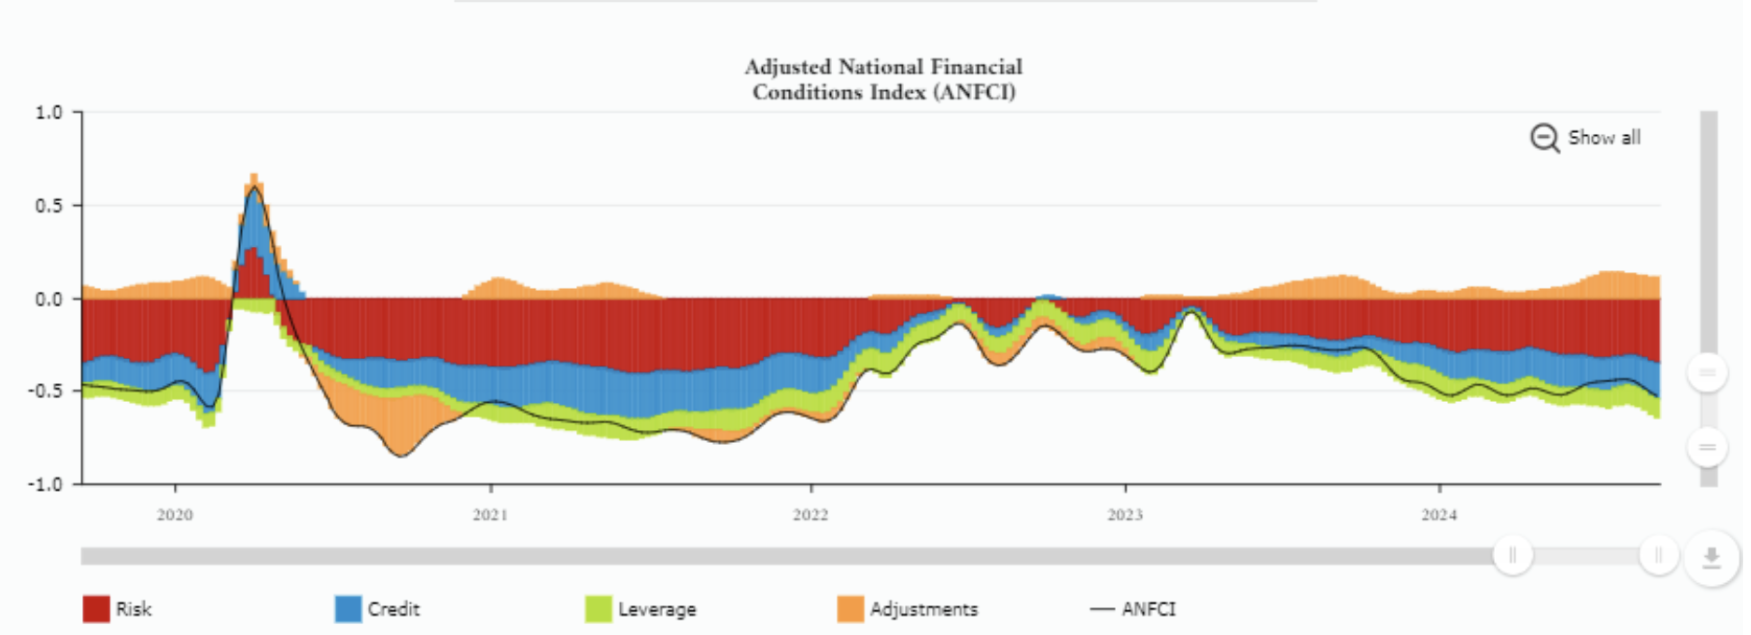
The NFCI and ANFCI indices, calculated by the Federal Reserve Bank of Chicago, reflect financial conditions in the U.S. across money markets, debt markets, and equity markets. Positive values indicate tighter financial conditions, while negative values (current) represent looser financial conditions:
The St. Louis Federal Reserve Financial Stress Index shows a value below zero, indicating that financial market stress is below the historical average:
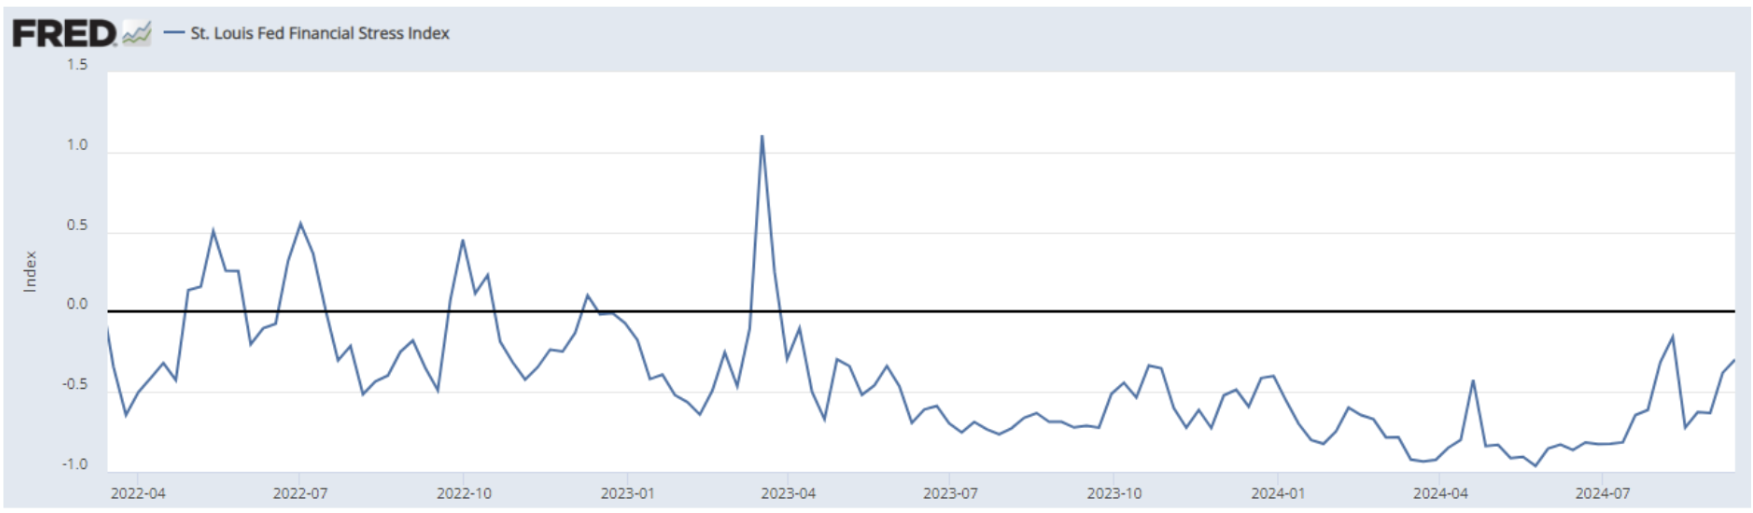
This index is built on 18 weekly data series: seven interest rate series, six yield spreads, and five other indicators. The index’s average, starting from the end of 1993, is designed to equal zero. Therefore, a value of zero represents normal financial market conditions. Values below zero indicate that financial market stress is lower than the historical average, while values above zero suggest that financial market stress is higher than the average.
Despite this, the Federal Reserve made a significant move by cutting the rate by 0.5%.
The third explanation may make sense here.
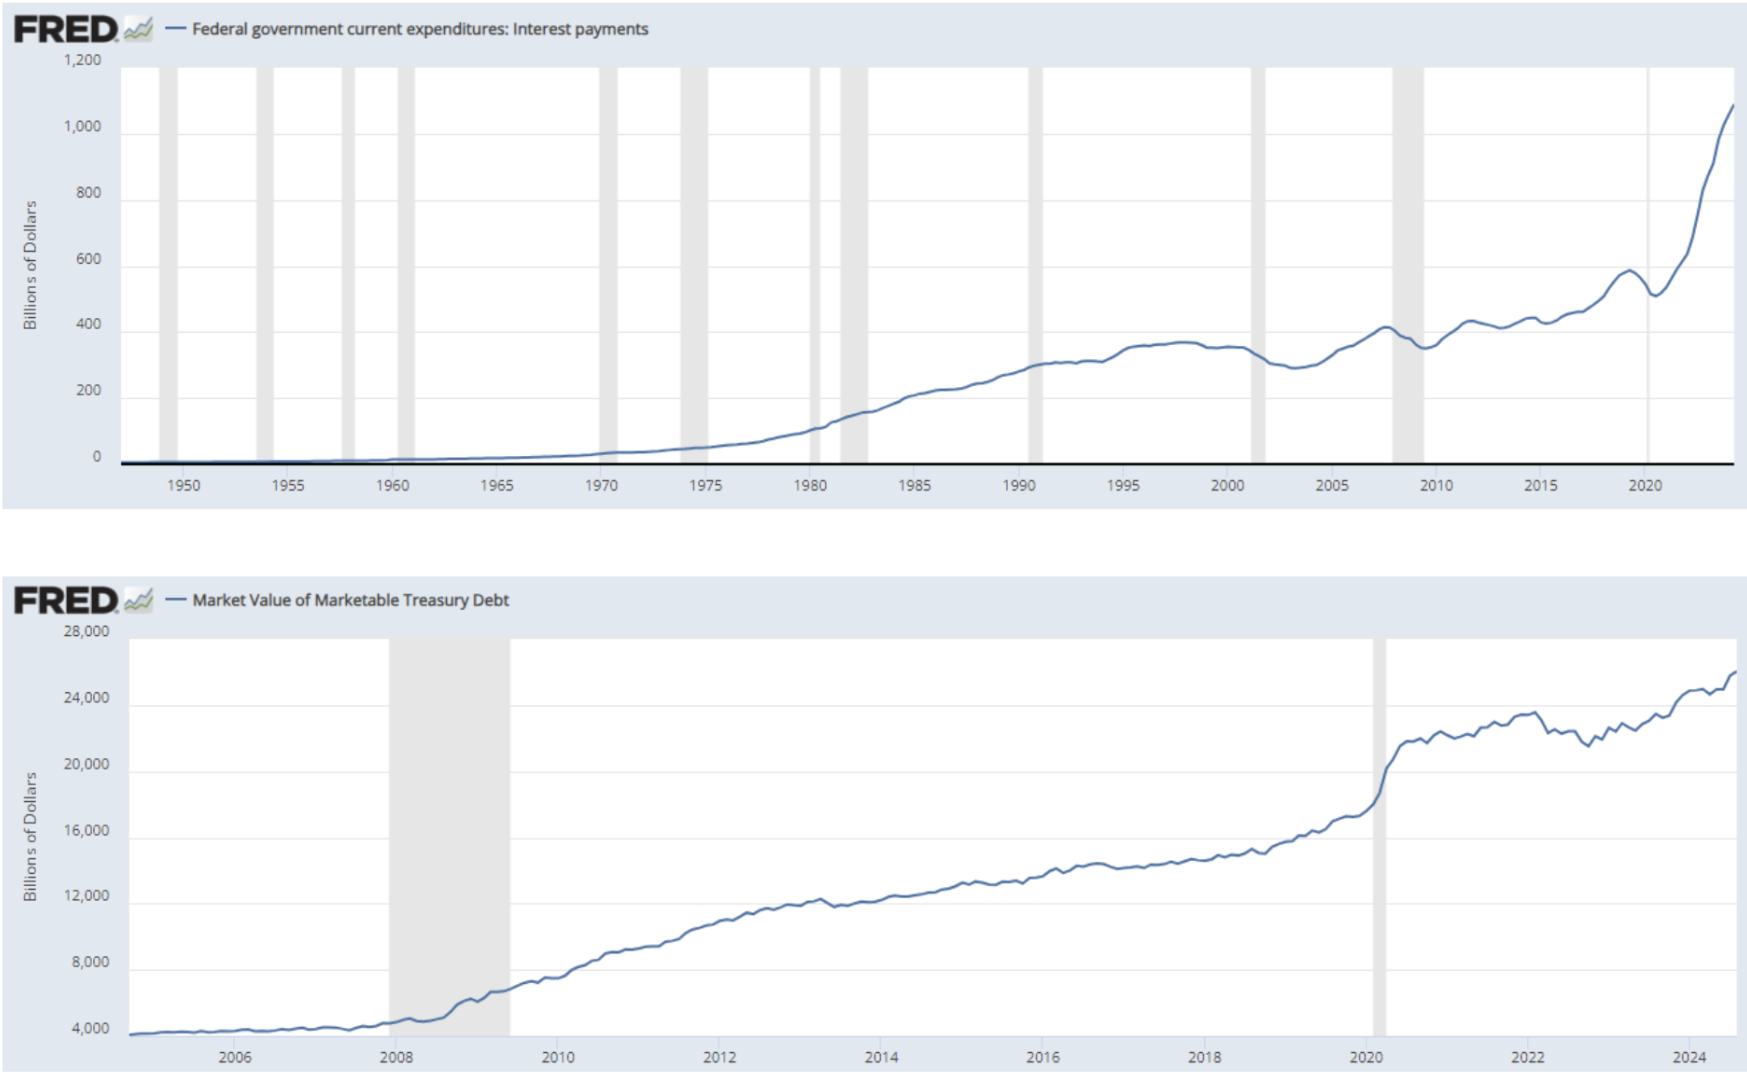
The top chart shows that the U.S. net debt has risen to $26 trillion, with the cost of servicing the debt exceeding $1 trillion. Both presidential candidates, Trump and Harris, are planning to significantly increase government spending.
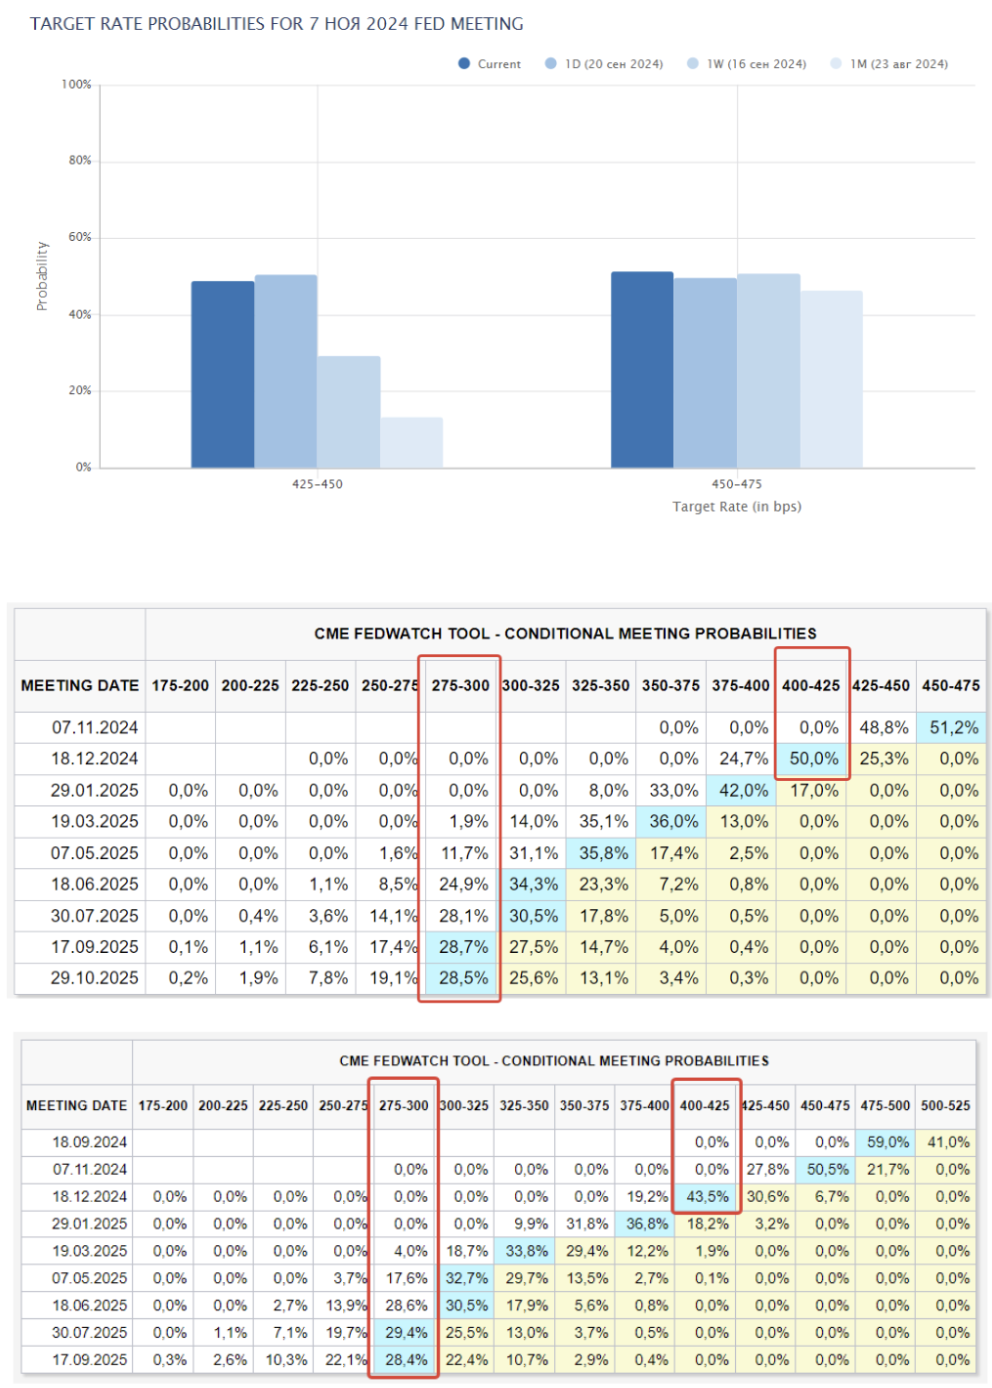
According to the FedWatch tool, the market estimates a 0.75% rate cut by the end of the year (0.25% in November and 0.50% in December), bringing the federal funds rate to a range of 3.75%-4.00%. Over the next 12 months, the market anticipates a further 2.00% reduction, lowering the rate to a range of 2.75%-3.00%.
MARKET
MARKET CAP PERFORMANCE
The stock market:
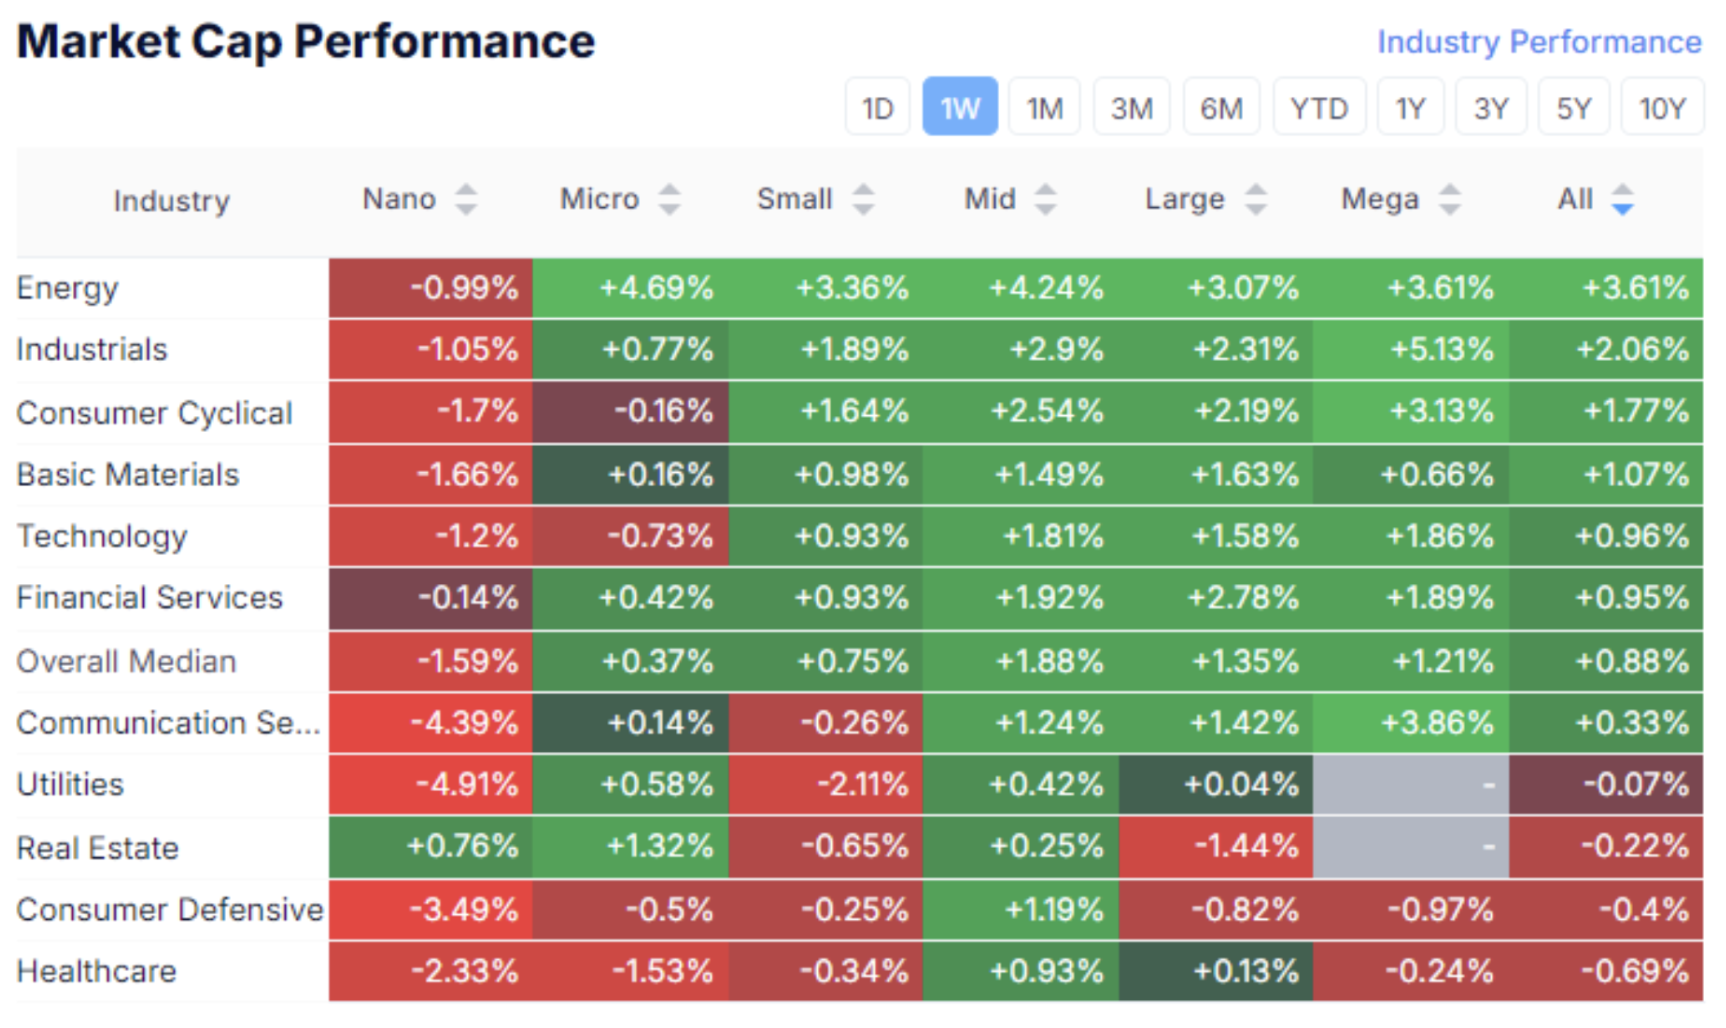
The median stock market growth was 0.88%. The leaders were the energy, industrial, and consumer cyclicals sectors (durable goods).
Defensive sectors (utilities, real estate, non-cyclical consumer goods, and healthcare) were the underperformers. This distribution indicates a sustained appetite for risk following the Federal Reserve meeting, based on last week's trading results.
SP500
VIX
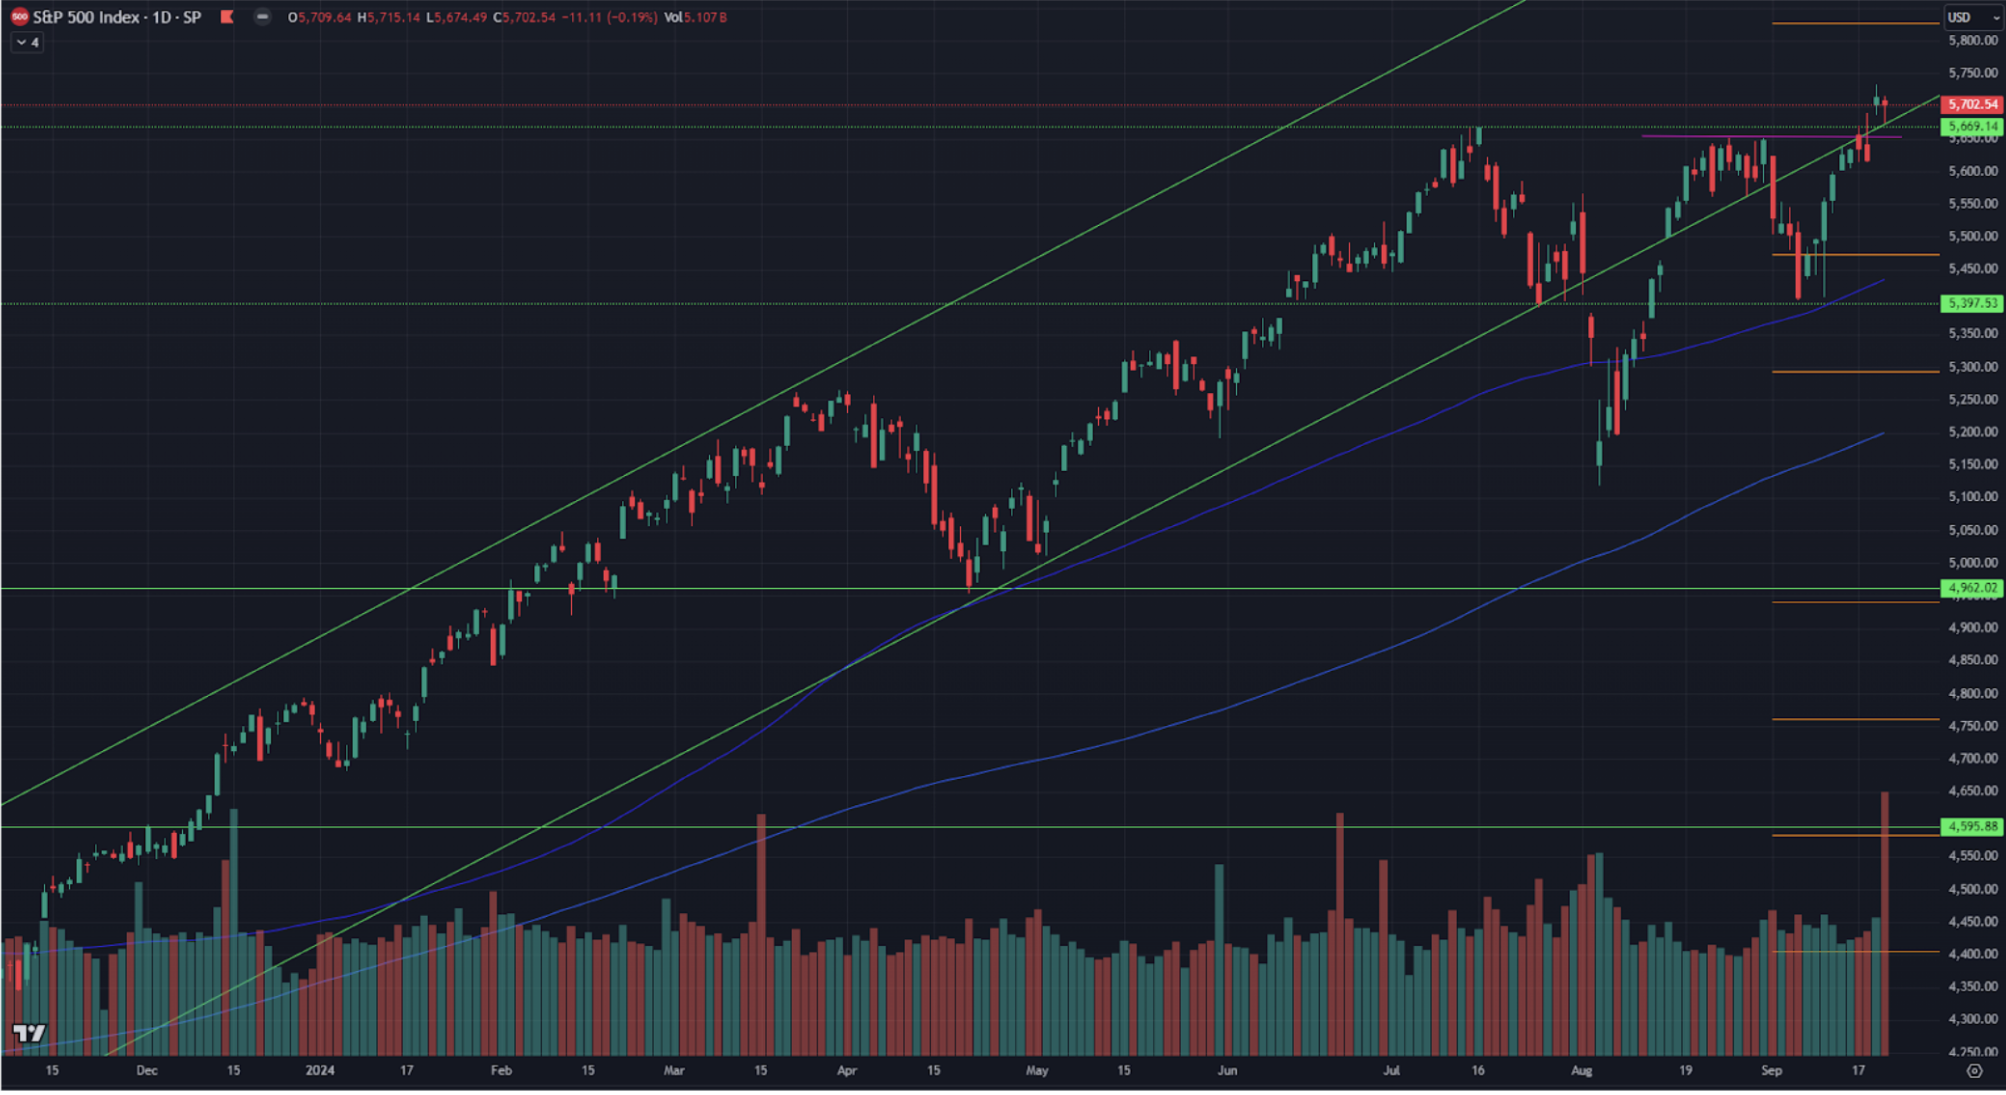
The S&P 500 index rose by 1.55% over the week, reaching an intraday historical high of 5733. On Friday, despite high trading volumes, the index did not see continued growth, indicating some uncertainty in the market.
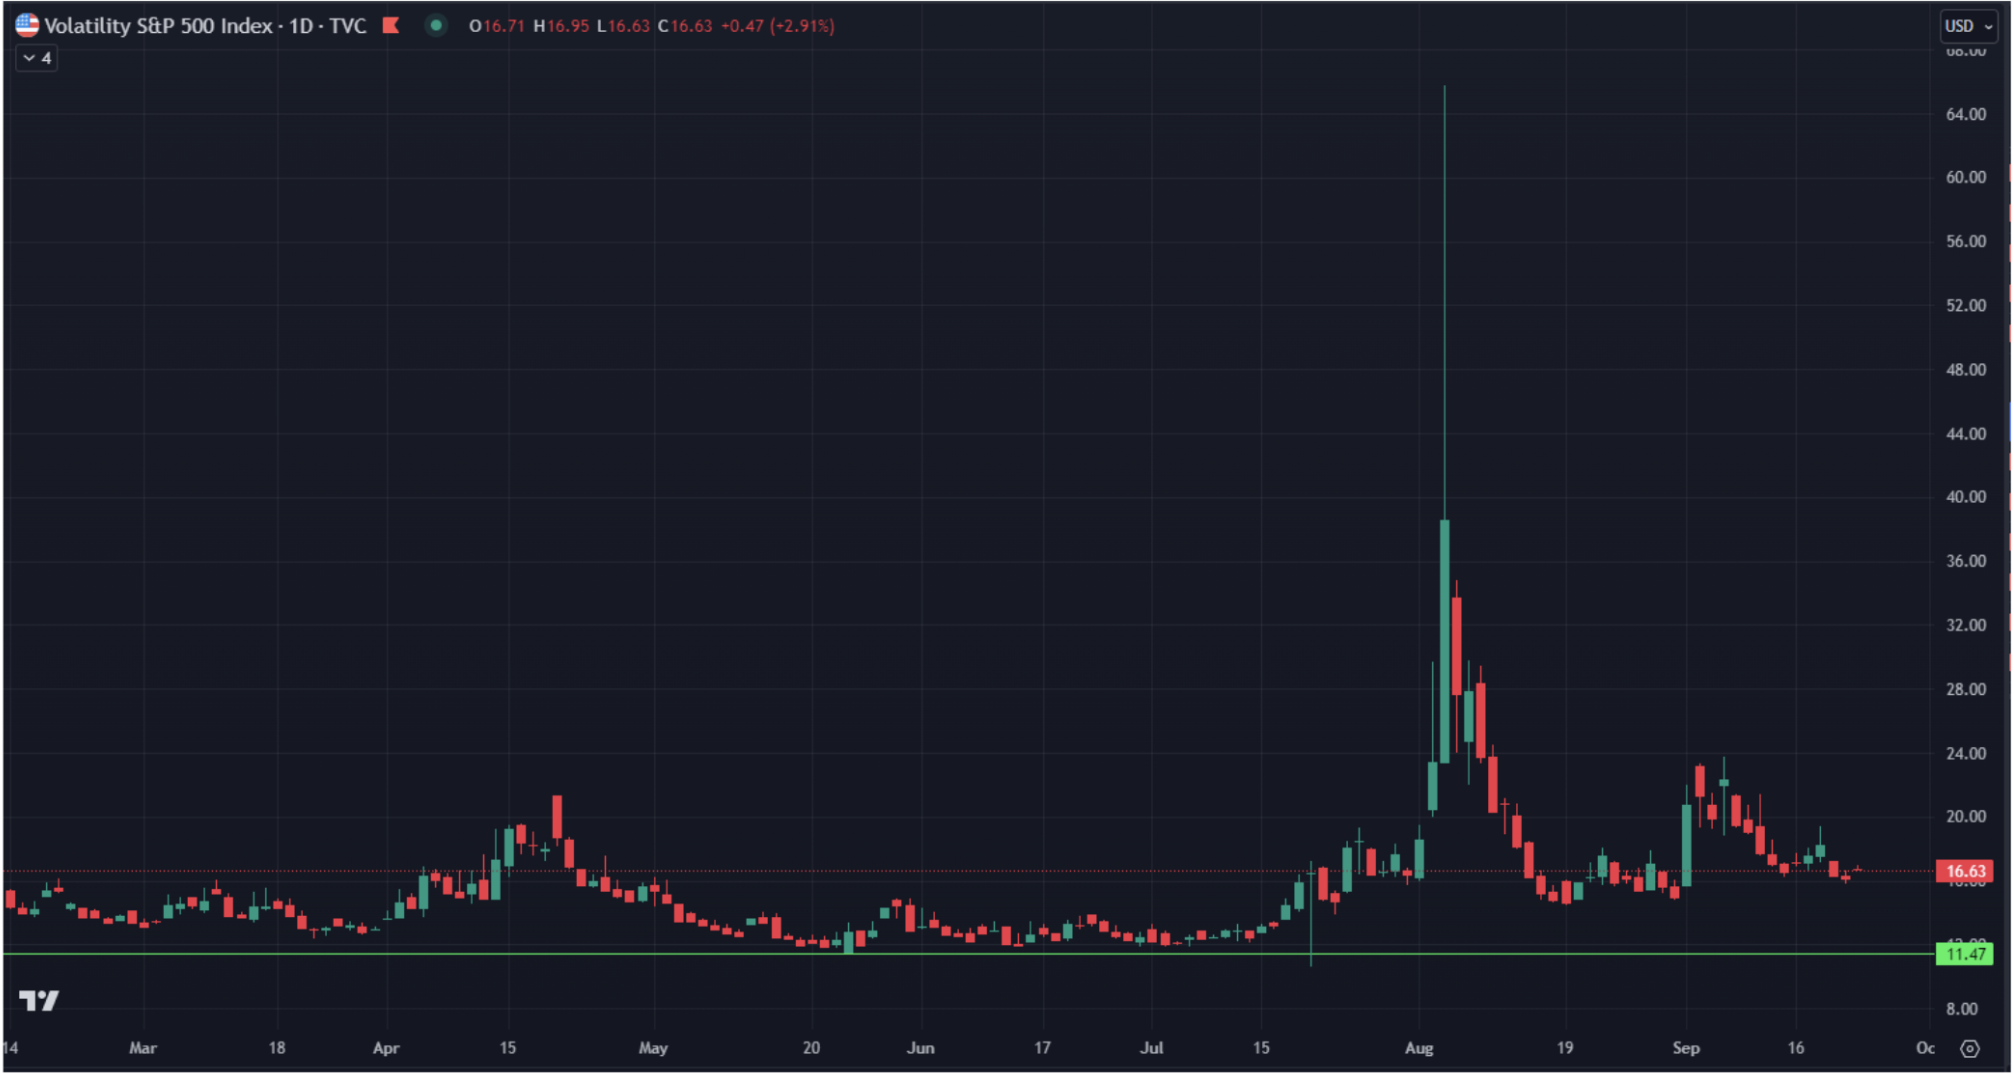
The current value is 5702, with the price range of 5650-70 now serving as a support level. The "Volatility Index" (VIX) remains at 16.91 without significant fluctuations.
The likelihood of a stock market correction in the medium term remains elevated if the Federal Reserve reduced rates due to potential future economic risks.
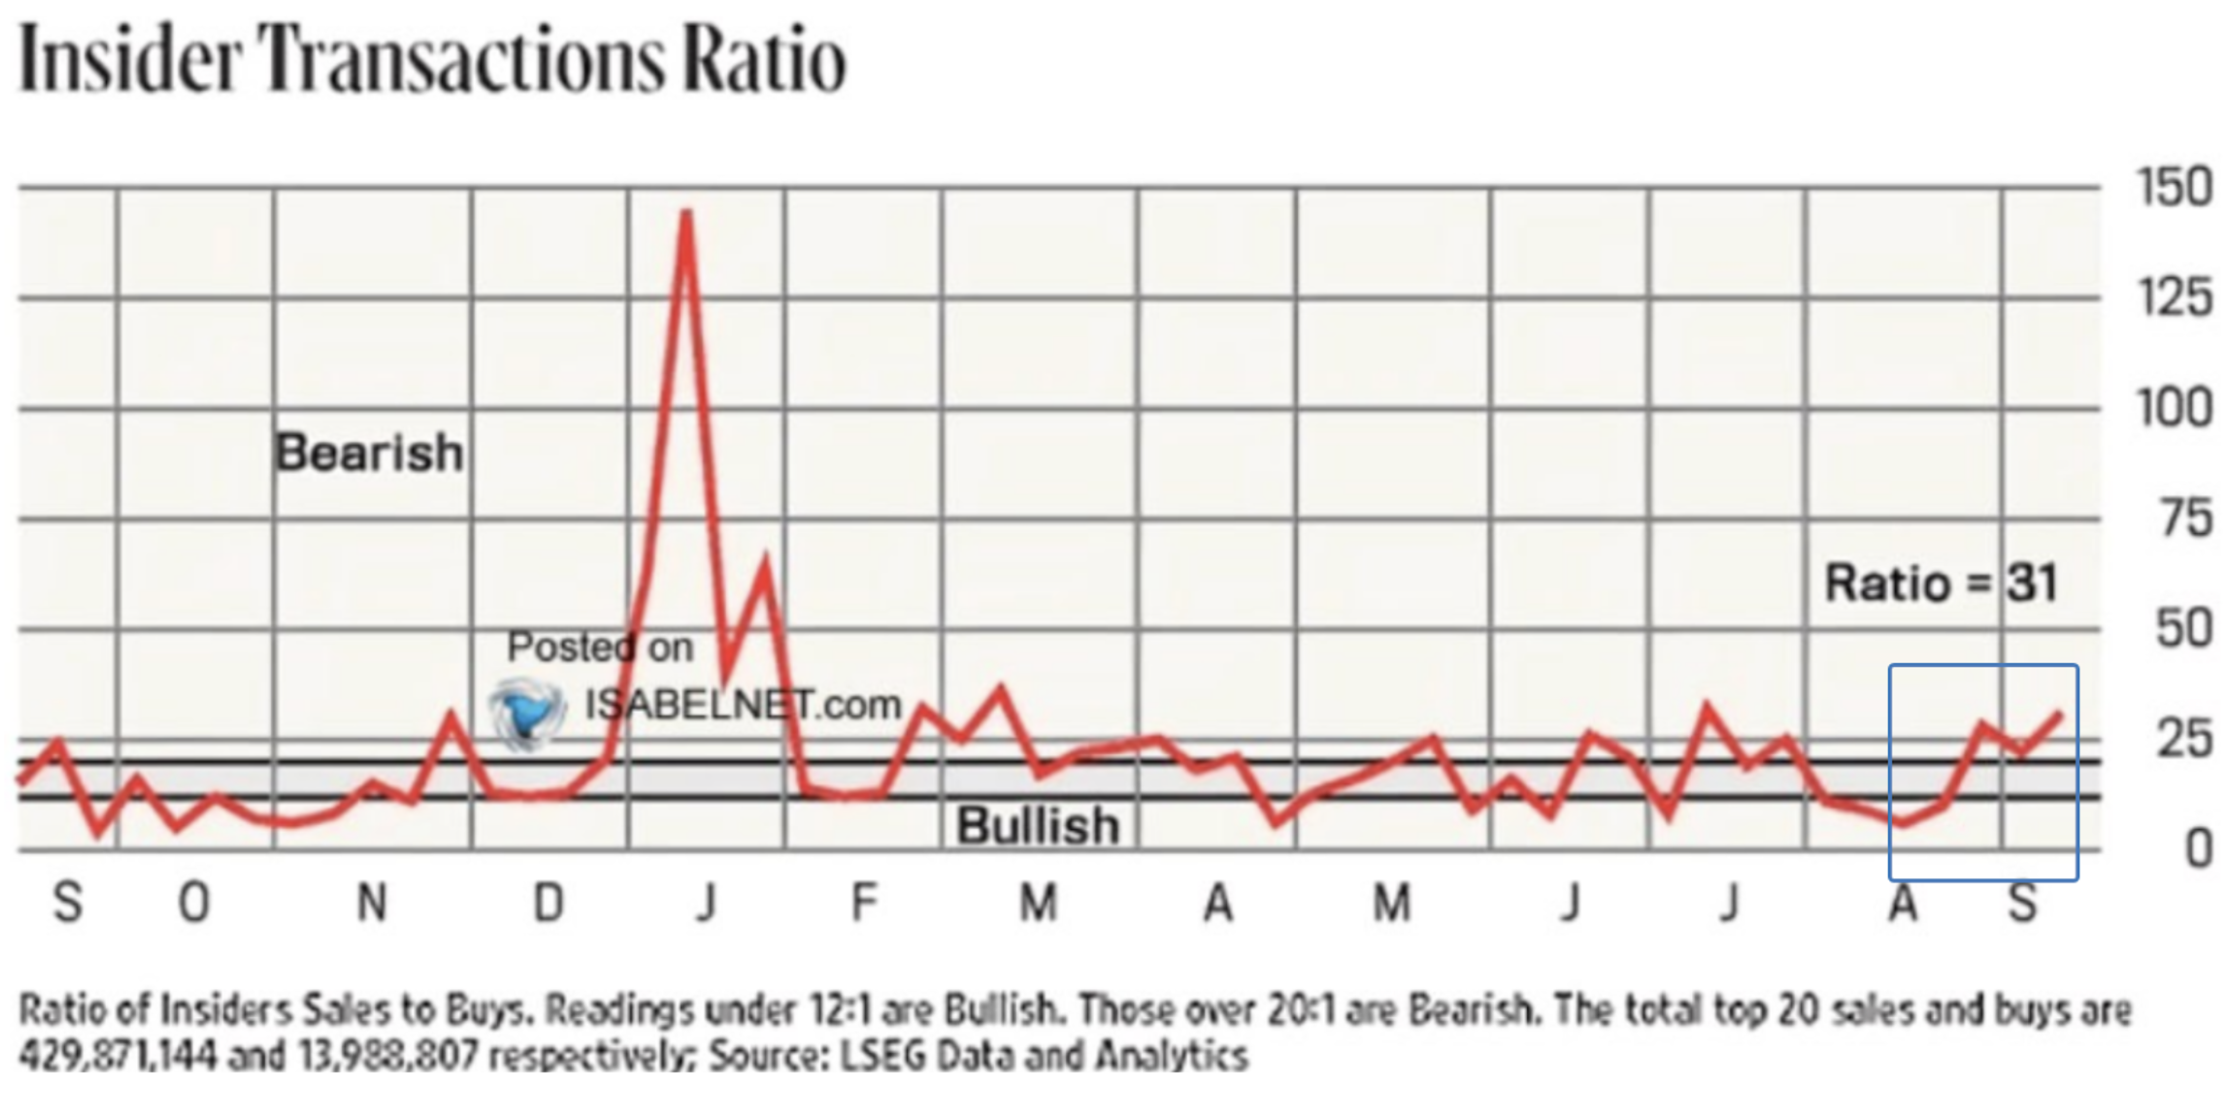
There is an interesting dynamic in insider transactions. We see that insiders have been increasing their sales since August this year, but so far within the upper boundary of the range. After the events of last week, it will be interesting to observe the further dynamics of market participants who are fully informed about their companies' affairs.
TREASURY MARKET
Treasury Bonds UST10:
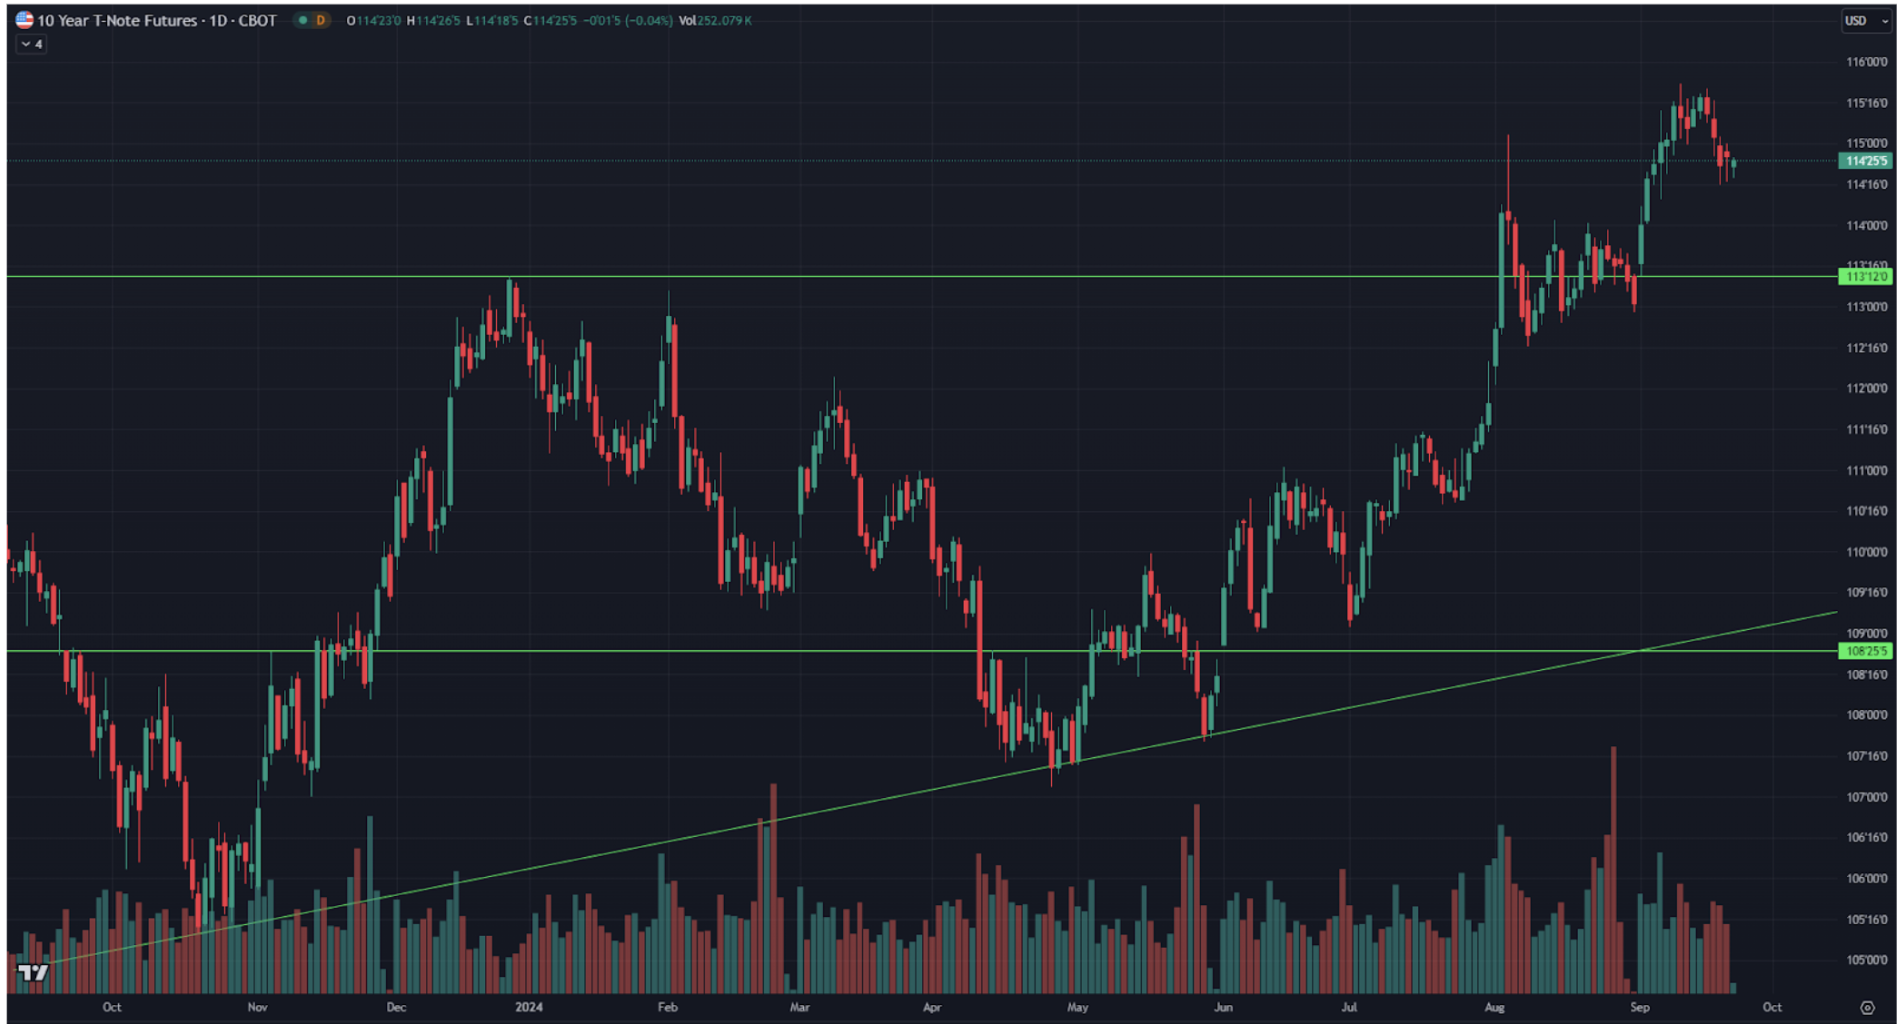
The yield on 10-year treasuries fell by 0.52% following the Federal Reserve meeting and the week’s results. The old "buy on expectations, sell on news" effect was at play, as there was good growth following the July meeting, where a verbal shift in monetary policy direction occurred. Further rate cuts may boost the treasury bond market.
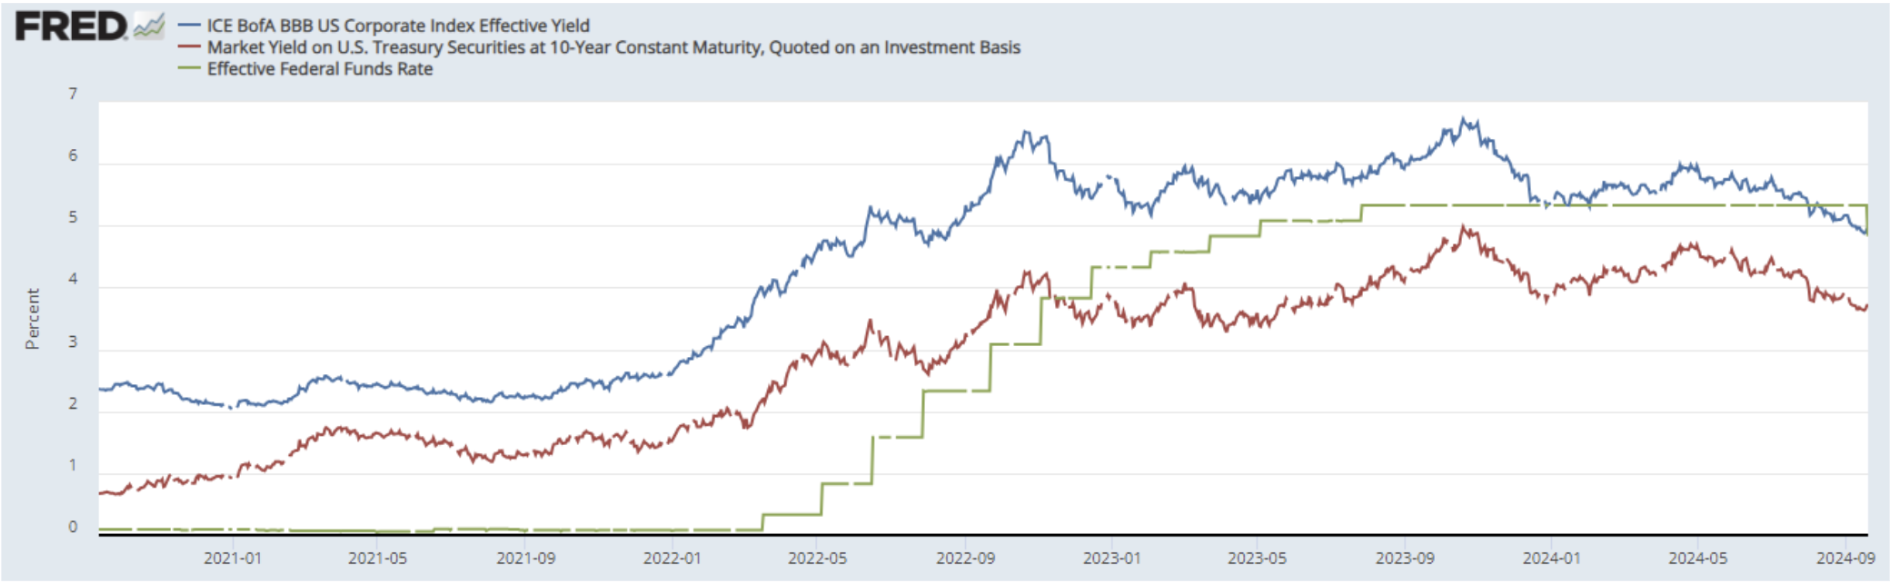
The market yield on U.S. Treasury securities with a 10-year constant maturity (red line) stands at 3.73%. The yield on the BBB-rated corporate bond index (blue line) is 4.90%. Compared to last week, the spread between them has narrowed by 0.12% to 1.17%. A narrowing spread indicates reduced risks in the corporate debt market.
DXY
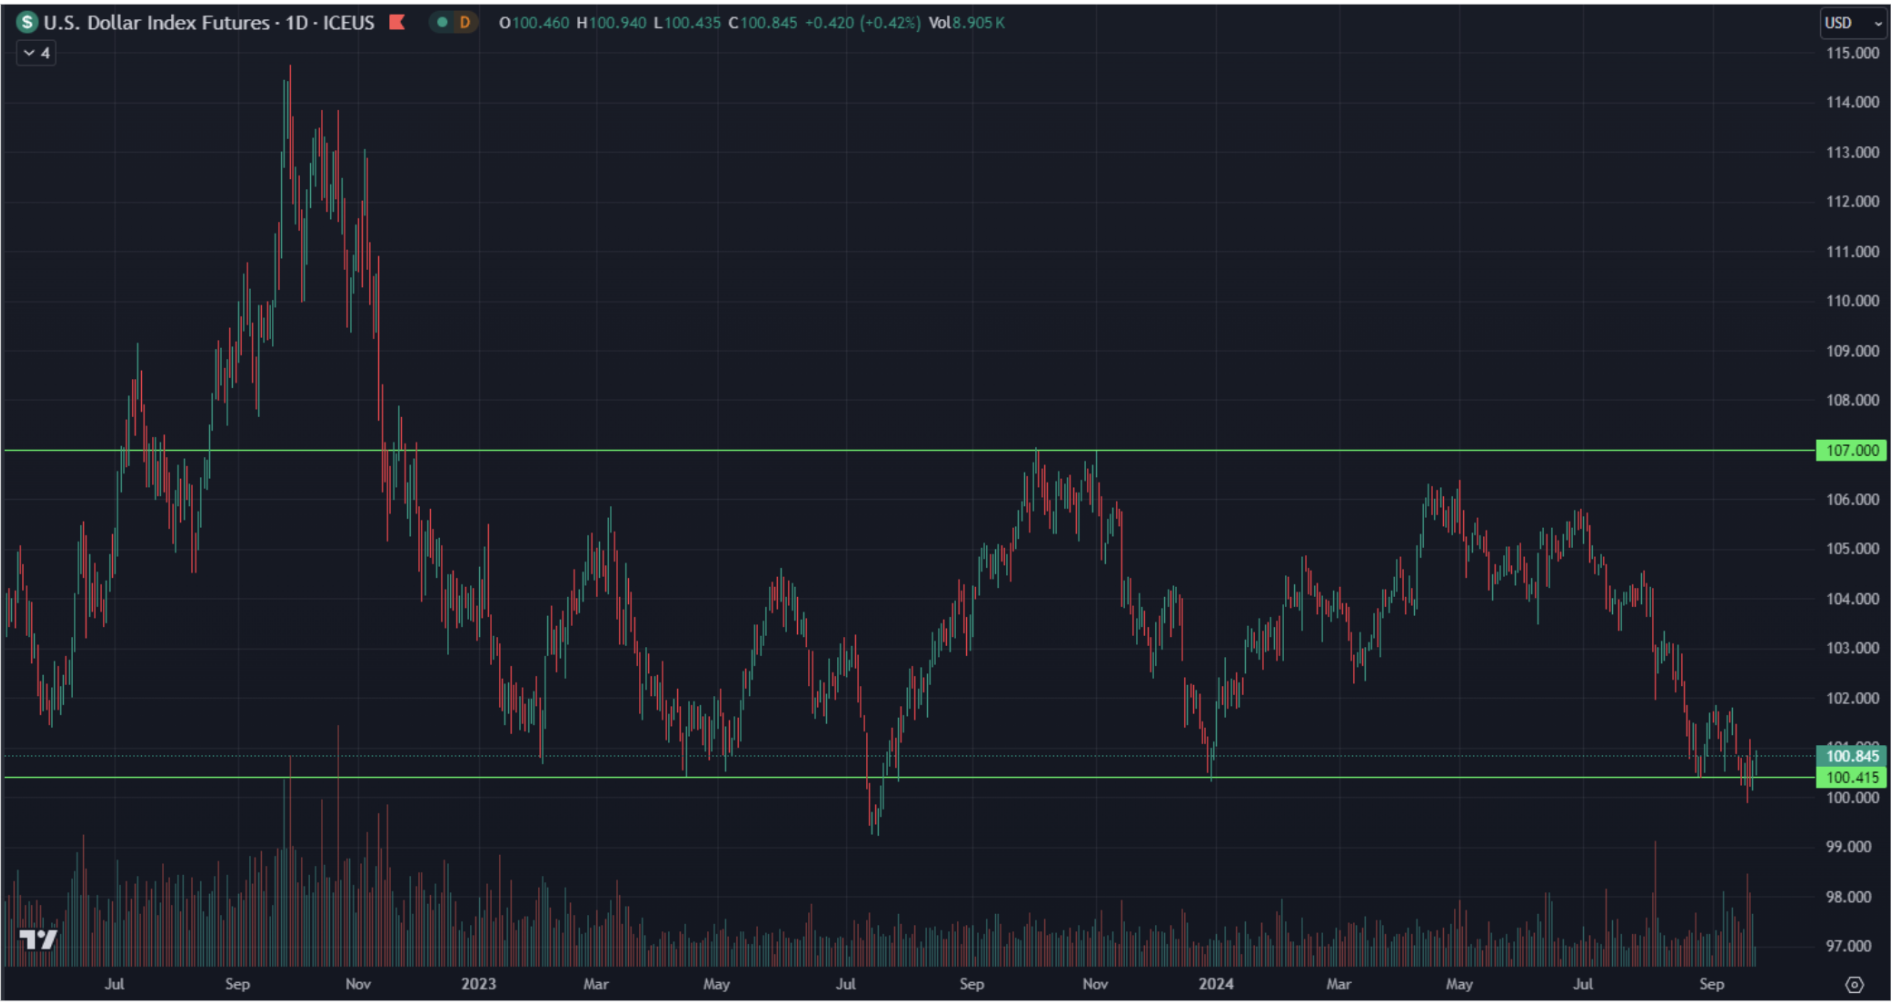
The dollar index (DXY) is consolidating just above the lower boundary of its three-year horizontal channel. Given the new Federal Reserve rate forecasts, the dollar will remain under pressure.
GOLD
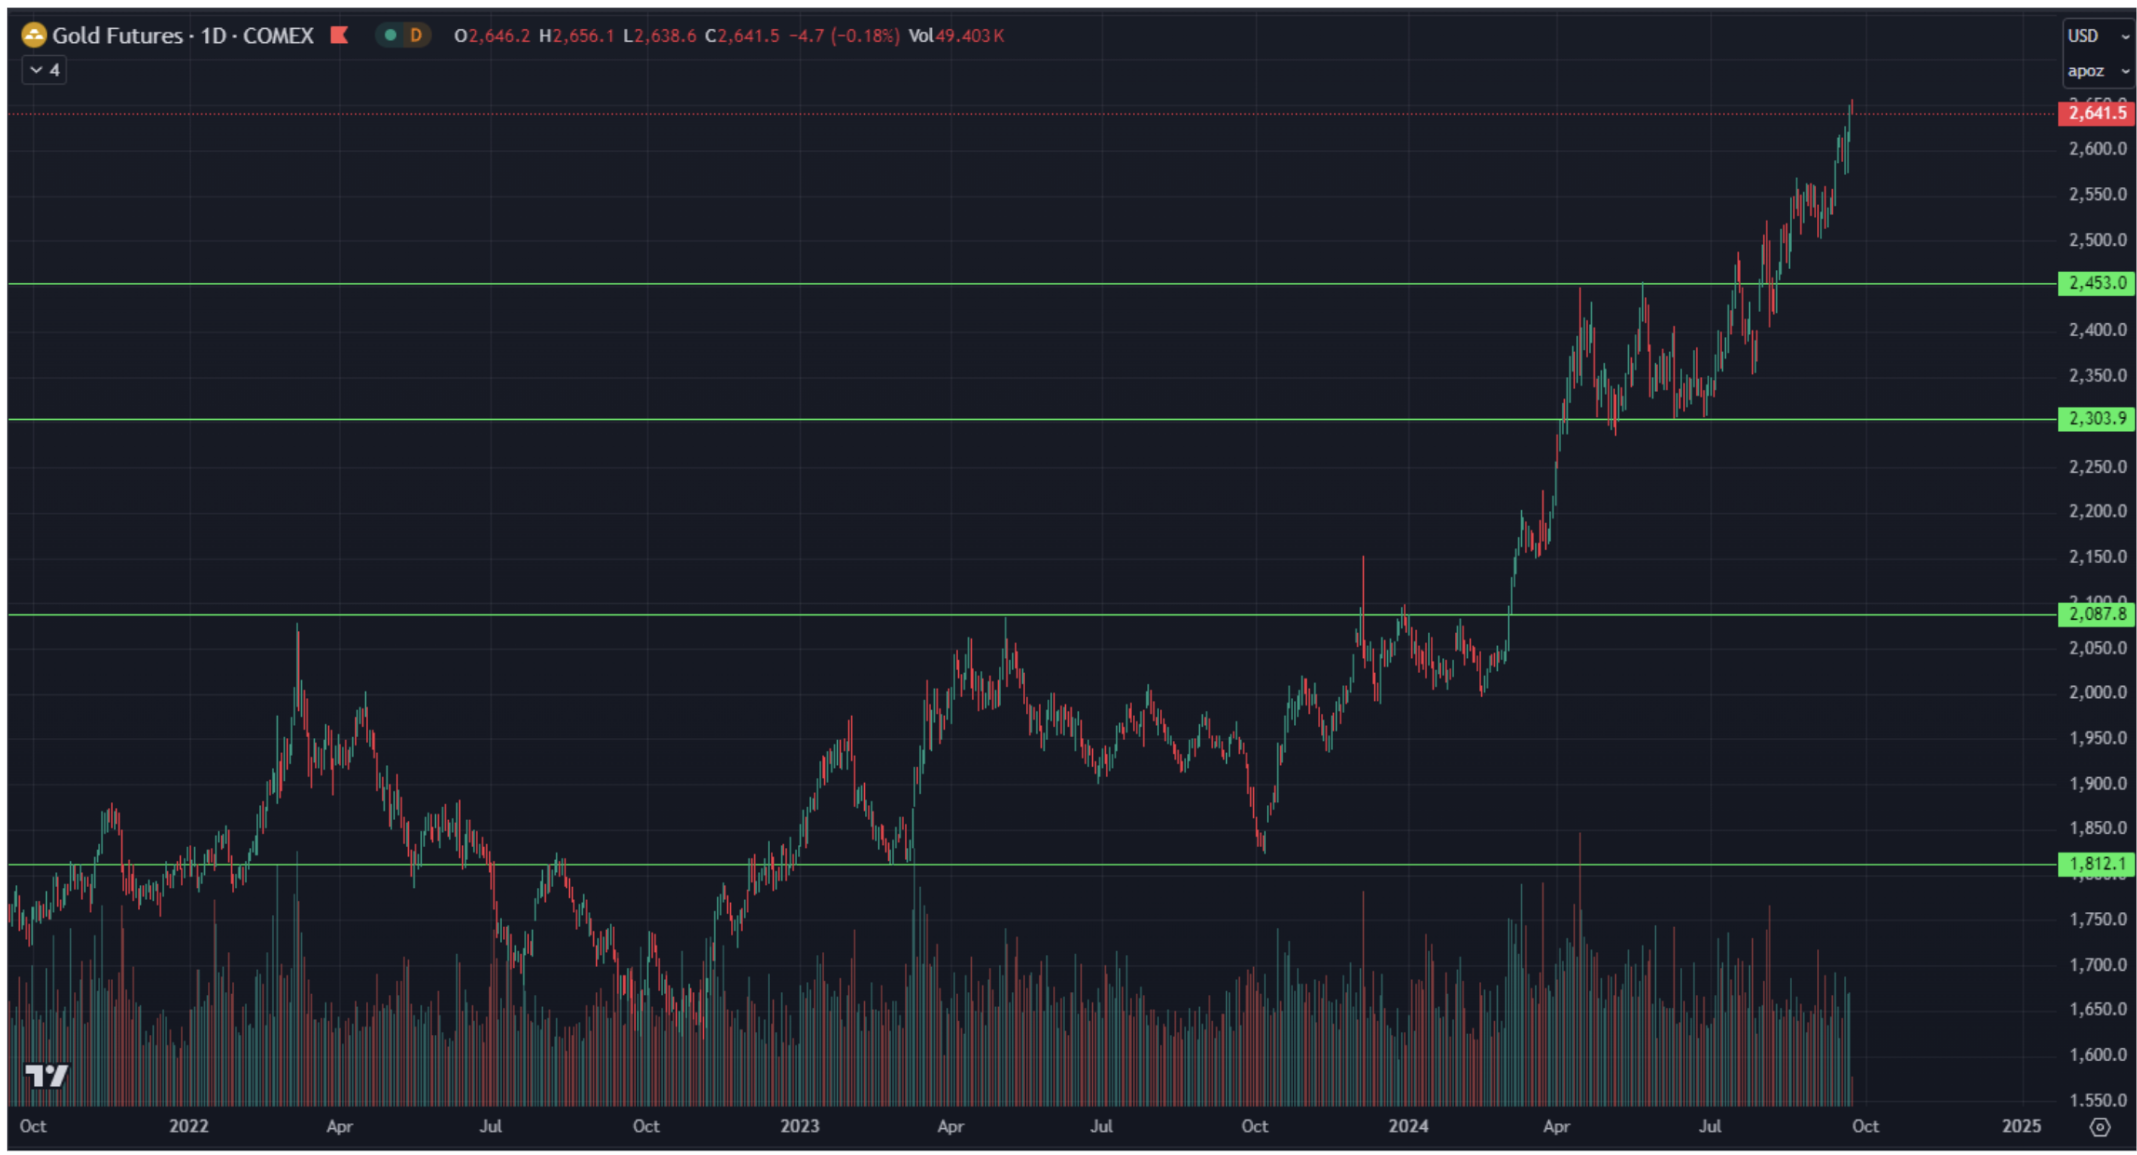
Gold has hit a new high today at $2656 per troy ounce. The increase since October 2023 is 45%. The forecasted median is $2900-3000 per troy ounce.
BTC
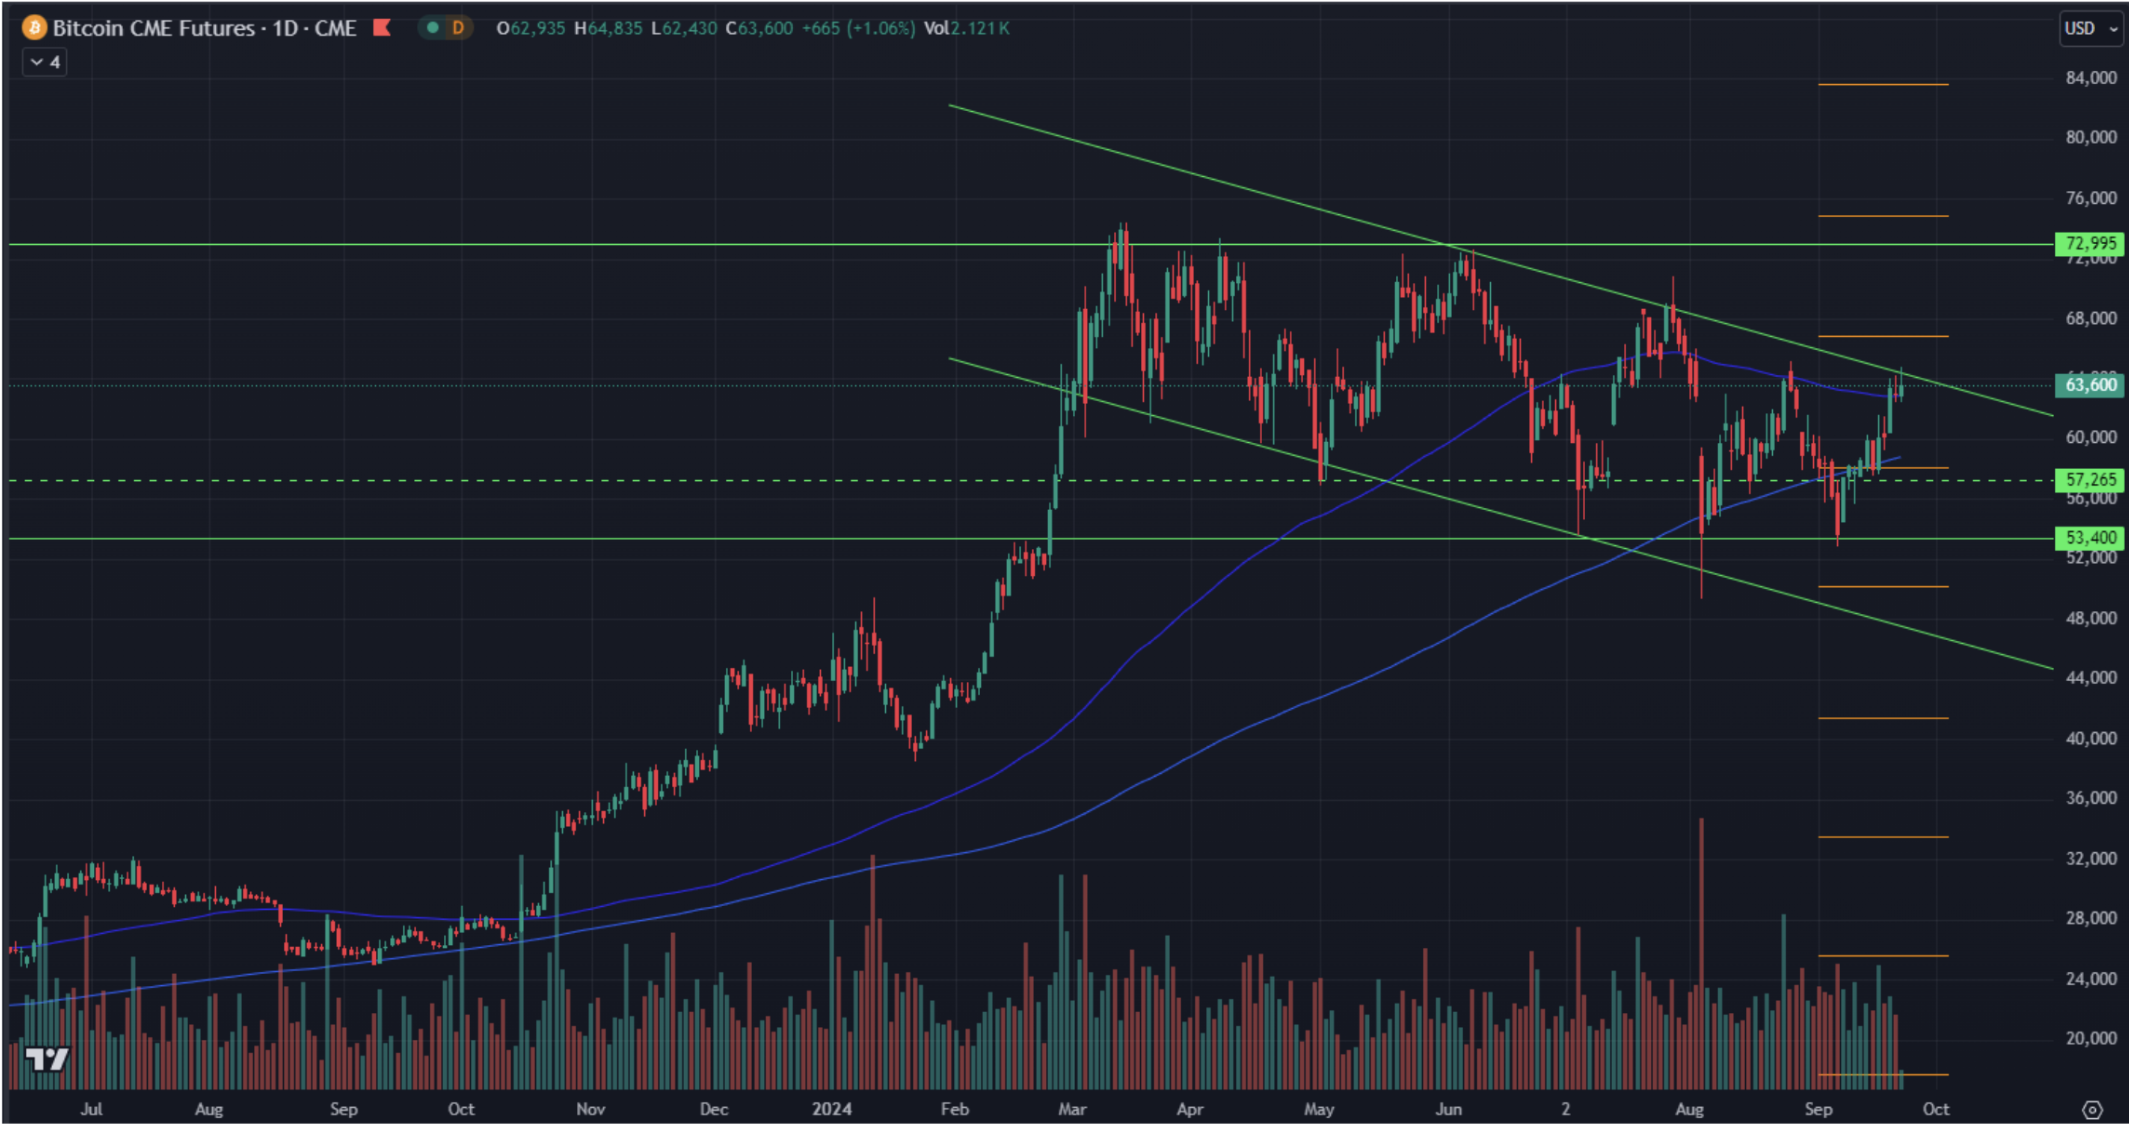
Bitcoin rose by 6% following the meeting. Historically, BTC's performance has correlated with dollar liquidity in most periods, and in this context, further growth of the cryptocurrency can be expected.
Interested in buying private tech companies' shares with us? Check out our Wealth and Growth account plans, which provide you access to exclusive venture capital deals!
Disclaimer: “The use of the trademark is for informational purposes only and does not imply endorsement or affiliation. Additionally, the information in this communication is for informational purposes only and is neither an offer to purchase, nor a solicitation of an offer to sell, subscribe for or buy any securities".