 Lietuvių
 Русский
 Қазақша
 Eesti
EestiSeptember 2 — 6: Weekly economic update
Key market insights

In our weekly column, we share with you the main macroeconomic indicators for the market.
MACROECONOMIC STATISTICS
INFLATION
- Core Consumer Price Index (CPI) (YoY) (June): 3.2%, (pre: 3.3%);
- Consumer Price Index (CPI) (YoY) (June): 2.9%, (pre: 3.0%);
THE FED'S INFLATION TARGET
- Core price index of personal consumption expenditure PCE (YoY) (July): 2.6% (pre: 2.6%);
- The price index of personal consumption expenditures (YoY) (July): 2.5%, (pre: 2.5%)
INFLATION EXPECTATIONS
- 12-month expected inflation (August): 2.8%, (pre: 2.9%);
- 5-year expected inflation (August): 3.0% (pre: 3.0%).
GDP (q/q) (2Q.) (second estimate): 3.0% (first: 2.8%, pre: 1.4%), GDP deflator (q/q) (2 Q.): 2.5% (pre: 3.1%).
BUSINESS ACTIVITY INDEX (PMI)
- Services sector (June): 55.7 (pre: 55.0);
- Manufacturing sector (August): 47.9 (pre: 49.6, review).
- S&P Global Composite (June): 54.6 (pre: 54.3, review).
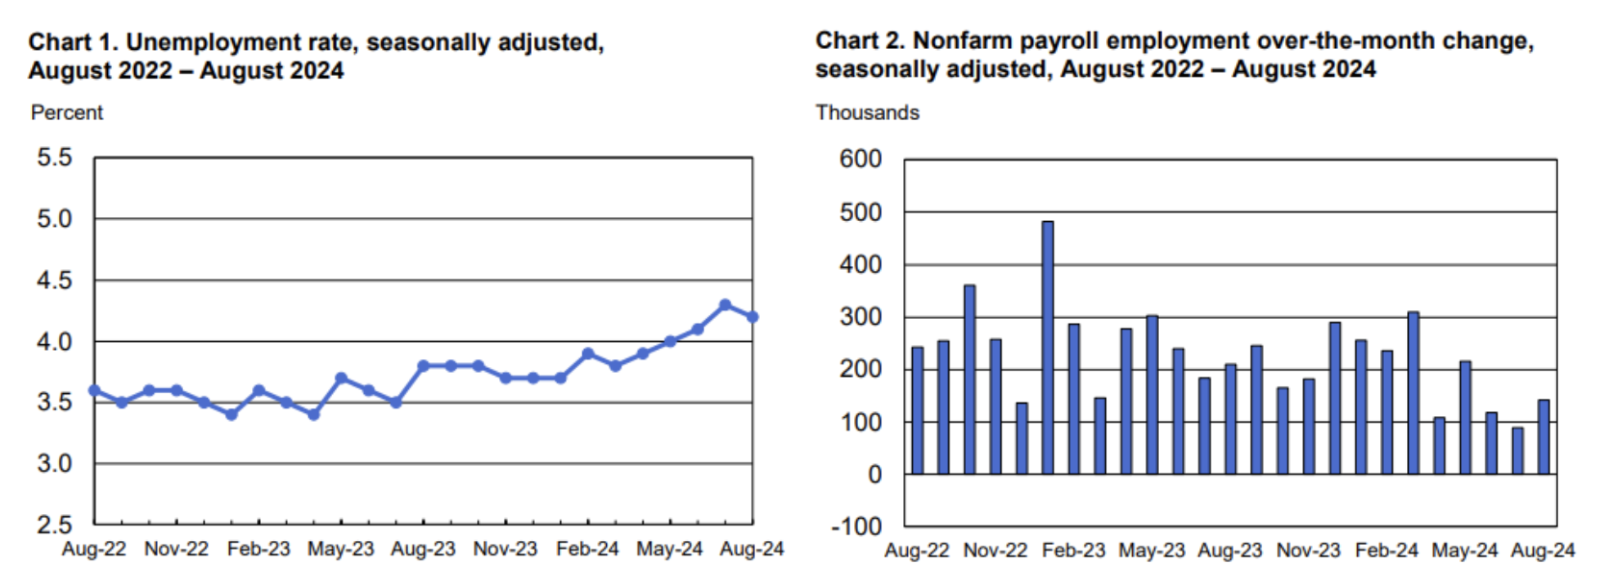
LABOR MARKET
- Unemployment rate (August): 4.2% (pre: 4.3%);
- Non-farm Payrolls (August): 142K (pre: 89K, review);
- Change in non-farm private sector employment (August): 118K, (pre: 74K, review);
- Average hourly earnings (August, YoY): 3.8%, (pre: 3.3%);
- Number of initial applications for unemployment benefits: 227K, (pre: 232K)
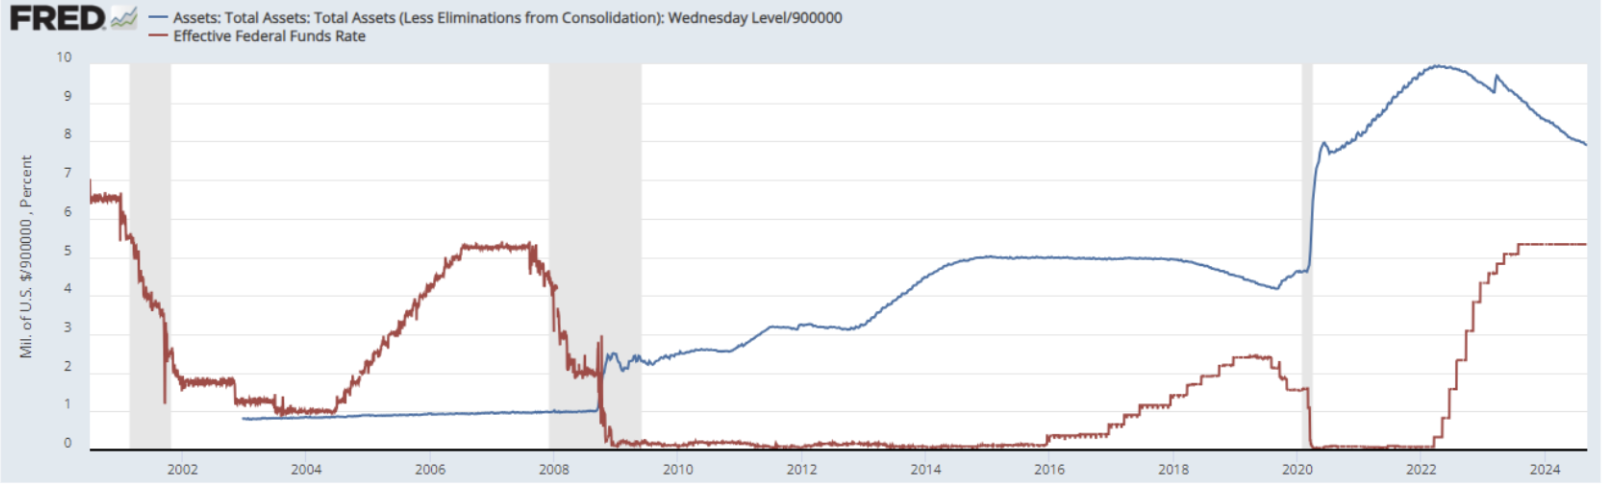
MONETARY POLICY
- Federal Funds Rate (EFFR) — 5.25-5.50% (in red line);
- Fed balance sheet (blue) declined from the previous week: $7.112 trillion (prev: $7.12 trillion).
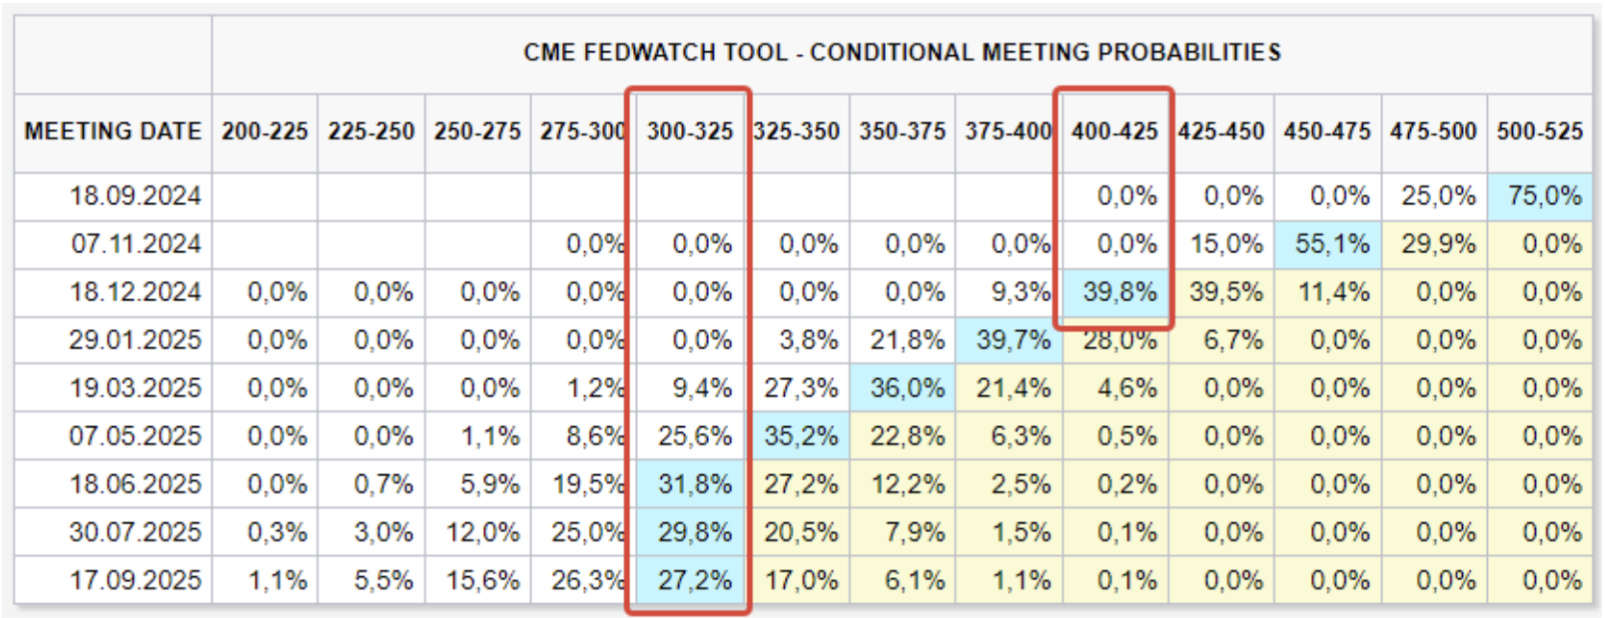
MARKET FORECAST RATE (FEDWATCH)
Today:
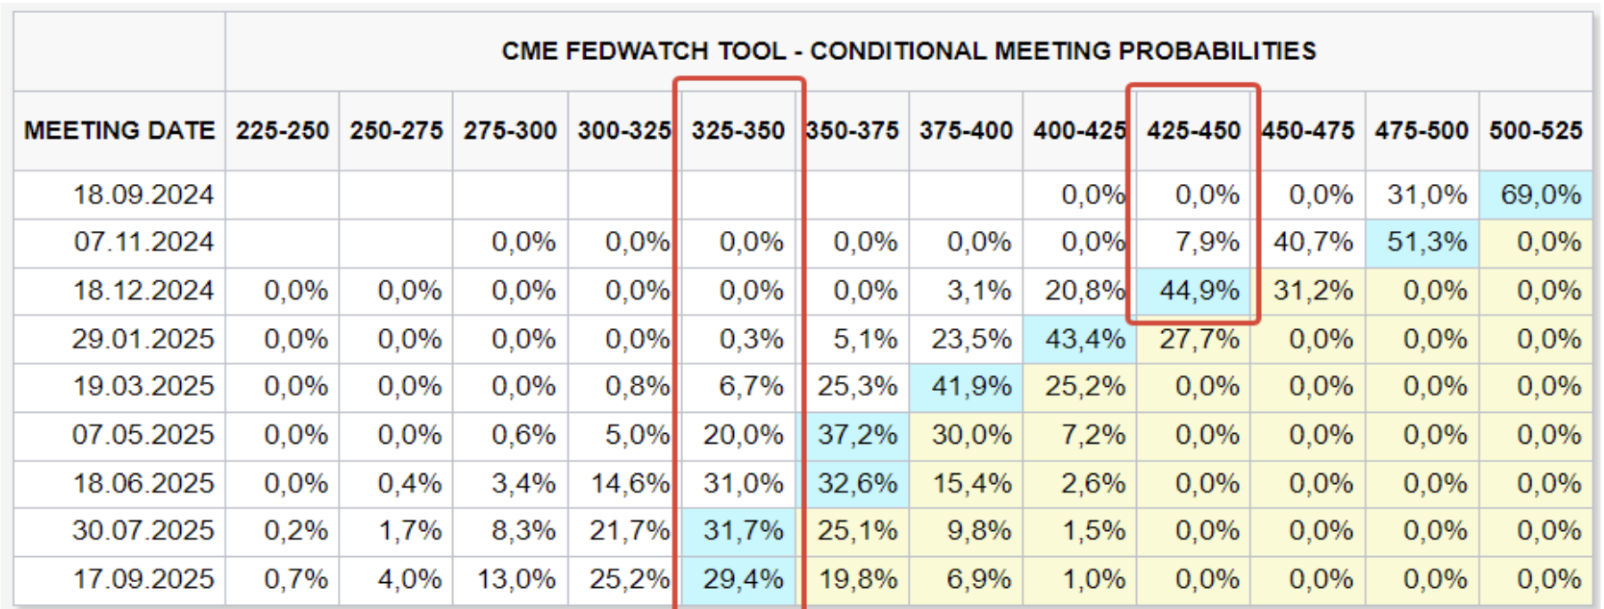
A week ago:
COMMENTARY
Commentary
-
According to the U.S. Bureau of Labor Statistics, the numbers have improved slightly, but the market has reacted negatively.
-
The unemployment rate fell by 0.1% to 4.2%, with the total unemployed at 7.1 million people.
-
Total nonfarm employment increased by 142,000 in August, with a forecast of +164K.
-
Job growth was seen in construction and healthcare.
-
Private nonfarm employment (a more critical indicator) increased by 118K, with a forecast of 139K.
-
Both figures fell short of expectations but improved from July's values, which were heavily revised.
-
Monthly wage growth rose by 0.4%, compared to a previous decline of -0.1%. Wage growth is a crucial indicator for the Fed regarding inflation expectations and decisions on rates at the September meeting. The Fed's balance sheet continues to decrease. The focus remains on the FOMC meeting on September 18. FedWatch guidelines:
-
A 1.25% rate cut by the end of 2024 (range: 4.00-4.25%)—two 0.50% cuts, indicating that the market believes the Fed is behind on rate cuts concerning economic slowdown.
-
Over the next 12 months, a reduction of 2.00% (range: 3.25-3.50%).
MARKET
MARKET CAP PERFORMANCE
The stock market:
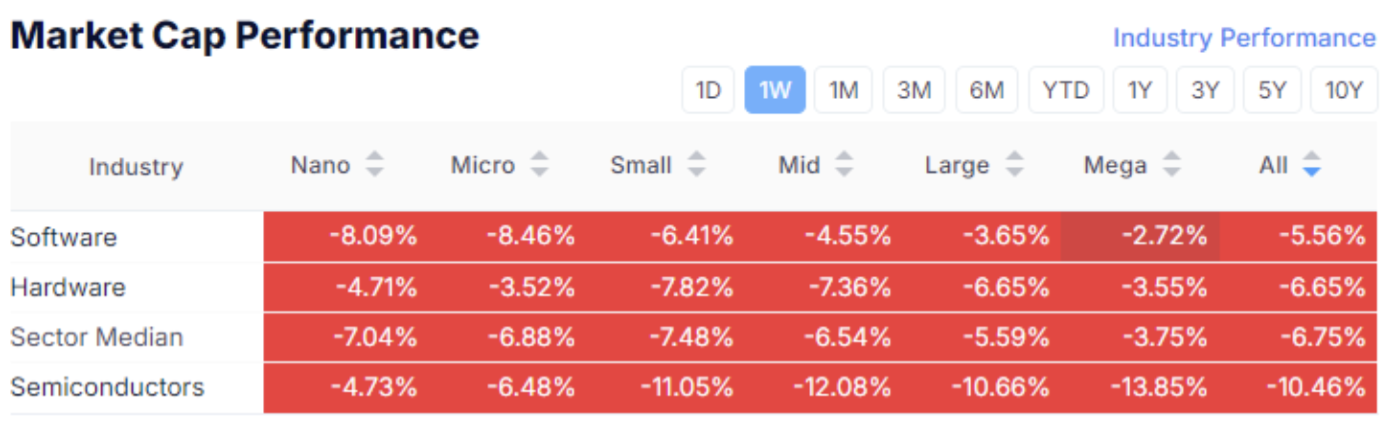
Technology sector:
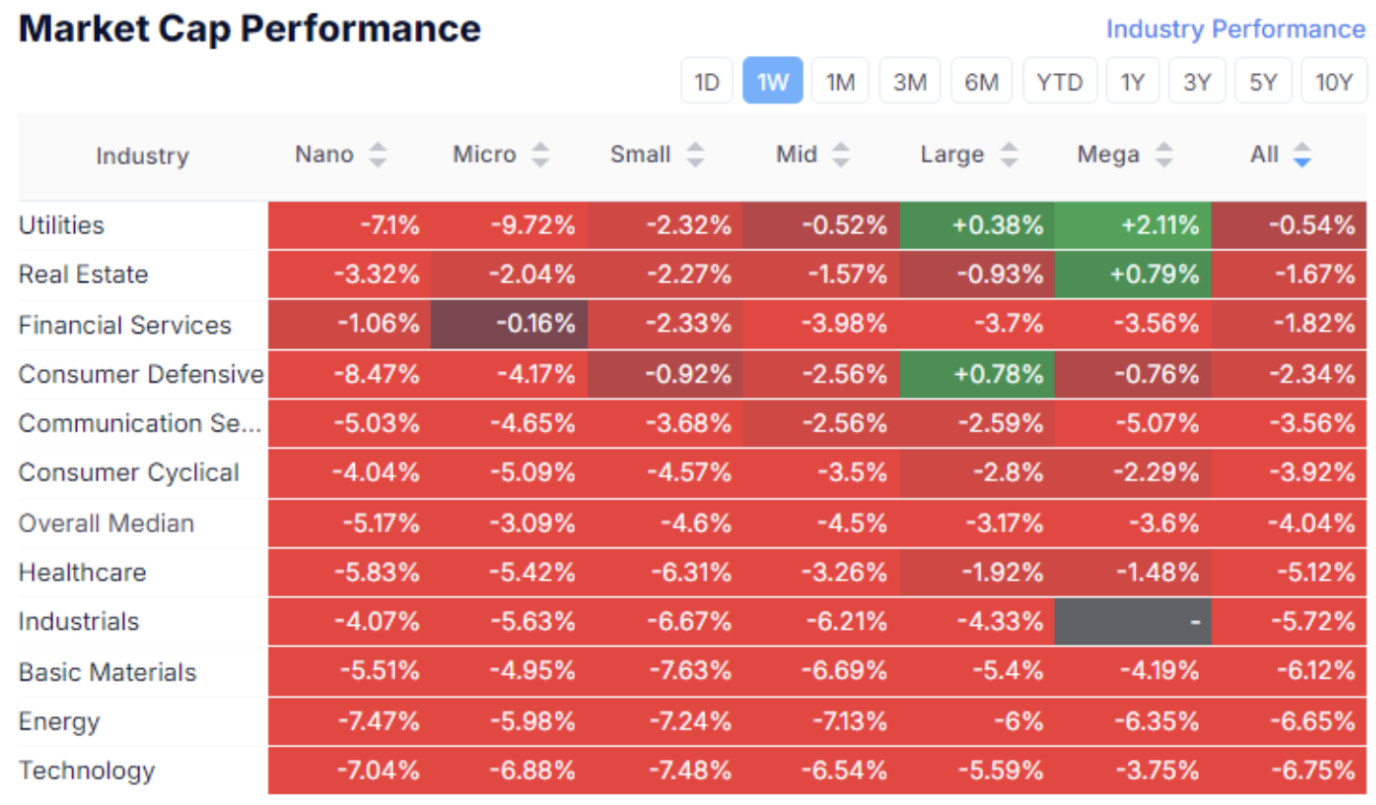
Last week, the market was predominantly in the red zone. The market capitalization of the U.S. stock market fell by $2.2 trillion.
The median decline was 4.04%. The laggards were the technology, energy, and basic materials sectors. There was demand for large-cap companies in the defensive utilities sector. The market showed a risk-off sentiment.
The technology sector sold off across all capitalizations and subsectors. The semiconductor subsector dropped by 10.46%, which makes sense given its previous overbought state—the AI hype is cooling off.
SP500
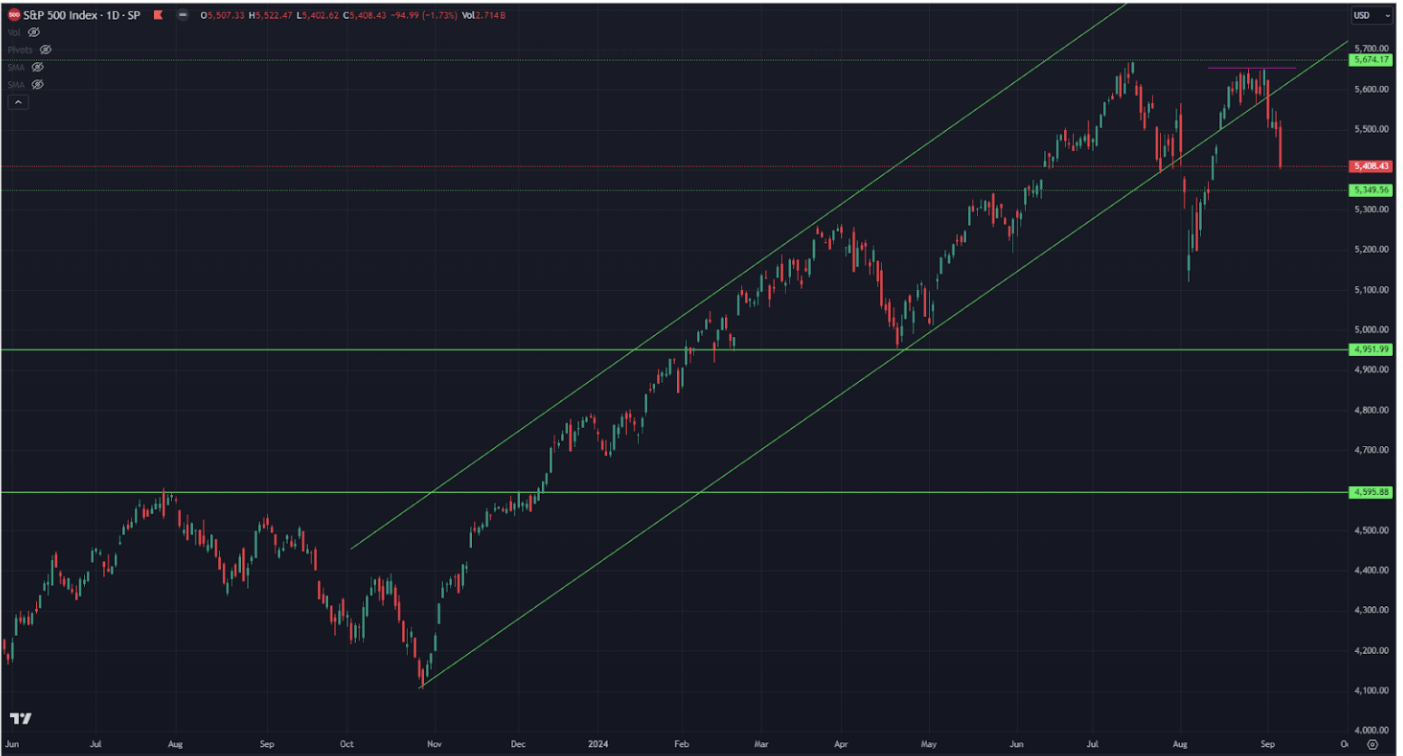
The index fell by 3.82% over the week. The likelihood of reaching a new high in the medium term is significantly reduced from both a technical analysis perspective—a potential double top pattern—and from fundamental factors.
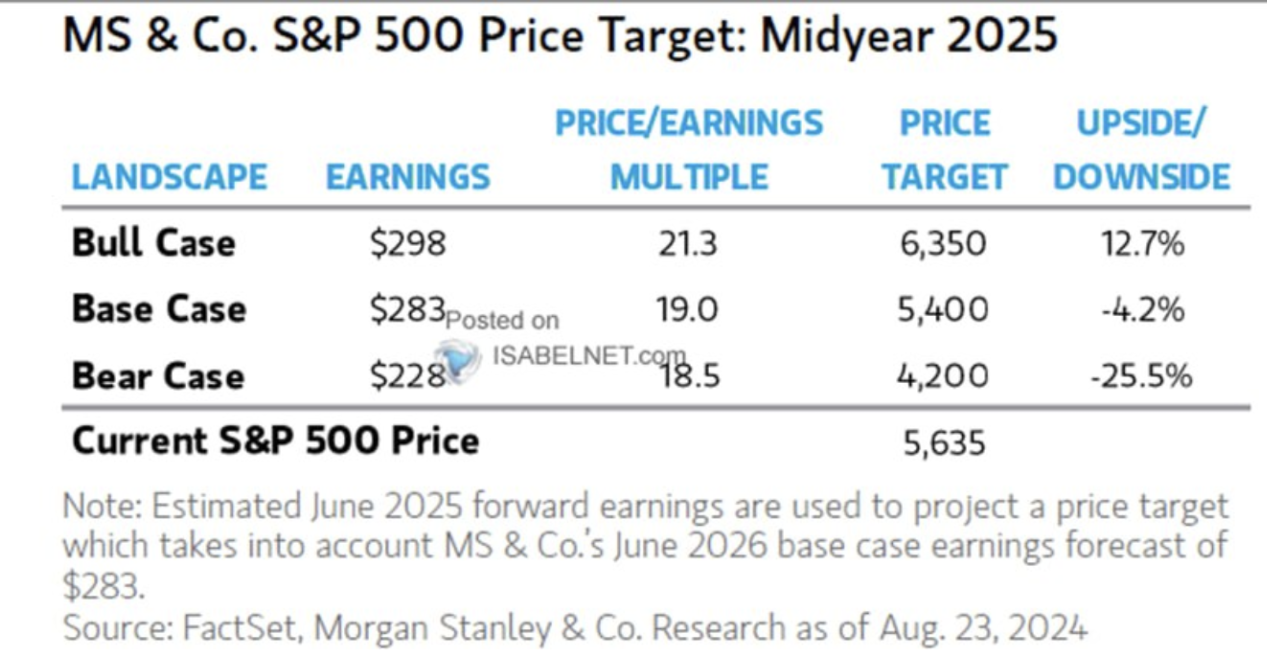
The updated median forecast from Morgan Stanley for the S&P 500 shows a 4.2% decline by mid-next year. The bearish forecast is almost twice as large as the bullish one, 25.5% to 12.7%.
NVDA
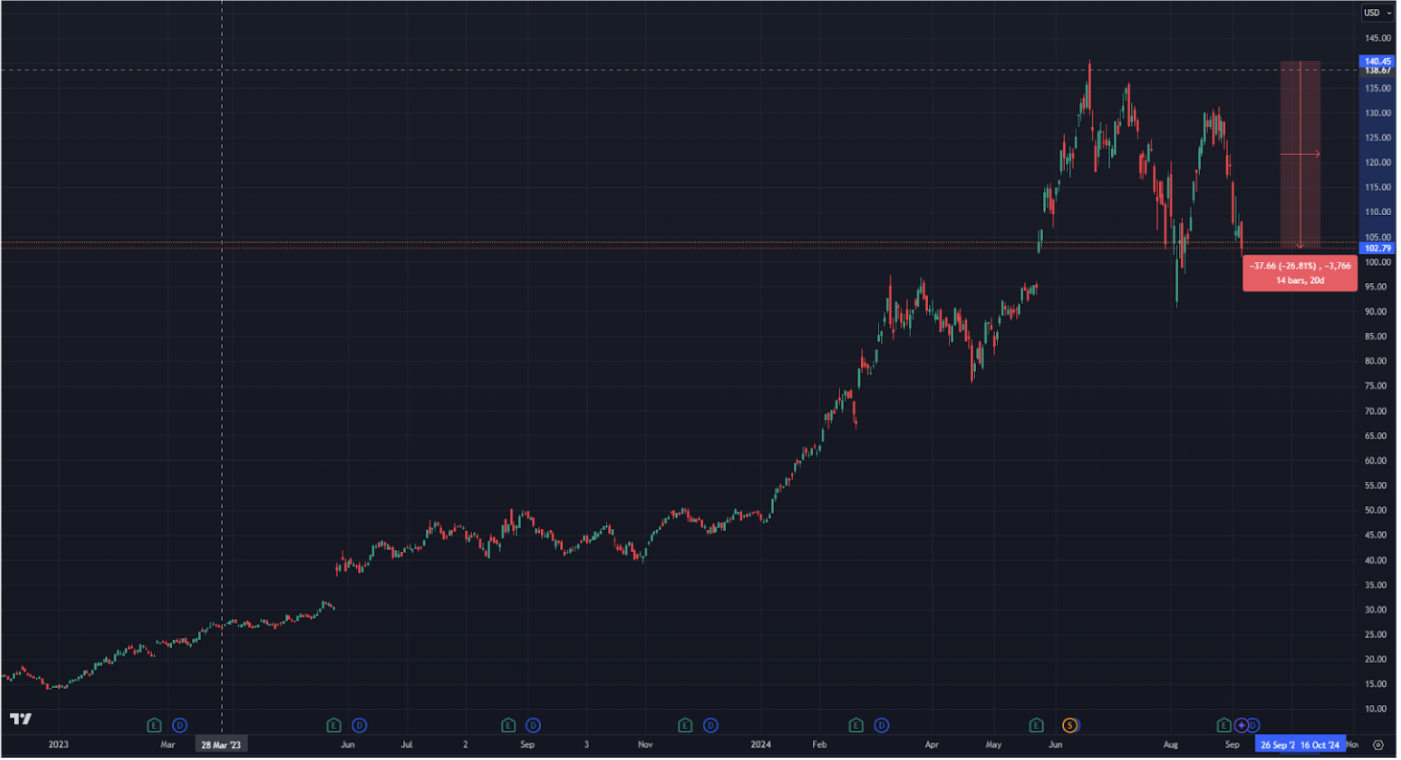
Market leader NVIDIA fell 27% from its highs due to restrained forecasts in its recent report and some negative factors—a lawsuit against Nvidia as part of an antitrust investigation.
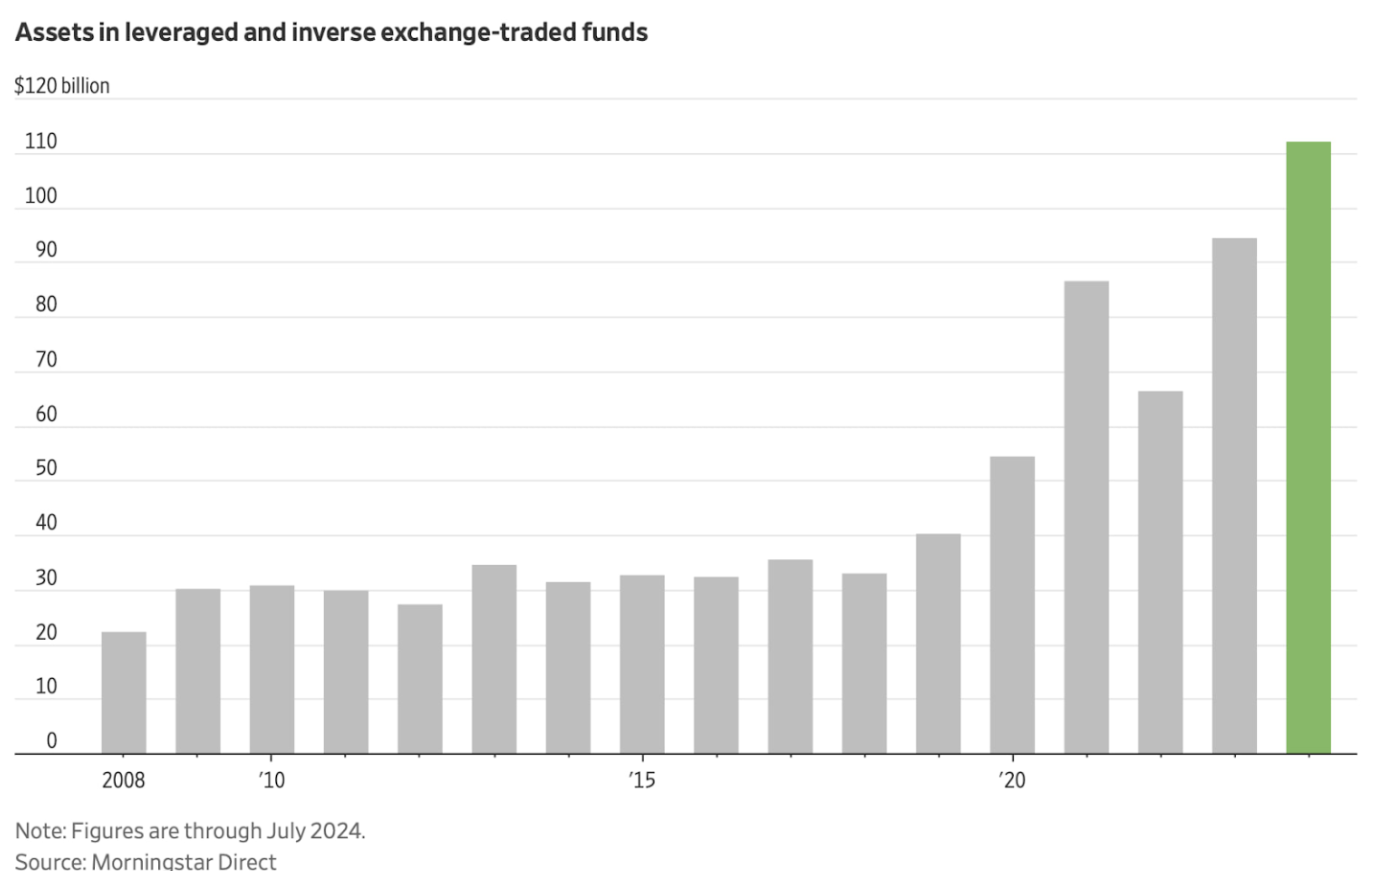
The inflow chart for leveraged and inverted ETFs shows an increase. According to Morningstar, inflows into these funds in 2024 are at their highest since 2008.
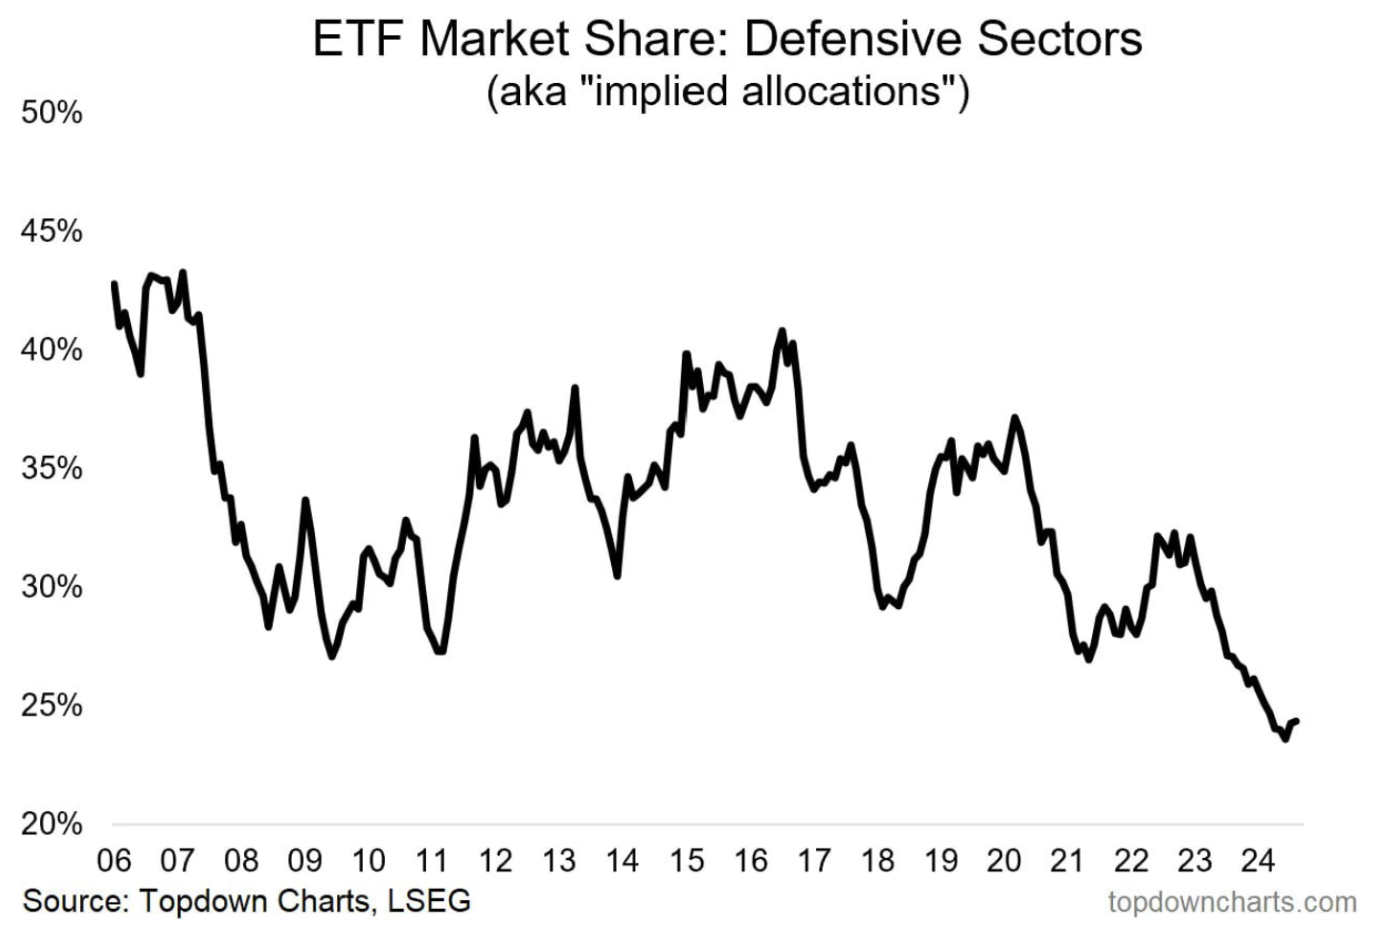
According to the London Stock Exchange Group (LSEG), the market share of defensive sectors is now at historically low levels—around 25%. This is due to high risk appetite in 2023-2024, with capital flowing from all sectors into large-cap tech companies.
TREASURY MARKET
Treasury Bonds UST10:
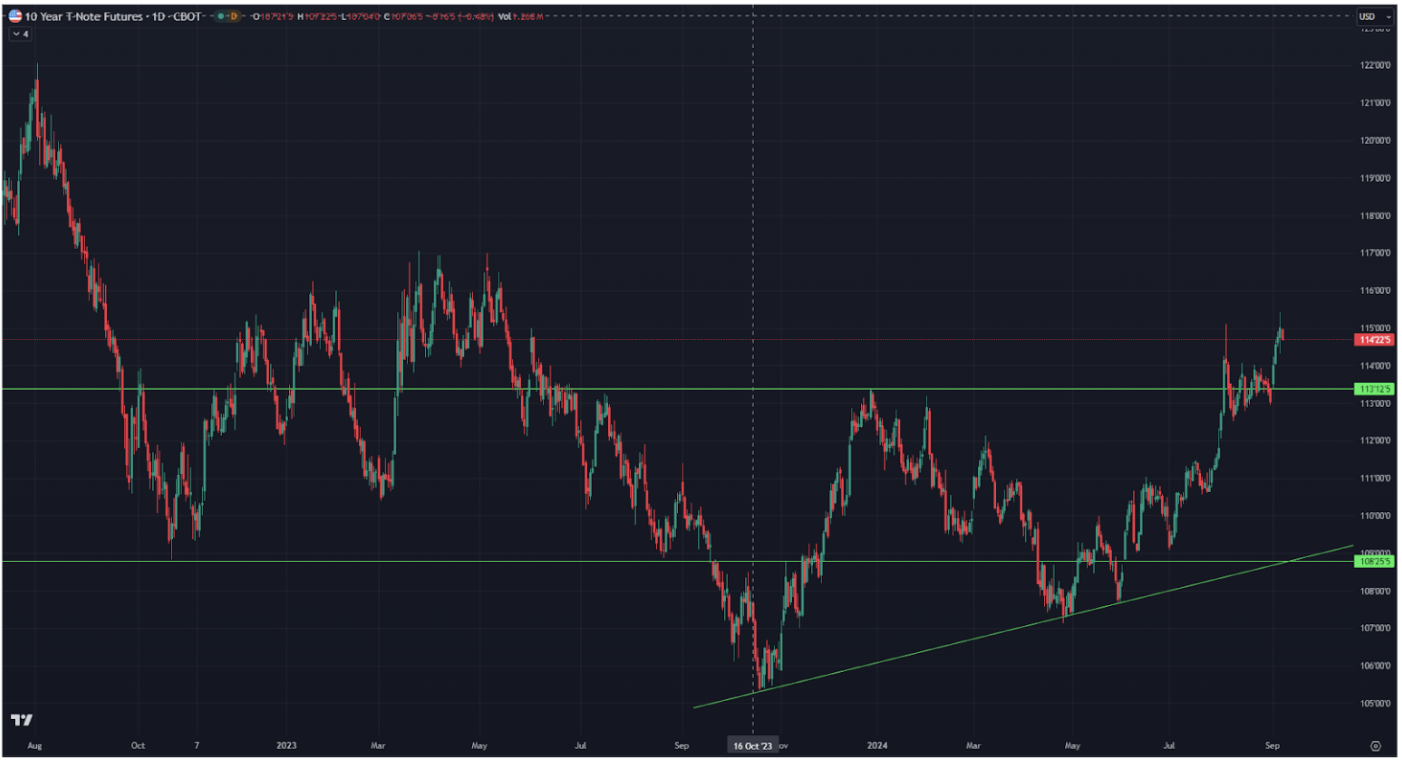
The benchmark 10-year treasuries rose 1.2% over the week, driven by rate-cutting expectations and increased demand for treasury debt amid declining stock market risk appetite.
YIELDS
The market yield of U.S. Treasury bonds with a constant 10-year maturity (green line) fell by 0.099% to 3.761%. The yield on the BBB-rated corporate index (blue line) fell by 0.9% to 5.03%.
The spread between them remained unchanged at 1.30% compared to the previous week. Both yields are below the federal funds rate.
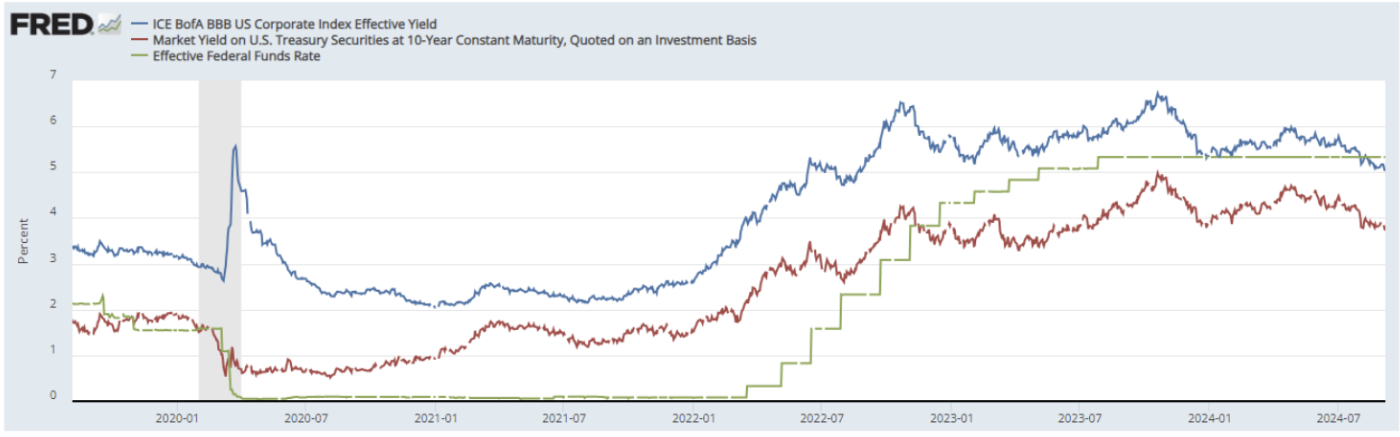
Last week, a key event occurred: the yield on 10-year bonds (3.761%) exceeded the 2-year rate (3.708%). The yield curve is no longer inverted (between these maturities), and the spread became positive at 0.055%. Market participants closely watch this metric.
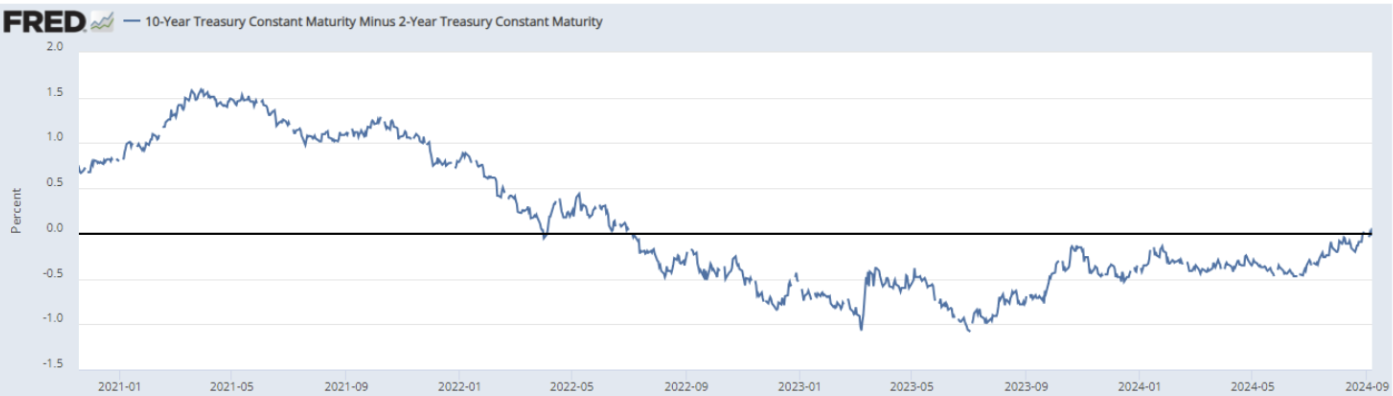
Before every recession in the U.S. economy, the yield curve inverted when the 2-year bond yield exceeded the 10-year yield. It is important to note that the recession didn't start immediately, but when the inversion ended and the spread turned positive.
Historically, this has been a reliable indicator of a recession.
There is no clear narrative in the market today regarding this. On one hand, the two-year cycle of monetary tightening will continue to impact the economy even as rates begin to fall, and we will see further economic slowdown for some time. On the other hand, the monetary stimulus from previous years could keep the economy from slipping into a recession.
The situation is highly complex amid the risks of a second inflation wave.
DOLLAR INDEX (DXY)
GOLD
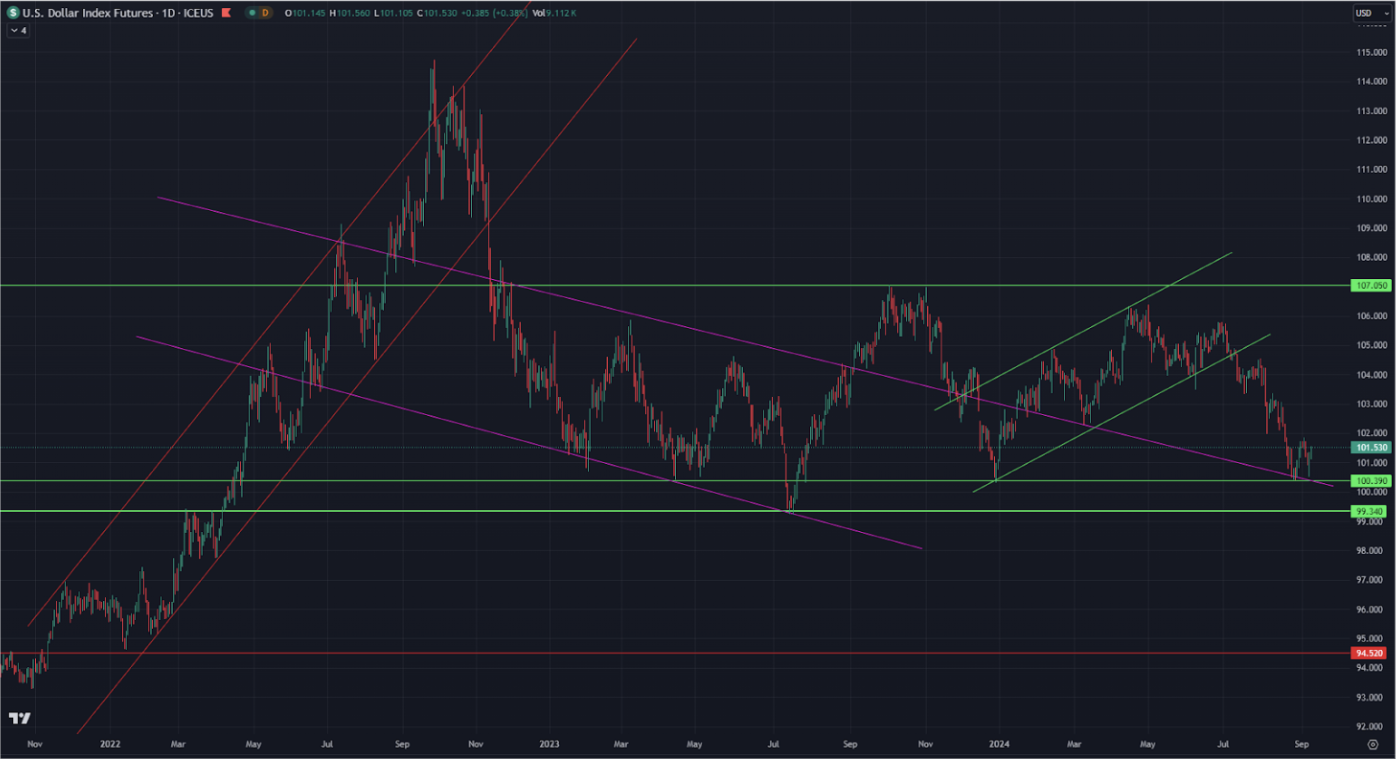
The DXY dollar index recently retested the lower boundary of the three-year horizontal channel for the second time.
The dollar's downward trend is driven by expectations that the Fed will lower interest rates as the economy weakens, and it is likely to remain under pressure until the end of the year.
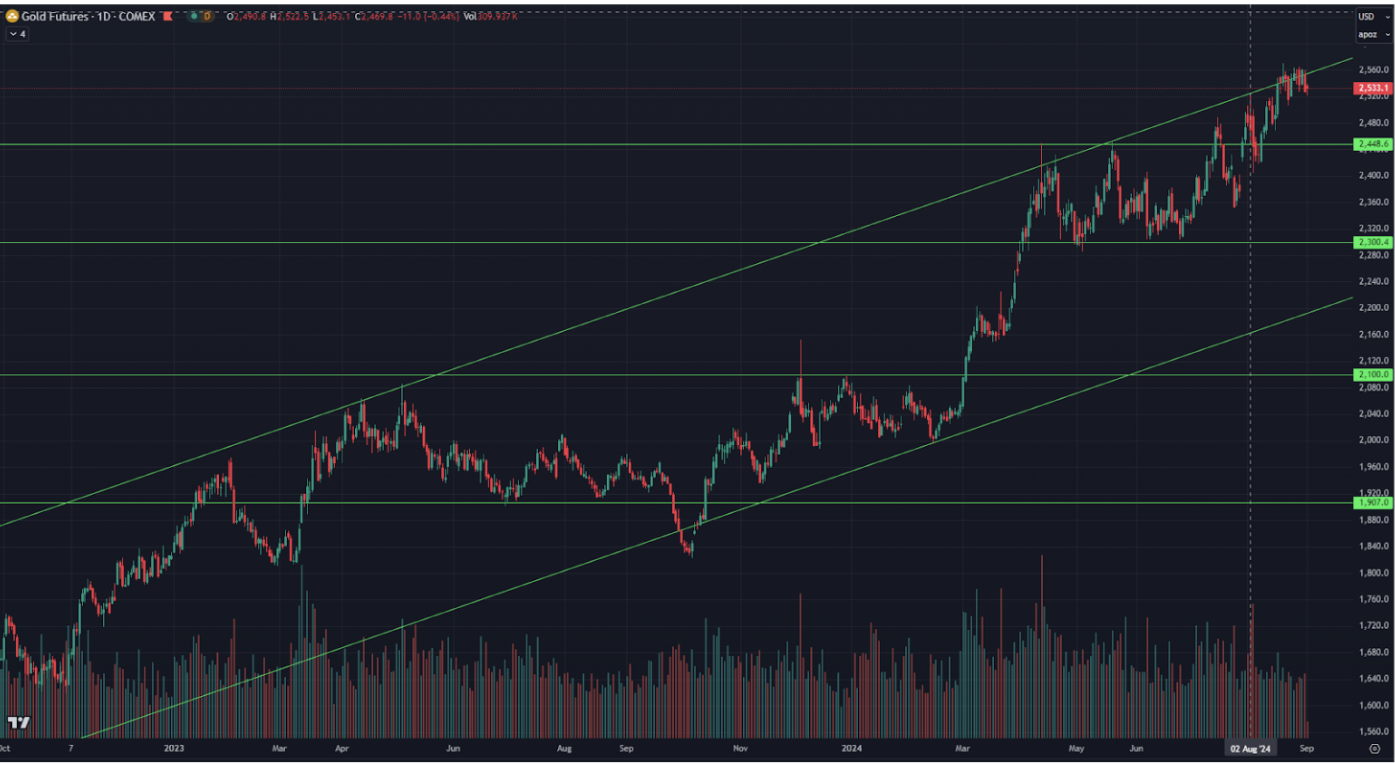
Gold futures have been trading in a narrow range of $2,560-2,530 per troy ounce since August 15, with low volatility, consolidating at the upper boundary of the ascending channel.
BTC
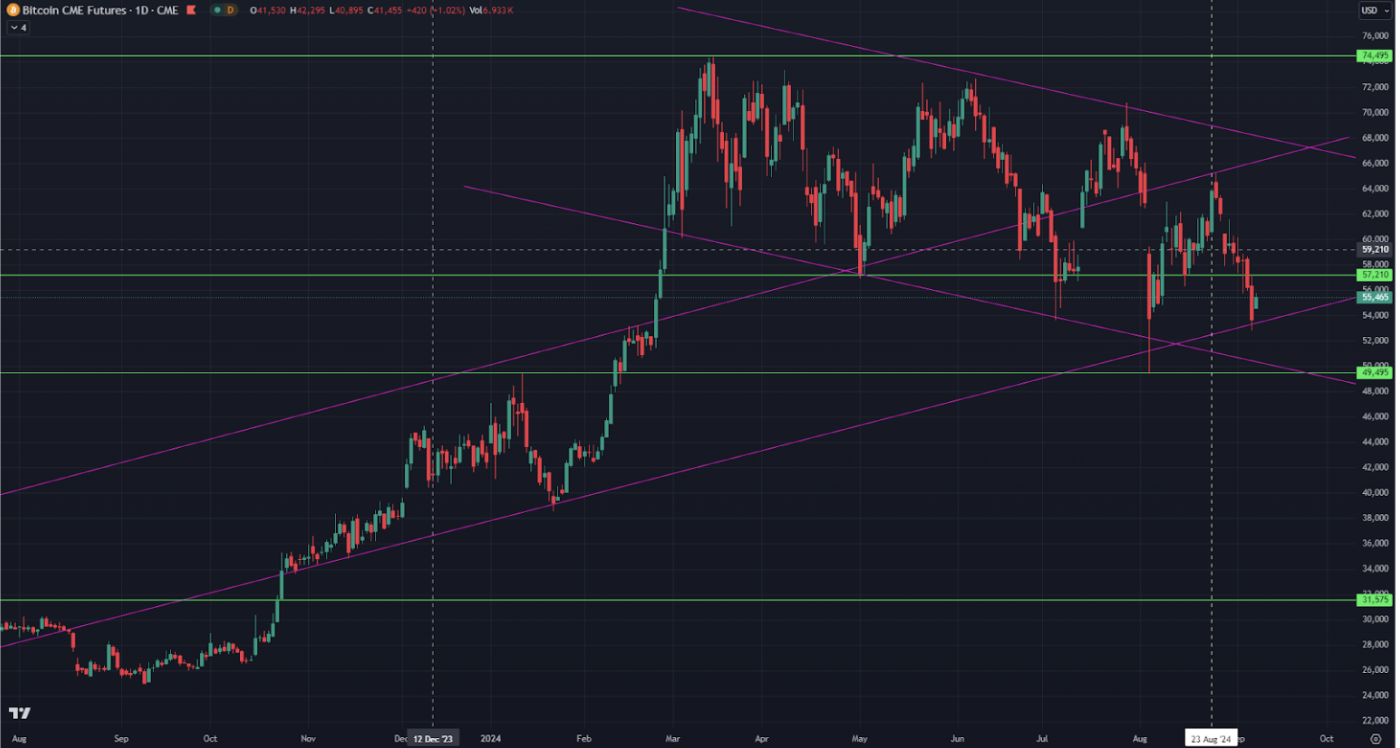
Bitcoin is in a downward channel since March of this year. The current futures price is $55.5K. Over the week, the asset fell by 8.5%, reflecting some correlation with declining risk appetite.
Interested in buying private tech companies' shares with us? Check out our Wealth and Growth account plans, which provide you access to exclusive venture capital deals!
Disclaimer: “The use of the trademark is for informational purposes only and does not imply endorsement or affiliation. Additionally, the information in this communication is for informational purposes only and is neither an offer to purchase, nor a solicitation of an offer to sell, subscribe for or buy any securities".