Lietuvių
 Русский
 Қазақша
 Eesti
EestiOctober 13–17, 2025: Weekly economic update
Key market updates

Macroeconomic Statistics
INFLATION
- Core Consumer Price Index (CPI) (m/m) (August): 0,3% (previous: 0.3%)
- Consumer Price Index (CPI) (m/m) (August): 0.4% (previous: 0.2%)
- Core Consumer Price Index (CPI) (y/y) (August): 3.1% (previous: 2.9%)
- Consumer Price Index (CPI) (y/y) (August): 2.9% (previous: 2.7%)
INFLATION EXPECTATIONS (MICHIGAN)
- 12-month expected inflation (August): 4.6% (prev: 4.7%)
- 5-year expected inflation (August): 3.7% (prev: 3.7%)
PRODUCER PRICE INDEX (PPI)
- PPI (m/m) (August): -0.1%, prev: 0.7%
- Core PPI (m/m) (August): -0.1%, prev: 0.7%
GDP (U.S. Bureau of Economic Analysis, BEA) (Q2 2025, annualized, second estimate): +3.8% (advance estimate: 3.30%; Q1 2024: – 0.5%)
Business Activity Index (PMI):
(Above 50 indicates expansion; below 50 indicates contraction)
- Services sector (August): 54.2 (previous: 54.5)
- Manufacturing sector (July): 52.0 (previous: 53,0)
- S&P Global Composite (August): 53.9 (previous: 53.6)
LABOR MARKET:
- Unemployment rate (August): 4.3% (previous: 4.2%)
- Total number of individuals receiving unemployment benefits in the US: 1,926K (vs 1,920K).
- Change in nonfarm payrolls (August): 22K (previously revised: 79K)
- Change in U.S. private nonfarm payrolls (August): 38K (previous: 77K)
- Average hourly earnings (August, y/y): +3.7% (previous: +3.9%)
- JOLTS job openings (August): 7.227M (vs. 7.181M)
- ADP Nonfarm Payroll Change (Submitted): -32К (vs-3К)
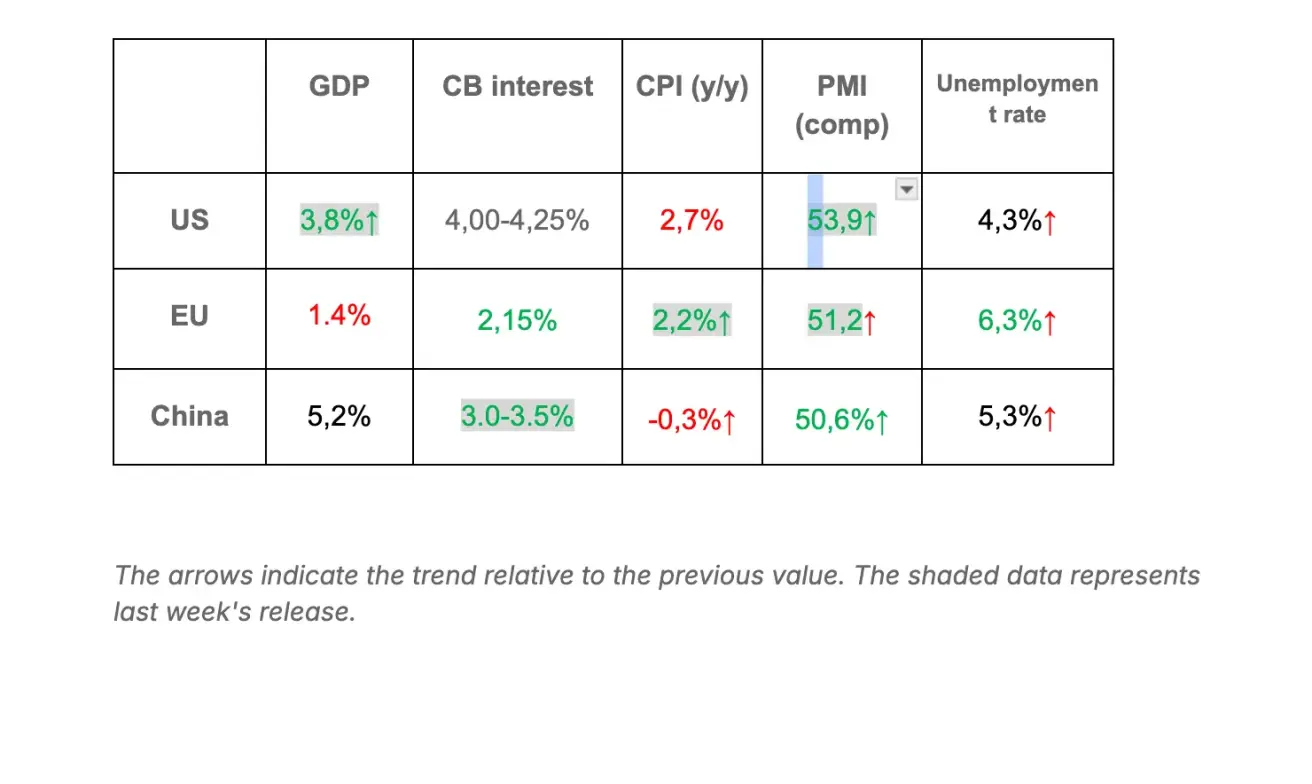
Summary of Key Macro Data: USA, EU, and China*
MONETARY POLICY
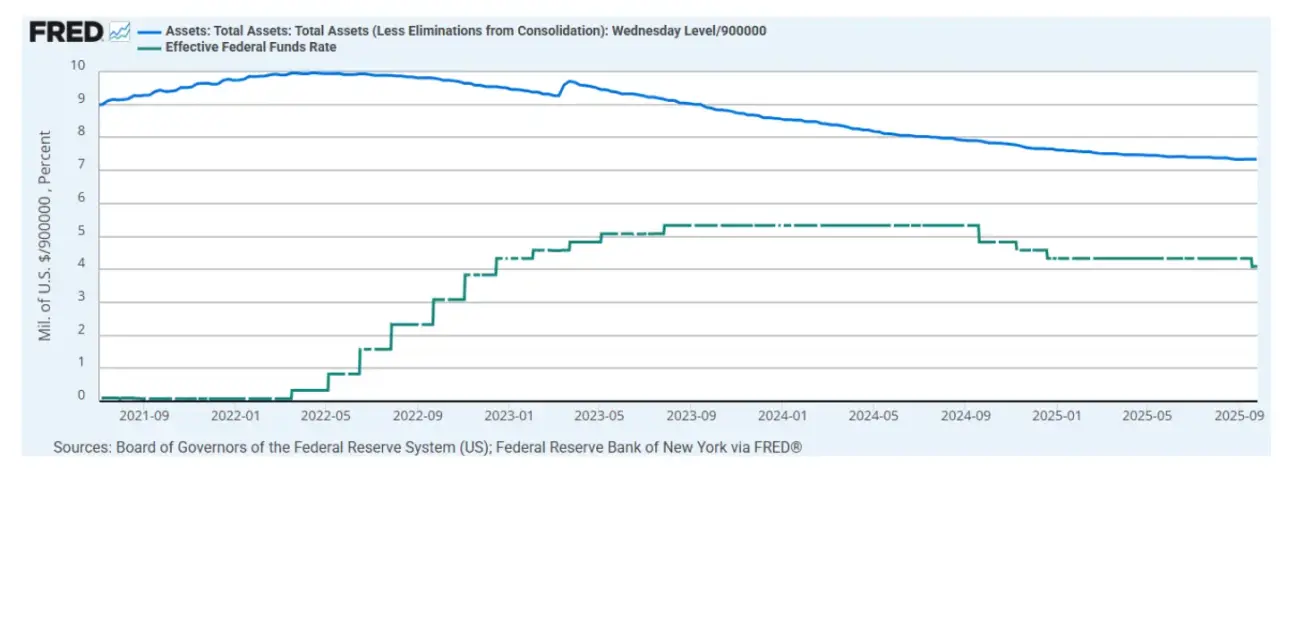
- Federal Funds Effective Rate (EFFR): 4.00% - 4.25% (unchanged)
- Federal Reserve balance sheet increased: $6,595T (vs. previous week: $6,590T)
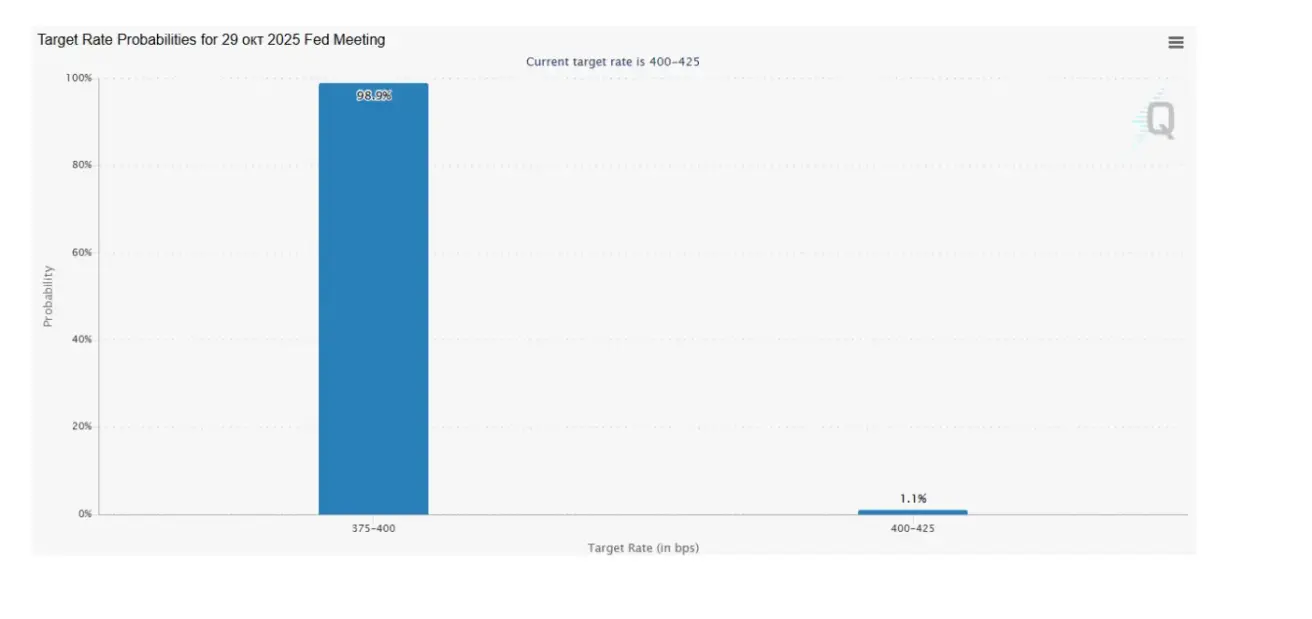
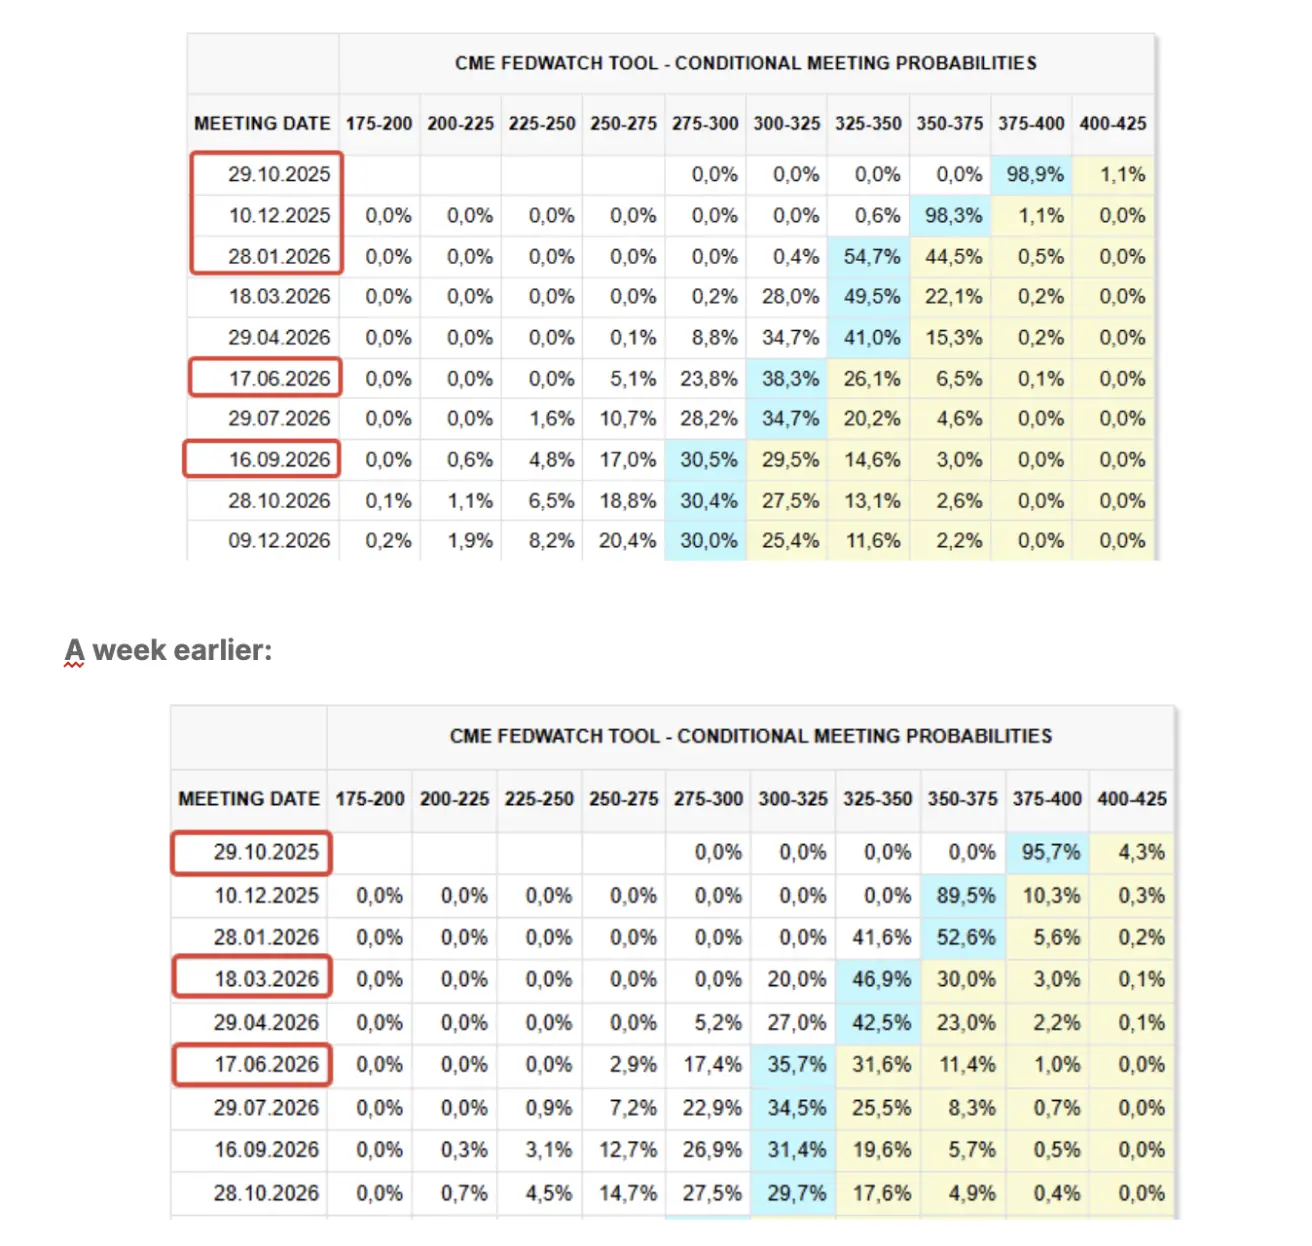
MARKET FORECAST FOR RATE (FEDWATCH)
Expectations for the upcoming FOMC meeting on October 29:
Today:
Commentary
Last week, sentiment across financial markets was supported by dovish remarks from Federal Reserve Chair Jerome Powell and a noticeable softening in Donald Trump’s rhetoric toward China. U.S. Treasury Secretary Bessent proposed extending the current pause on U.S. tariffs on Chinese goods in exchange for Beijing refraining from tightening export controls on rare earth metals. However, he warned that if China refuses, it will face “severe measures and a coordinated response from the U.S. and its allies.” Trump himself stated that “the threat of high tariffs against China is unsustainable and could negatively impact the U.S. economy.”
Jerome Powell reinforced expectations of a rate cut in October, while also hinting at a possible pause in balance sheet runoff. Key takeaways from his remarks:
-
There is currently no risk-free path for monetary policy;
-
Tariffs are adding to price pressures;
-
Risks of further labor market cooling have increased;
-
The Fed could act more flexibly regarding the size of its balance sheet (notably, the Fed’s balance sheet has been expanding for the second consecutive week, +$9bn);
-
The Fed may soon face a lack of reliable data—government shutdown delays could complicate decisions if October datasets are released late.
Stephen Miran — a Trump-aligned economist — said he “would prefer a 50 bps rate cut in October, and sees room for two additional cuts thereafter.”
Beth M. Hammack noted that the Fed’s 2% inflation target is unlikely to be achieved before the end of 2027.
Market-Based Rate Expectations (FedWatch)
-
Next FOMC meeting (October 29): Markets are pricing in a 98.9% probability of a 25 bps cut — implying only one rate cut for the remainder of the year.
-
Next 12 months: Markets are pricing in four 25 bps cuts to a 2.75–3.00% range.
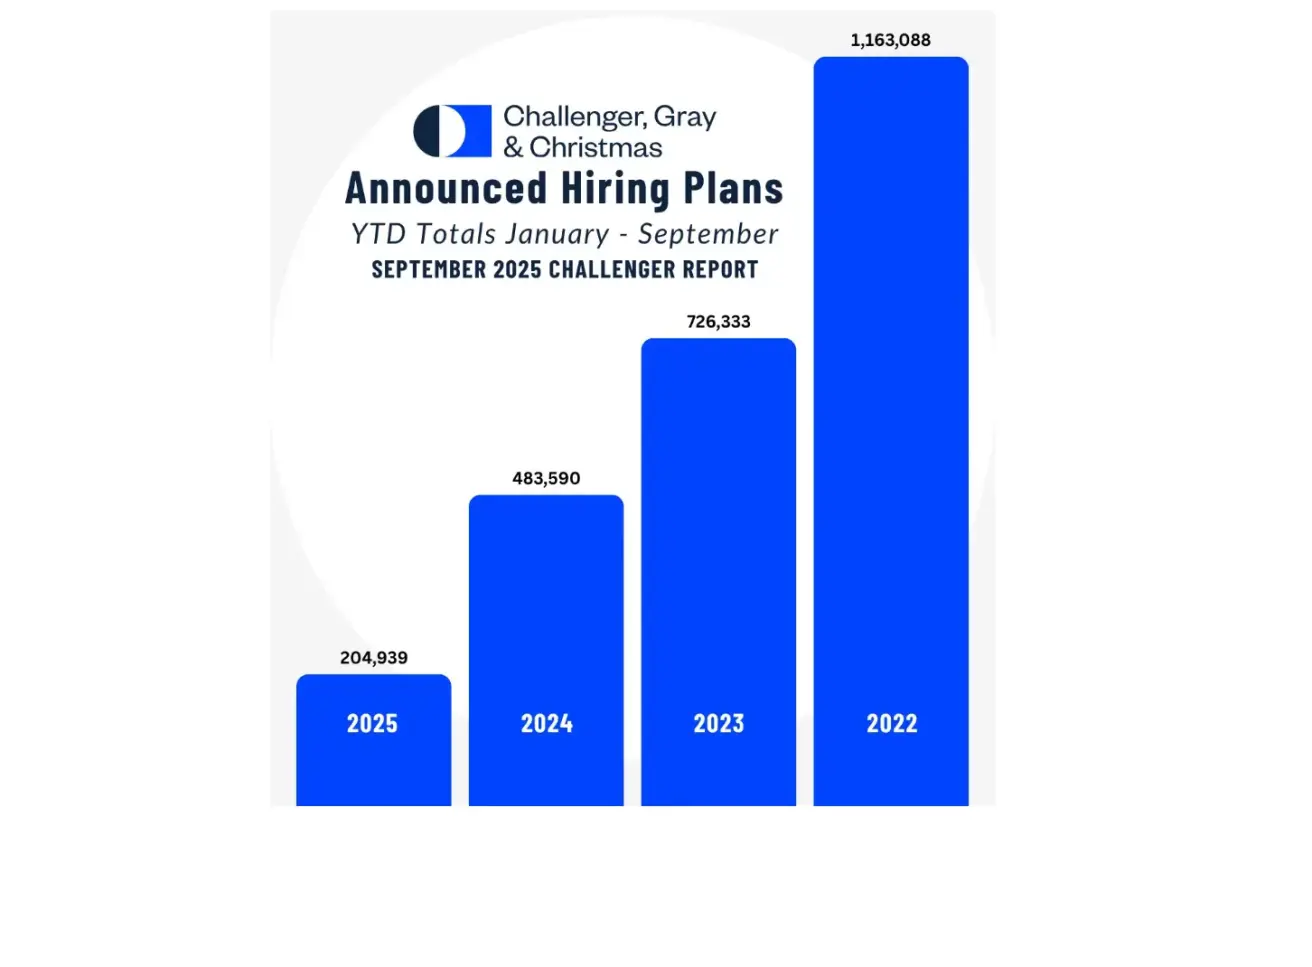
Labor Market: No Official Data Yet, but Early Signals Are Softening
Preliminary labor market indicators are weakening. According to Challenger, Gray & Christmas, a consultancy that assists laid-off workers in job placement and has offices nationwide: U.S. employers have announced plans to hire 205,000 workers this year — 58% less than in 2024, marking the lowest year-to-date hiring announcement figure since 2009.
MARKET
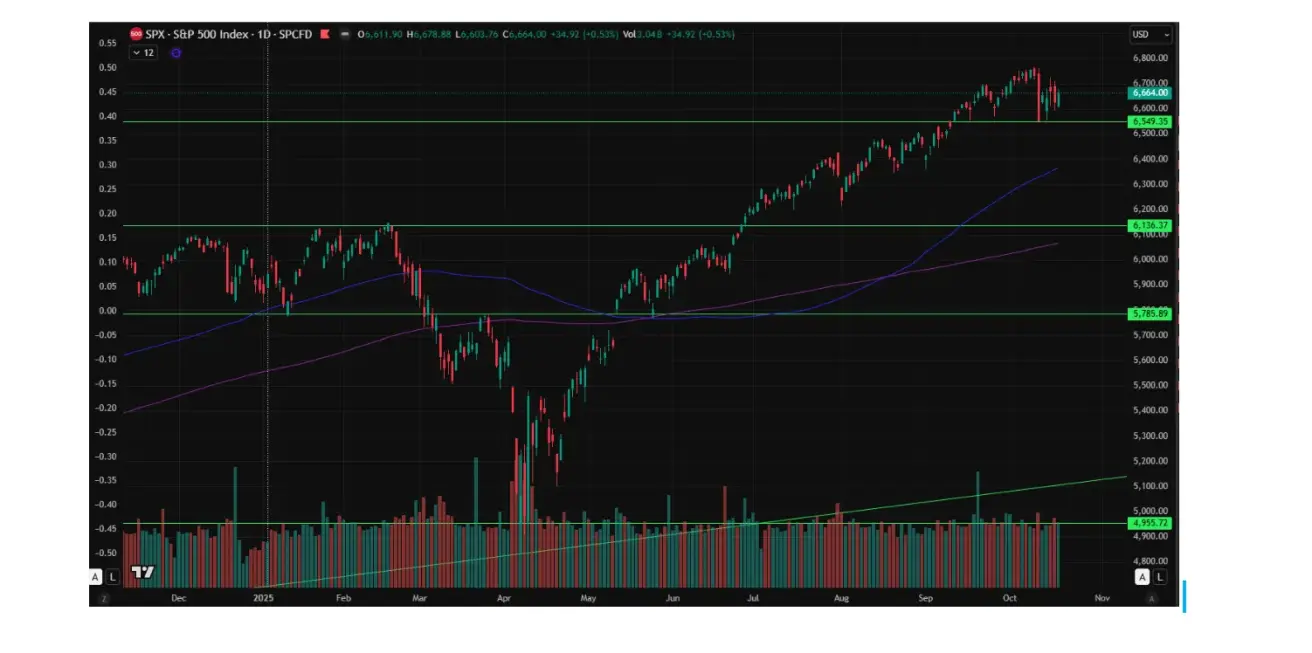
SP500
The S&P 500 index ended the week up +1,70%, closing at 6664,00. Year to date, the index is up +12.89%.
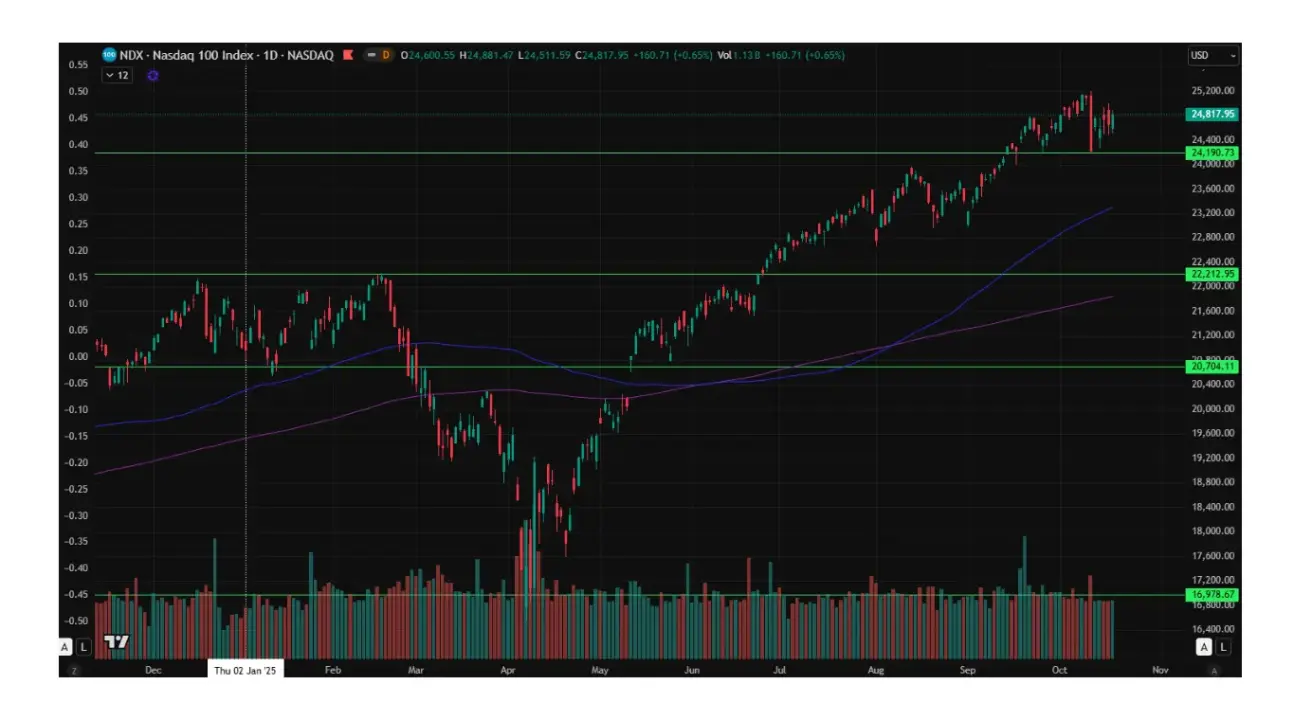
NASDAQ100
The Nasdaq 100 ended the week up +2,46%, closing at 24817,95. Year to date, the index is up +17,51%.
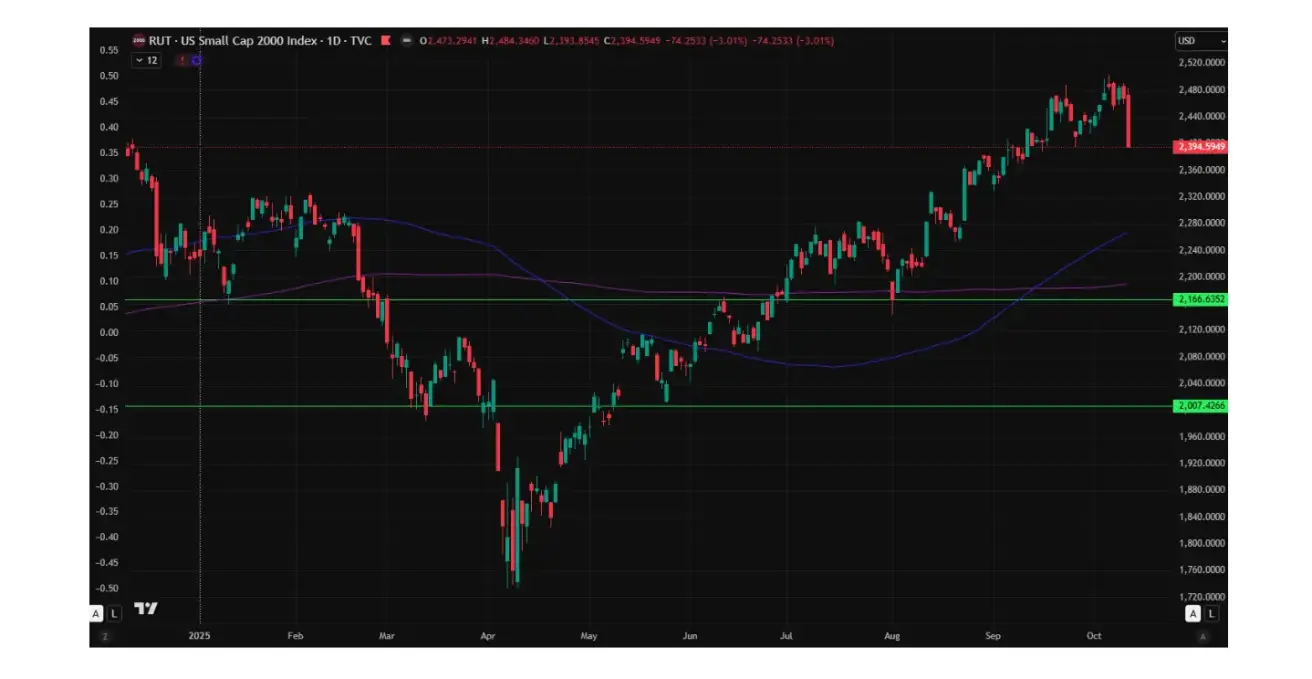
Russel 2000
Russel 2000 ended the week up +2,40%, closing at 2452,17. Year to date, the index is up +9,41%.
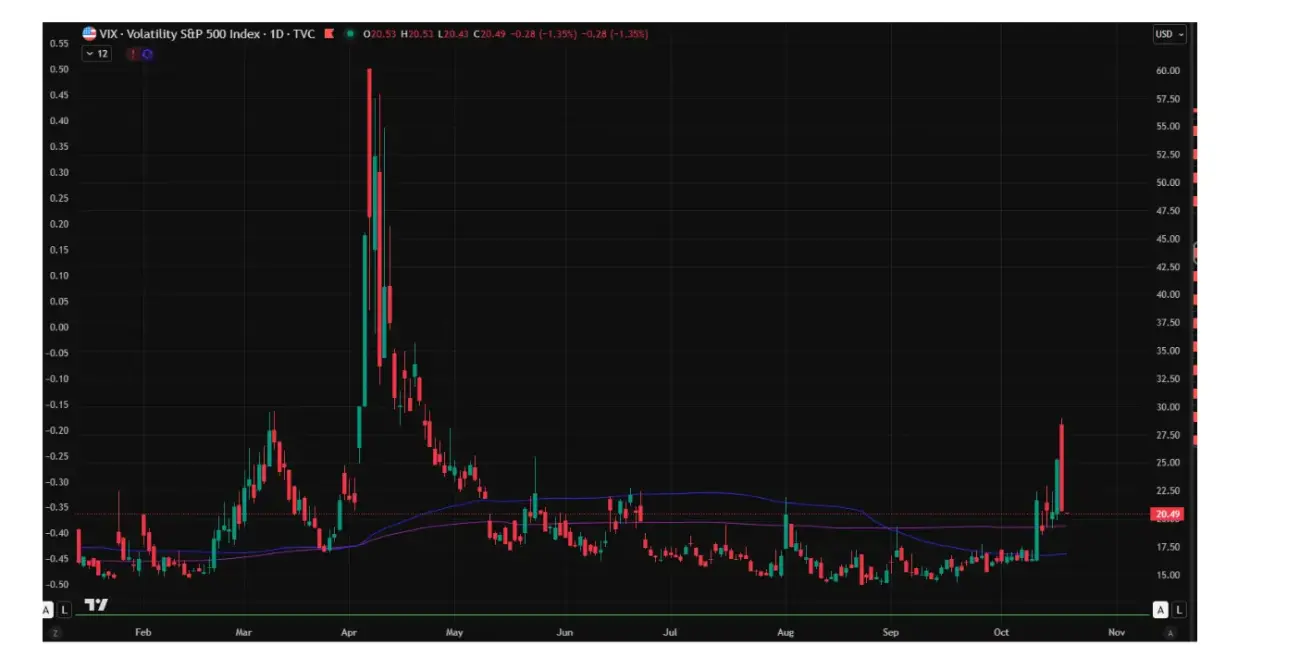
VIX
Week-End Close: 20.47.
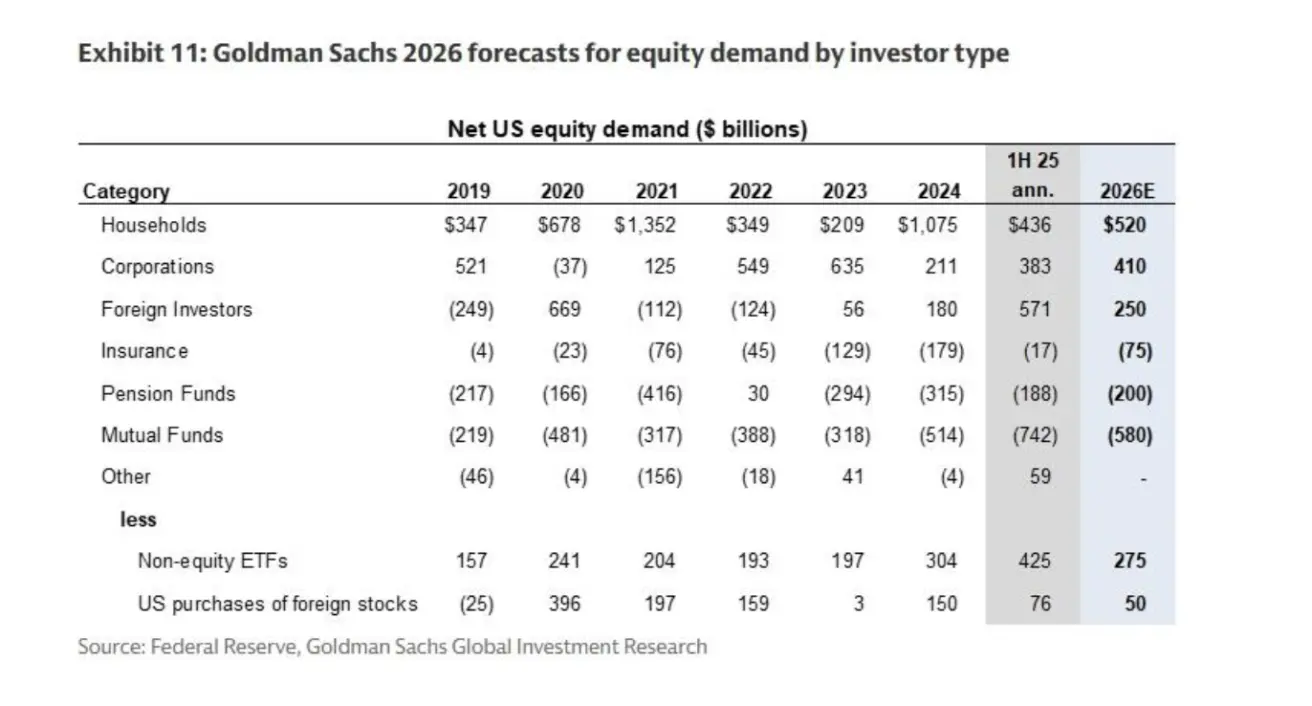
Goldman Sachs expects that households will become the largest buyers of U.S. equities next year, with net purchases totaling $520 billion. Corporate demand, primarily through share buybacks, is projected to rise to $410 billion. Foreign investor inflows are expected to remain positive but nearly halve to $250 billion. Meanwhile, pension funds, insurance companies, and mutual funds are anticipated to continue net outflows from the U.S. equity market.
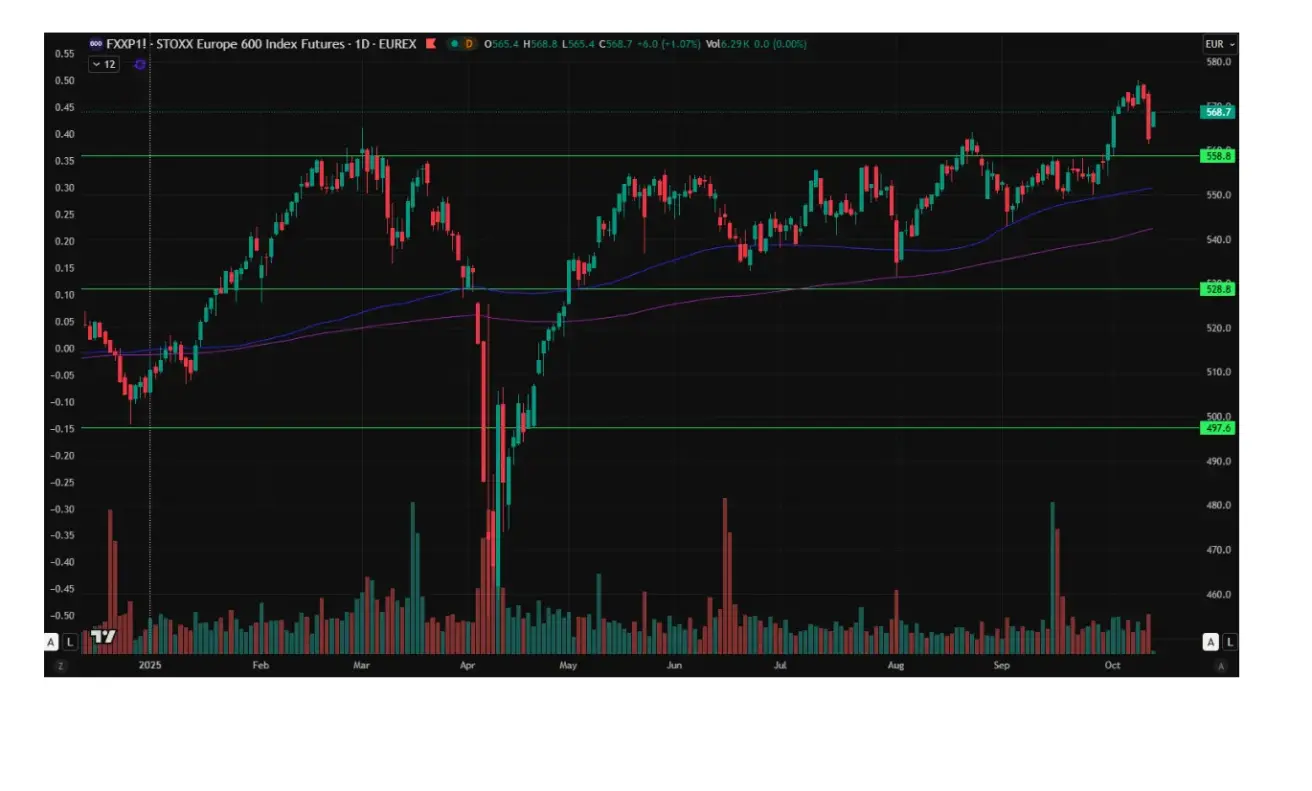
Euro Stoxx 600
The Euro Stoxx 600 ended the week down -1,39%, closing at 570,5. Year to date, the index is up +12,84%.
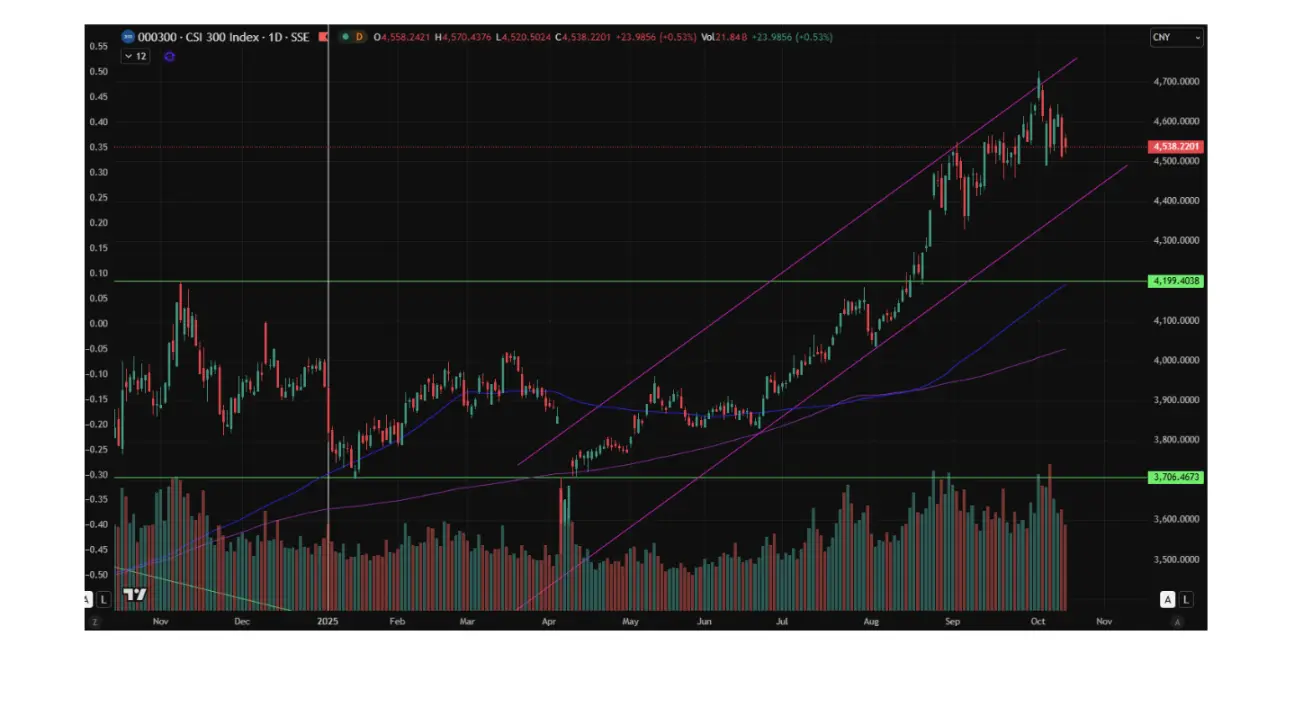
CSI 300 Index
The CSI 300 Index closed the week at 4514,23, down -2,22%, with a year-to-date gain of +14,84%.
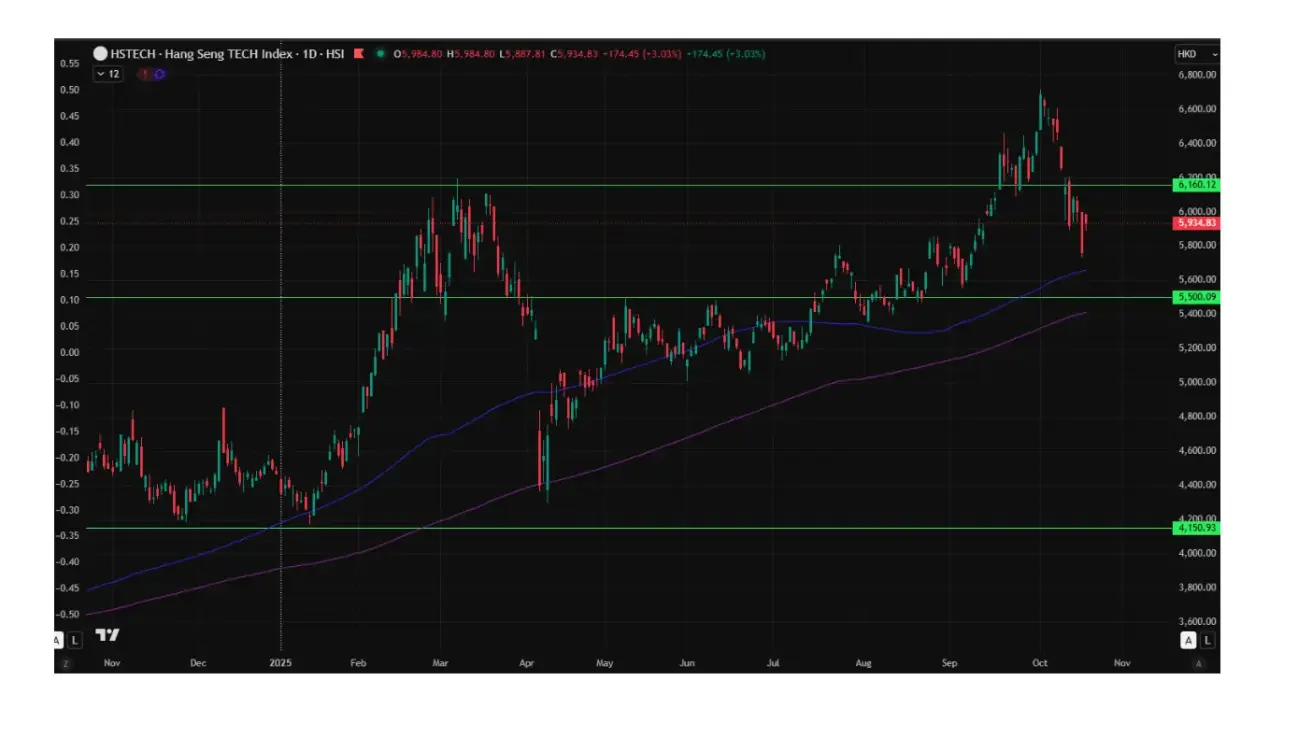
Hang Seng TECH Index (HSTECH.HK)
The Hang Seng TECH Index (HSTECH.HK) opened Monday down -7.98%, at 5760,38. However, during today’s Asian session, the market is up +3.24%. Year to date, the index has advanced +29,83%.
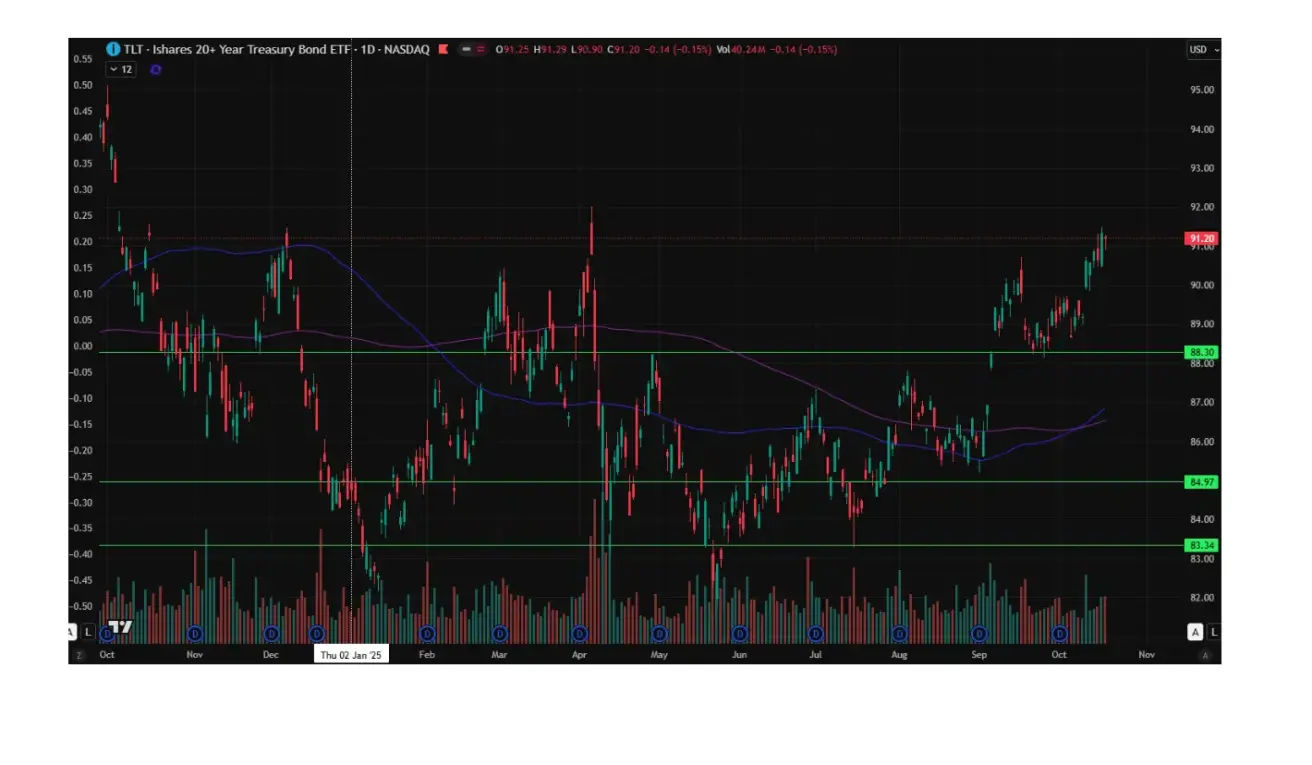
BOND MARKET
The 20+ Year U.S. Treasury Bond ETF (TLT) ended the week up +0,64%, closing at 91,20. Year to date, the index is up +3.87%.
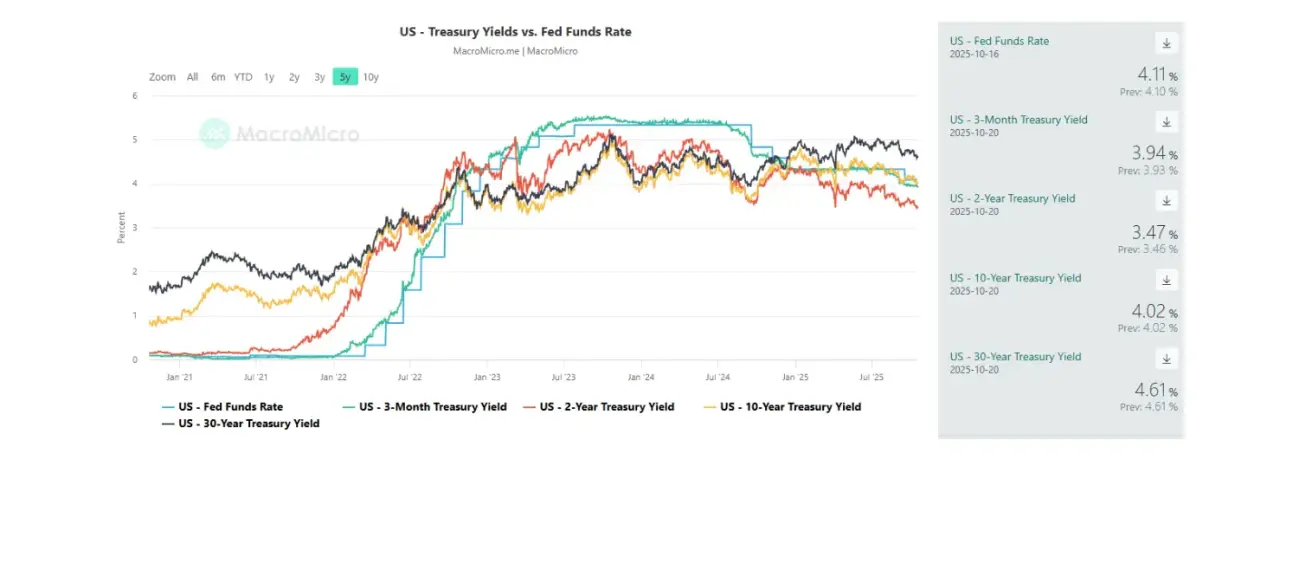
YIELDS AND SPREADS
- Market yield on U.S. Treasury securities (10-year constant maturity): 4.02% (vs. 4.08%).
- ICE BofA BBB U.S. Corporate Index effective yield: 4.88% (vs. 5.01%).
- Yield spread — 10-year vs. 2-year Treasuries: 55.0 bps (vs. 57.0 bps).
- Yield spread — 10-year vs. 3-month Treasuries: 8.0 bps (vs. 19.0 bps).
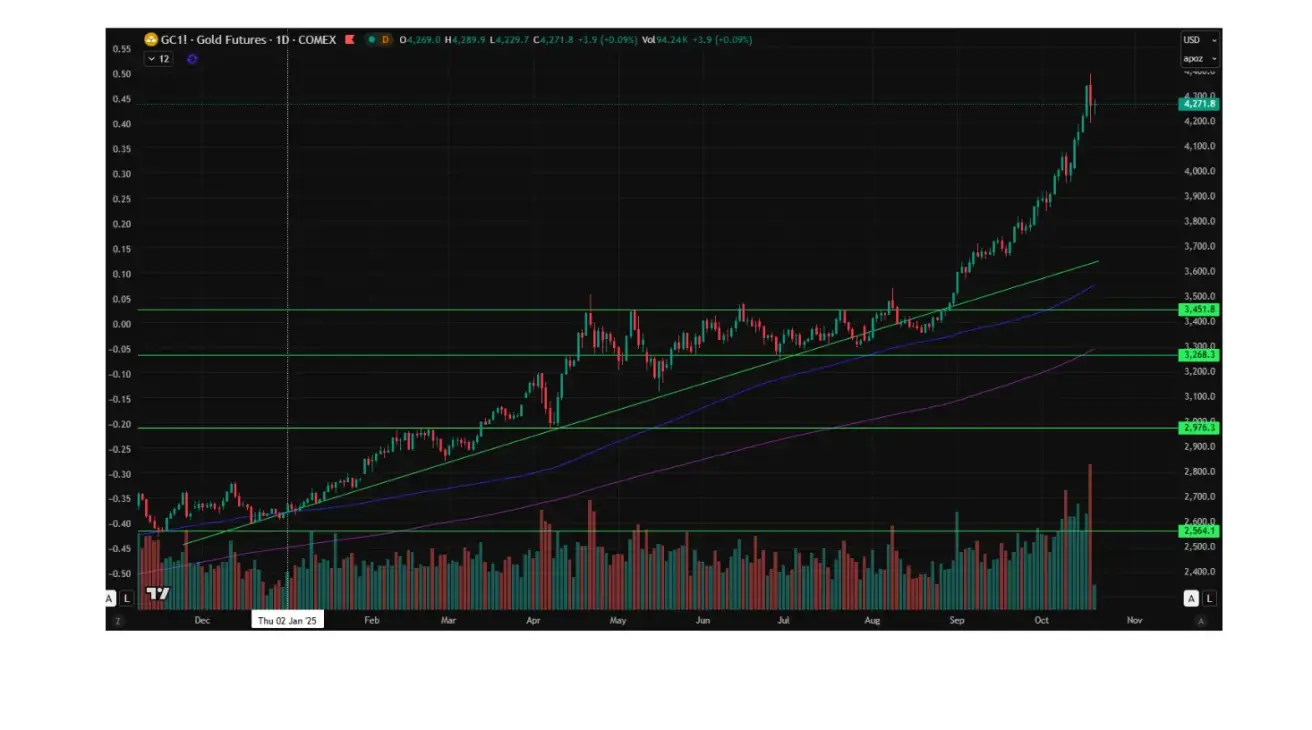
GOLD FUTURES (GC)
The gold futures (GC) contract ended the week up +5,76%, closing at $4267,9 per troy ounce. Year to date, it has gained +61,60%.
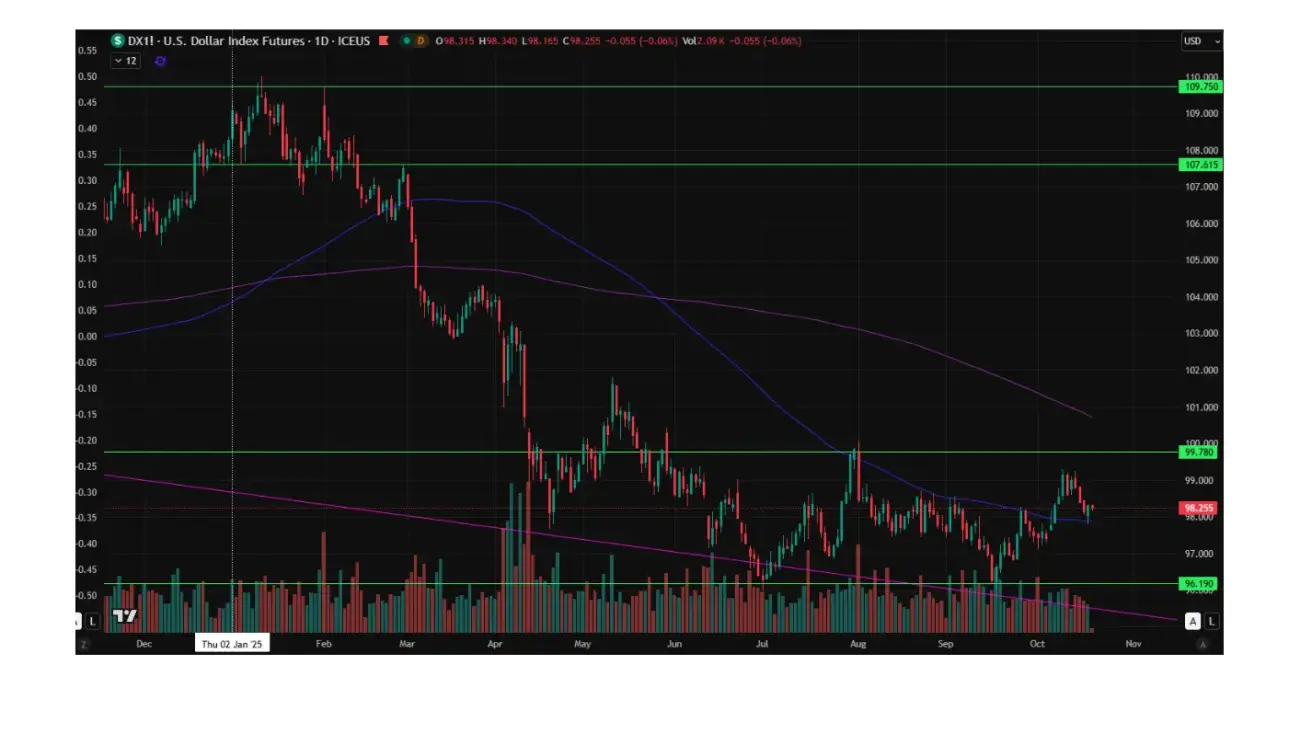
DOLLAR INDEX FUTURES (DX)
The U.S. Dollar Index futures (DX) ended the week down -0.31%, closing at 98.31. Year to date, the index is down –9,25%.
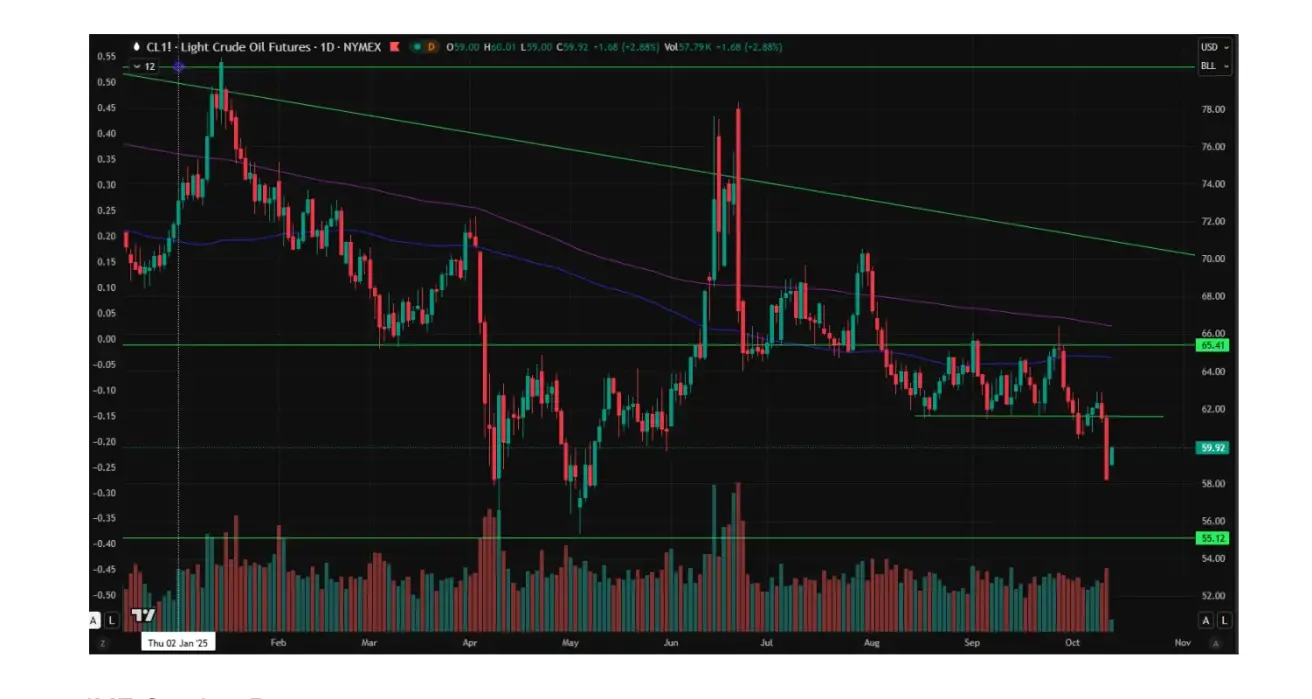
OIL FUTURES
The crude oil futures (CL) contract ended the week down -1.70%, closing at 57.25. Year to date, the index is down –20,32%.
IMF October Report
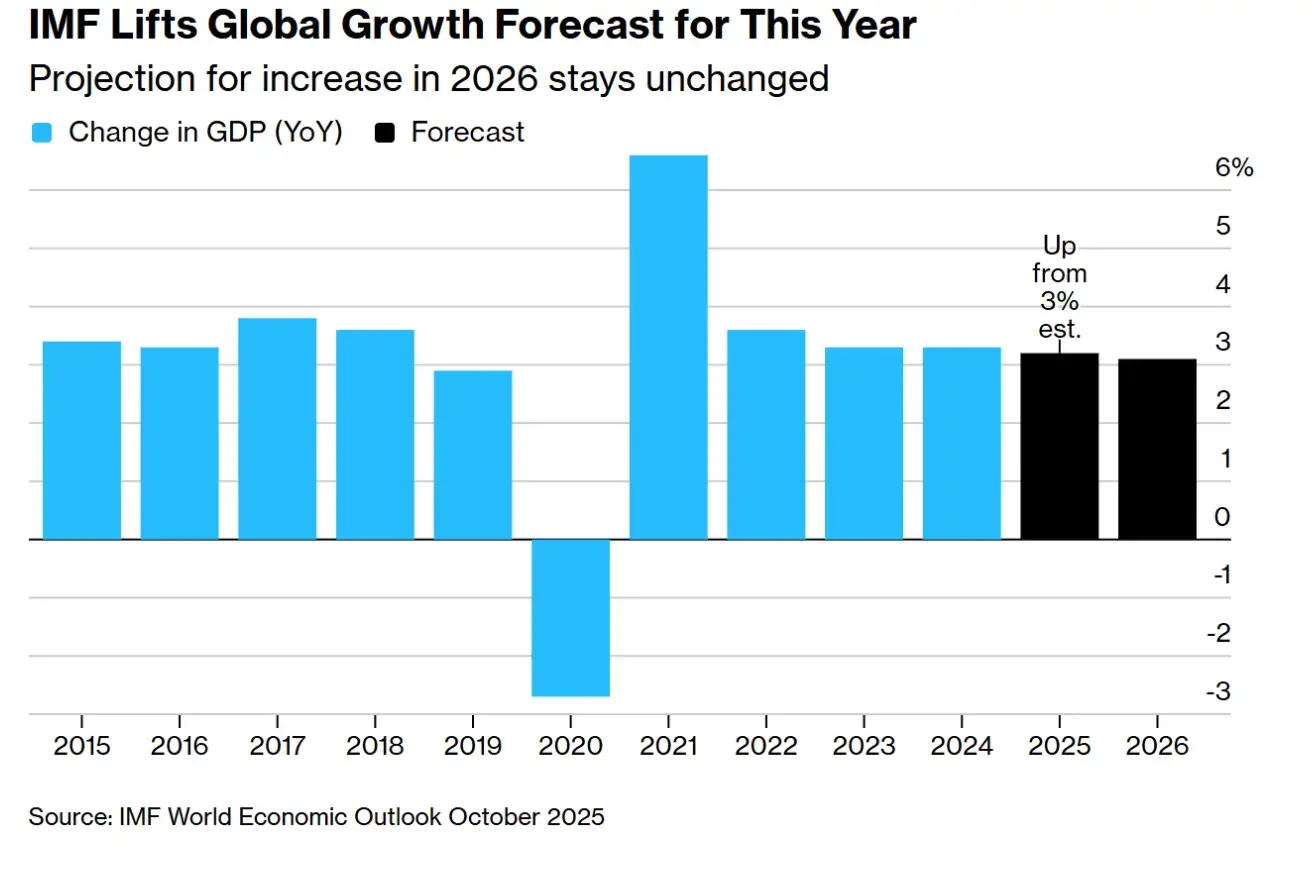
The International Monetary Fund (IMF) warned that the global economy is showing signs of strain due to large-scale U.S. tariffs and protectionist measures.
-
Global growth is now expected at 3.2% in 2025, up from the 3.0% forecast in July, while growth is projected to slow to 3.1% in 2026.
-
The report notes that prospects remain “unimpressive” both in the short and long term.
Regional Outlook:
-
United States: growth slowing to 2.0% in 2025; 2.1% in 2026
-
Eurozone: 1.2% (2025); 1.1% (2026)
-
China: 4.8% (2025); 4.2% (2026)
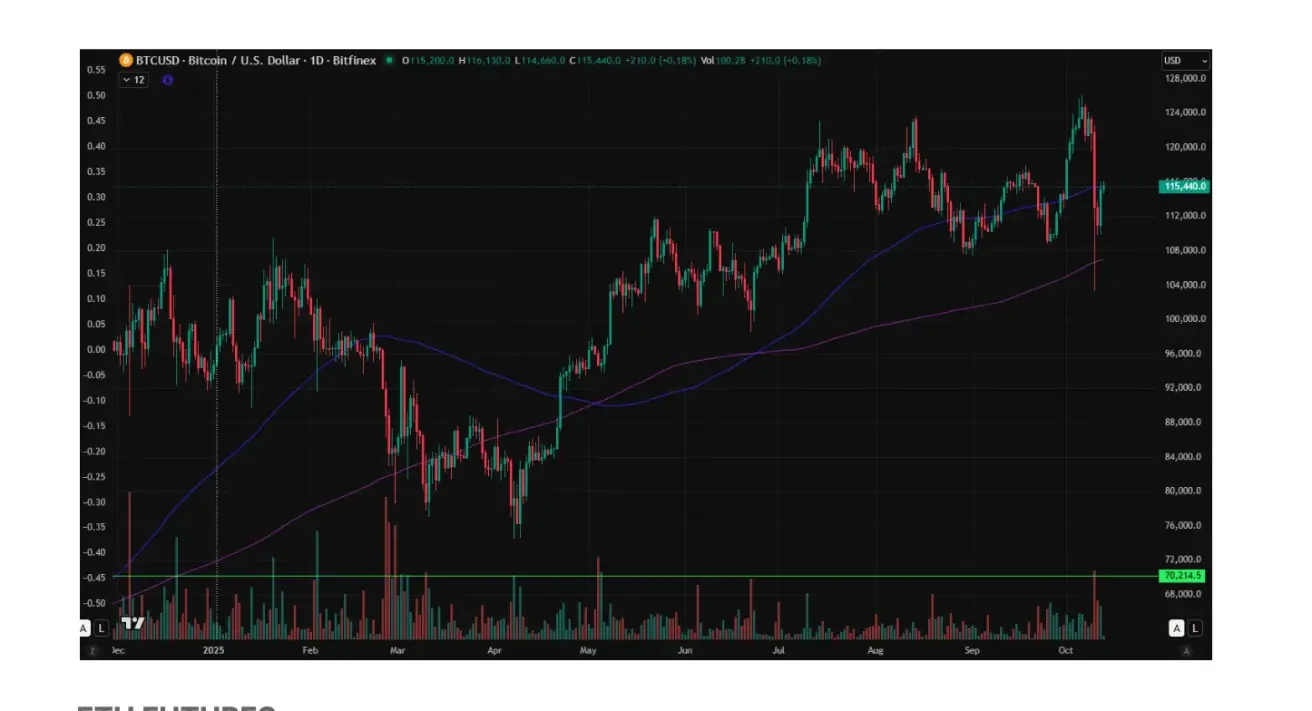
BTC FUTURES
Bitcoin ended the week down -5.55%, closing at $115230. Year to date, it has gained +22.90%.
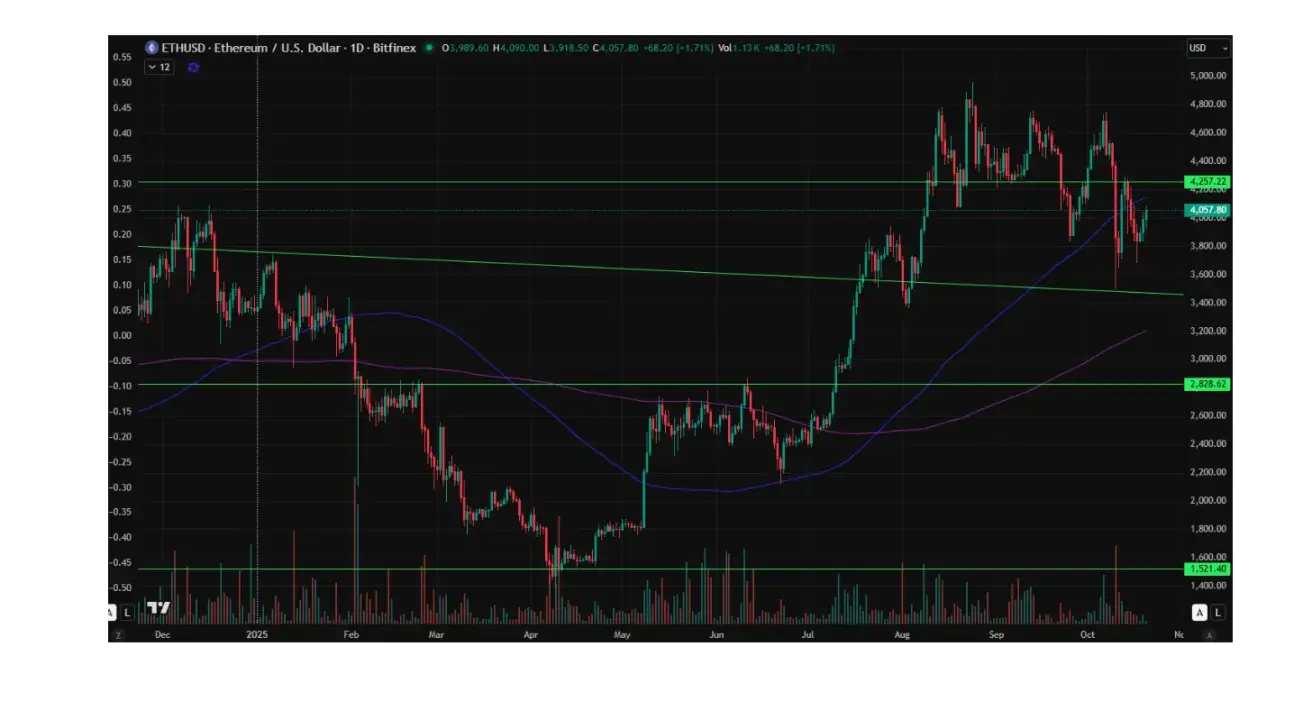
ETH FUTURES
Ethereum ended the week down -4.15%, closing at $3989,6. Year to date, it has gained +19,30%.
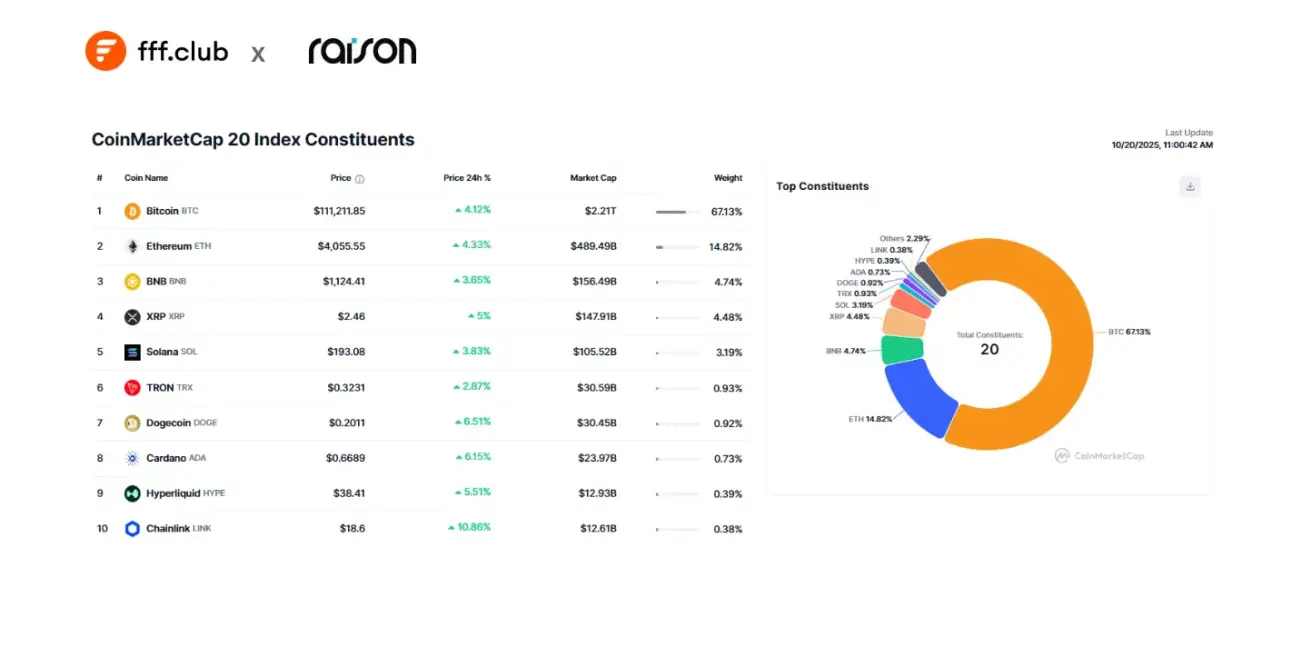
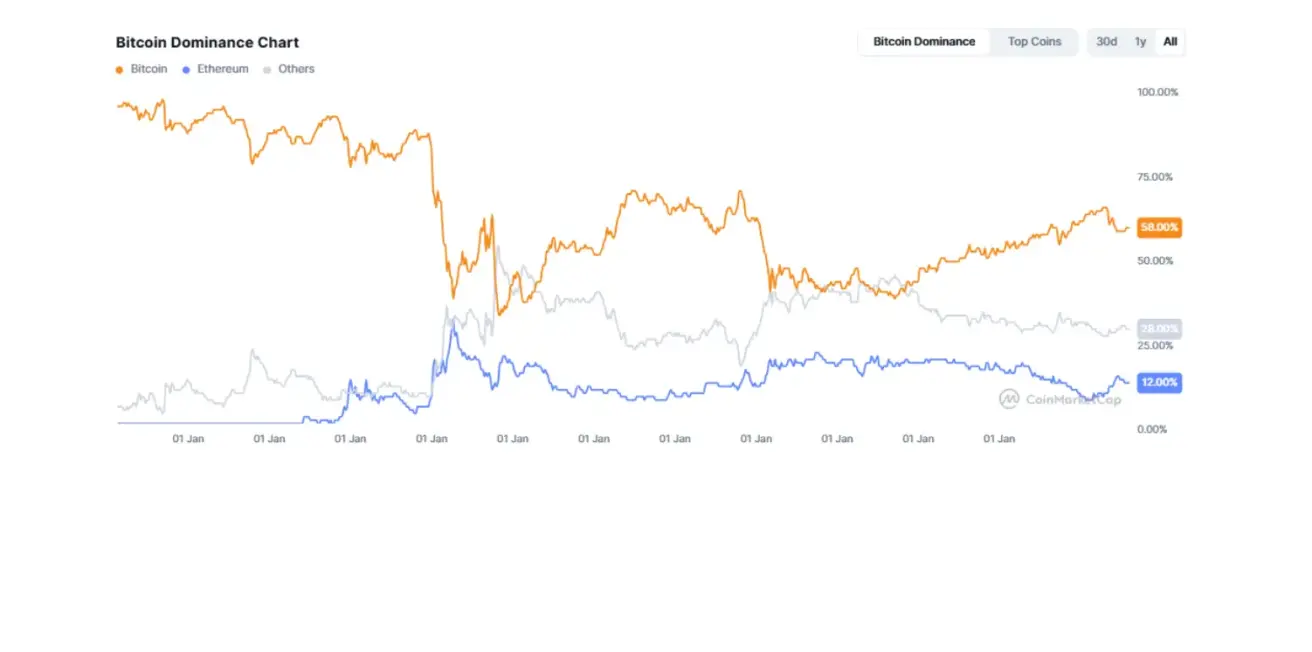
The total cryptocurrency market capitalization stands at $3.77 trillion (vs. $3.93 trillion a week earlier) (source: CoinMarketCap).
- Bitcoin’s share is 58.8% (vs. 58.5%),
- Ethereum’s share is 13.0% (vs. 13.0%),
- Other assets account for 28.2% (vs. 28.6%).
In Q3 2025, the number of public companies holding Bitcoin increased by 38.7%, reaching 172 companies by the end of the quarter. These companies collectively hold 1.02 million BTC, valued at approximately $117 billion
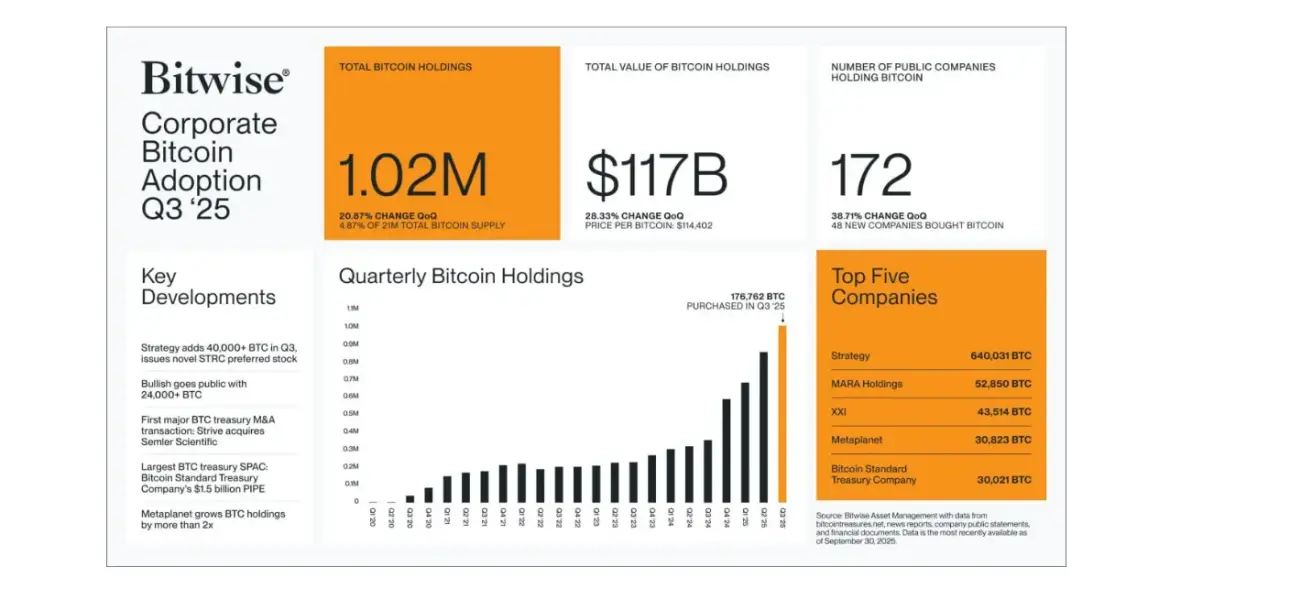
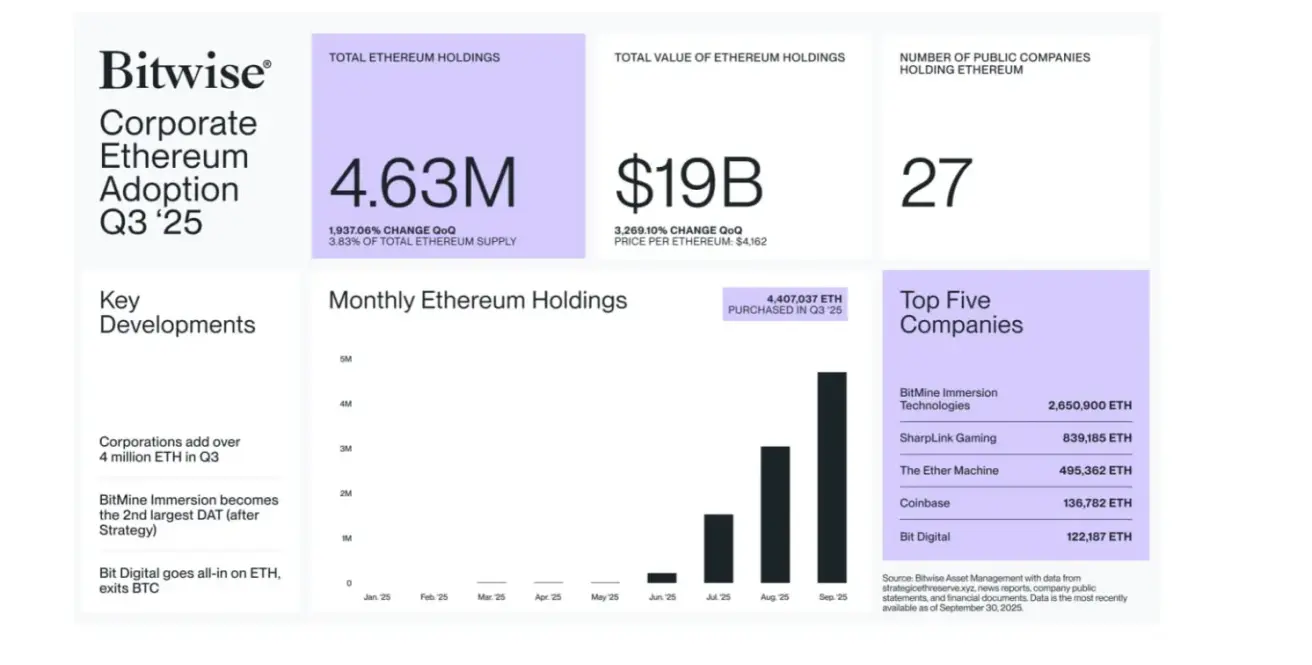
During Q3 2025, public companies added 4.63 million ETH to their treasuries. A total of 27 companies now hold Ethereum with a combined value of approximately $19 billion.
CoinMarketCap Top 20 Index Constituents: