 English
 Lietuvių
 Қазақша
 Eesti
Eesti8–14 декабря 2025 года: еженедельный экономический обзор
Ключевые события на рынках

На прошлой неделе состоялось финальное в этом году заседание FOMC, на котором ставка денежно‑кредитной политики, как и ожидалось, была снижена на четверть процентного пункта, одновременно с возобновлением количественного смягчения (всего через 12 дней после завершения количественного ужесточения). Это заседание стало одним из самых «мягких» в текущем году.
В течение месяца ФРС планирует выкупить до 40 млрд долл. казначейских векселей со сроком обращения 1–3 месяца. Регулятор, по‑видимому, действует упреждающе: в настоящий момент признаков дефицита ликвидности на денежном рынке нет, однако объёмы операций на рынке обратного РЕПО остаются весьма ограниченными, а после 31 января сохраняется риск приостановки работы правительства. В целом, когда центральный банк выступает в роли покупателя государственного долга, фондовые рынки, как правило, воспринимают это как позитивный сигнал.
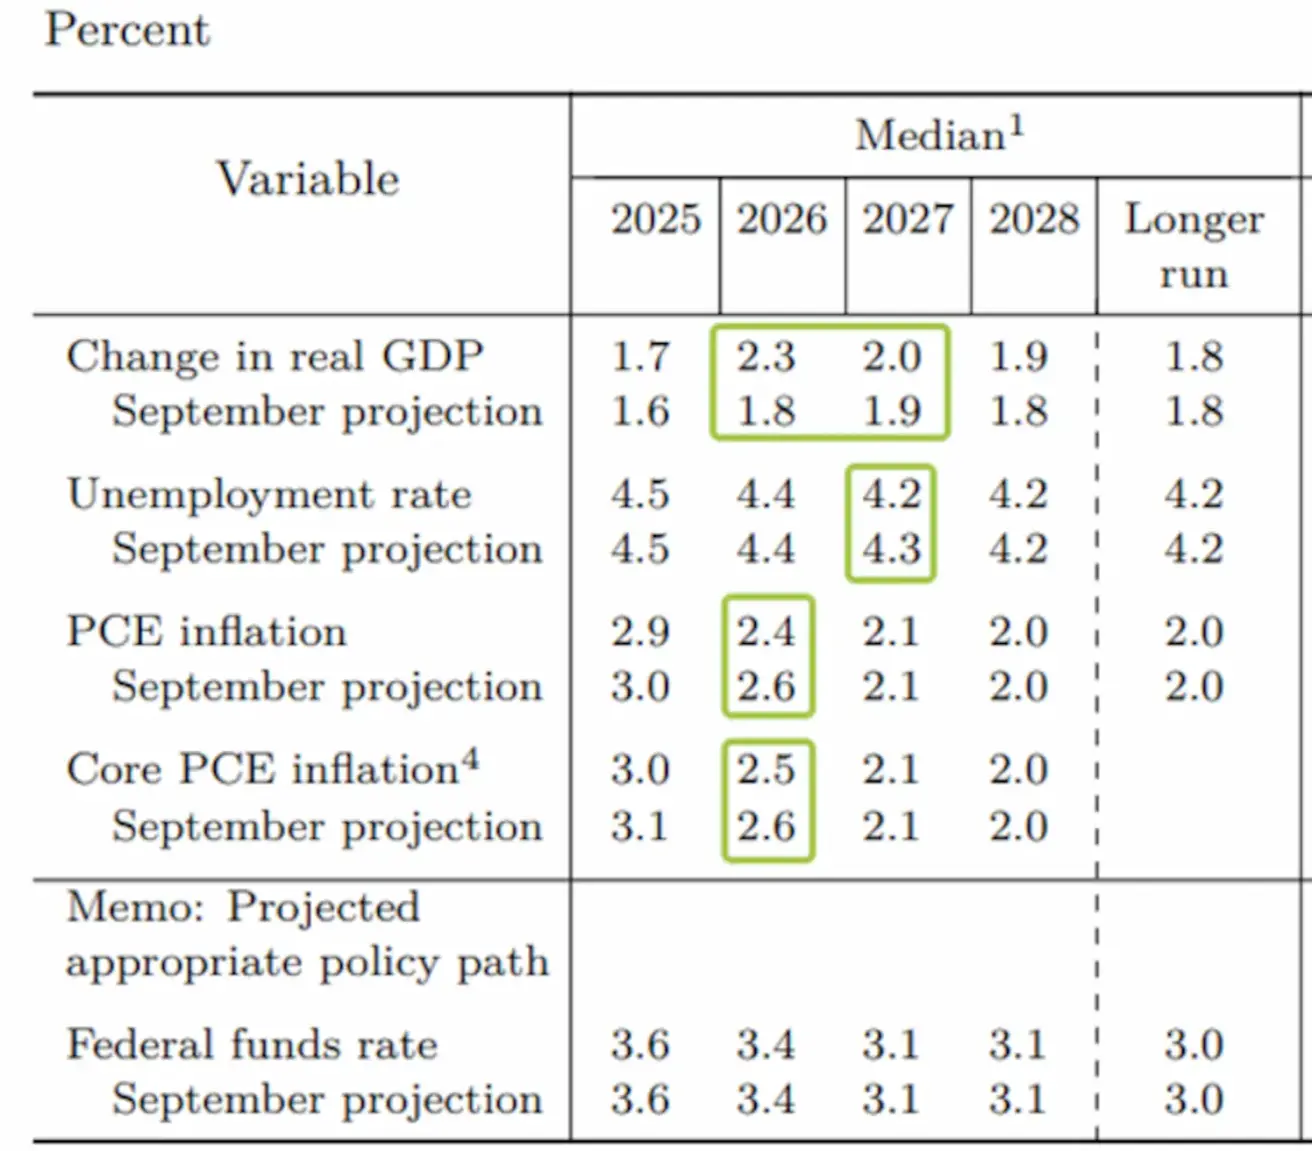
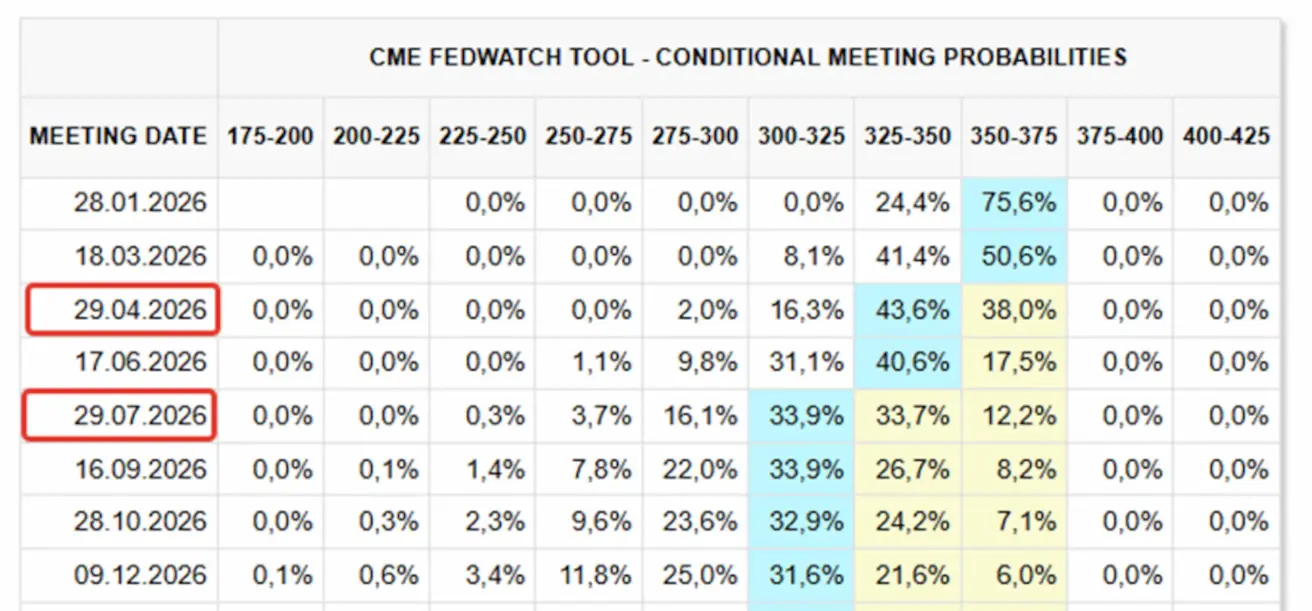
Что касается процентных ставок, Пауэлл отметил, что снижение было обусловлено охлаждением условий на рынке труда. Текущая ставка денежно‑кредитной политики находится в верхней части нейтрального диапазона, что означает существенное замедление темпов дальнейшего смягчения. Это также отражено в обновлённых прогнозах ставок ФРС на 2026 год, которые предполагают лишь одно дополнительное снижение, в результате чего ставка окажется в диапазоне 3,25–3,50%. Однако рынок свопов (FedWatch), как это традиционно бывает, по‑прежнему опережает регулятора и закладывает два снижения ставки в 2026 году, первое из которых ожидается лишь на апрельском заседании.
Исходя из пересмотренных макроэкономических прогнозов, ФРС демонстрирует почти идеальный сценарий на 2026–27 годы. В частности, ожидается более высокий экономический рост (увеличение темпов роста ВВП до 2,3%), устойчивое снижение инфляции до 2,1% и стабильный рынок труда (с понижением безработицы до исторически низкого уровня 4,2%). Торговые споры также несут заметные преимущества для США: многие страны в рамках переговоров взяли на себя обязательства инвестировать сотни миллиардов долларов в экономику США.
Макроэкономическая статистика
ИНФЛЯЦИЯ (сентябрь)
- Базовый индекс потребительских цен (CPI) (м/м): 0,2% (предыдущее значение: 0.3%)
- Индекс потребительских цен (CPI) (м/м): 0.3% (предыдущее значение: 0.4%)
- Базовый индекс потребительских цен (CPI) (г/г): 3.0% (предыдущее значение: 3.1%)
- Индекс потребительских цен (CPI) (г/г): 3.0% (предыдущее значение: 2.9%)
Индекс цен производителей (сентябрь):
- PPI (м/м): 0.3% (предыдущее: -0.1%)
- Базовый PPI (м/м): 0.1% (предыдущее: -0.1%)
ИНФЛЯЦИОННЫЕ ОЖИДАНИЯ (MICHIGAN)
- Ожидаемая инфляция на 12 месяцев (ноябрь): 4.1% (предыдущее: 4.5%)
- Ожидаемая инфляция на 5 лет (ноябрь): 3.2% (предыдущее: 3.4%)
Базовый индекс цен расходов на личное потребление (Core PCE, сентябрь) — предпочтительный показатель базовой инфляции для Федеральной резервной системы:
- м/м: 0.2% (предыдущее: 0.2%)
- г/г: 2.8% (предыдущее: 2.9%)
ВВП (Бюро экономического анализа США, BEA) — 2 кв. 2025 г., в годовом выражении, третья оценка: +3.8% (вторая оценка: +3.30%; 1 кв. 2024 г.: –0.5%). Оценка Atlanta Fed GDPNow (4 кв.): 3.9% (против 3.9%). (Модель прогноза GDPNow предоставляет «real-time» приближение к официальной оценке ВВП до момента её публикации, используя методологию, в целом согласованную с подходом Бюро экономического анализа США.)
Индекс деловой активности (PMI) (октябрь):
(Значение выше 50 указывает на расширение; ниже 50 — на сокращение)
- Сектор услуг: 54.1 (предыдущее: 54.8)
- Обрабатывающая промышленность: 52.2 (предыдущее: 52.5)
- S&P Global Composite: 54.2 (предыдущее: 54.6)
РЫНОК ТРУДА (данные за сентябрь, BLS; показатели за октябрь будут опубликованы позже вместе с ноябрьским отчётом)
Данные по рынку труда превысили ожидания по ряду индикаторов:
- Уровень безработицы: 4.4% (предыдущее: 4.3%)
- Общее число лиц, получающих пособия по безработице в США: 1,838K (против 1,937K)
- Первичные заявки на пособие по безработице: 236K (против пересмотренных 192K)
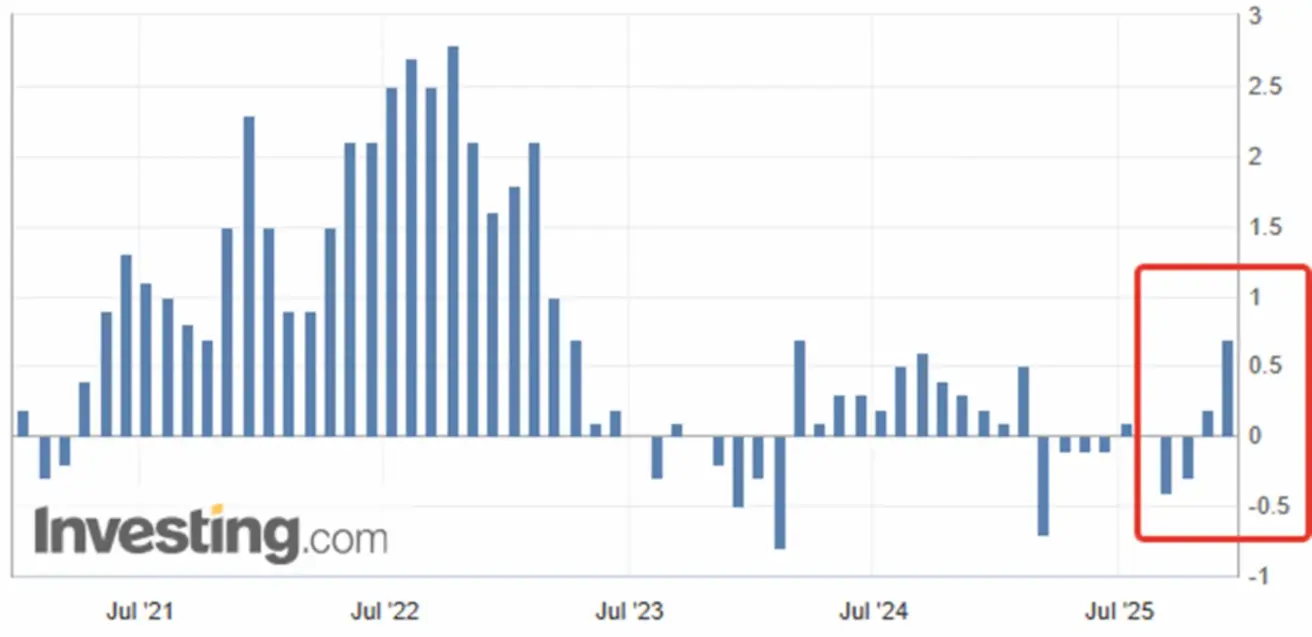
- Изменение занятости в несельскохозяйственном частном секторе (ADP, ноябрь): –32K (предыдущее: +47K)
- Изменение занятости в частном несельскохозяйственном секторе (ADP), декабрь: 4.75K (предыдущее: −13.5K)
- Средняя почасовая заработная плата (г/г): 3.8% (предыдущее: 3.8%)
- Число открытых вакансий JOLTS: — (против 7.227M)
ДЕНЕЖНО-КРЕДИТНАЯ ПОЛИТИКА
- Эффективная ставка по федеральным фондам (EFFR): 3.50%–3.75%
- Баланс Федеральной резервной системы увеличился: $6,539T (против предыдущей недели: $6,535T). ФРС: объёмы покупок активов в ближайшие месяцы будут существенными.
Макроэкономические прогнозы FOMC: повышение прогнозов по всем показателям на 2026–27 годы при сохранении прогноза по EFFR (ставке денежно‑кредитной политики) без изменений.
РЫНОЧНЫЙ ПРОГНОЗ ПО СТАВКЕ (FEDWATCH)
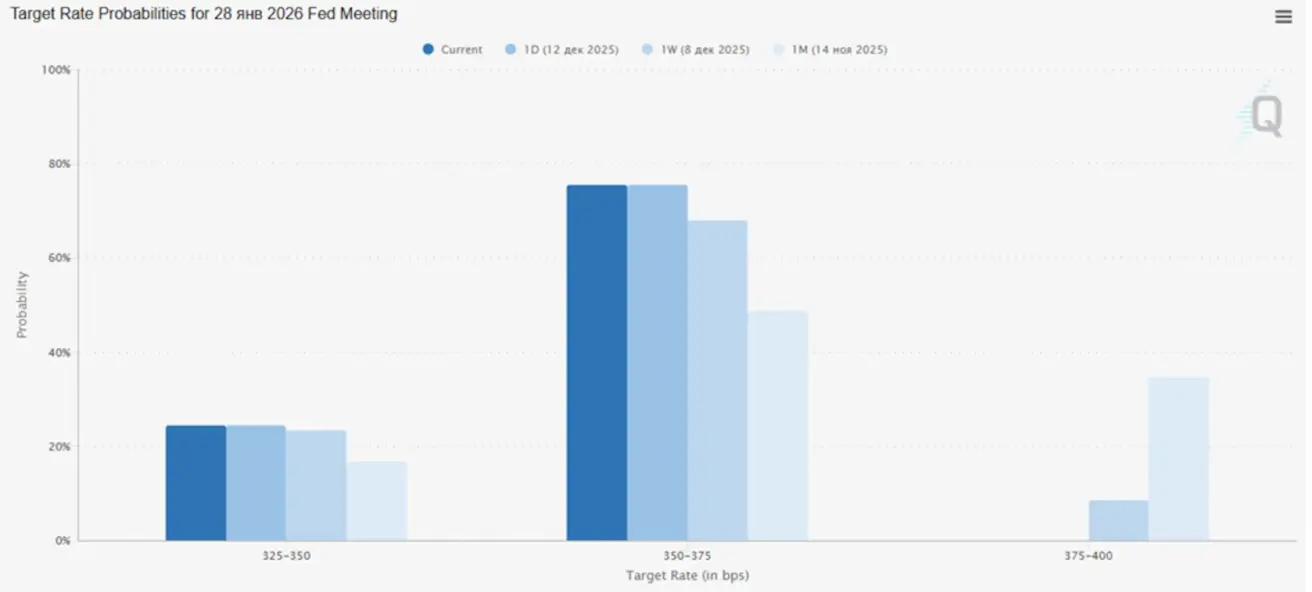
- Следующее заседание (28 января): подразумеваемая вероятность снижения ставки на 0.25% составляет 24.4%, тогда как вероятность сохранения без изменений — 75.6%.
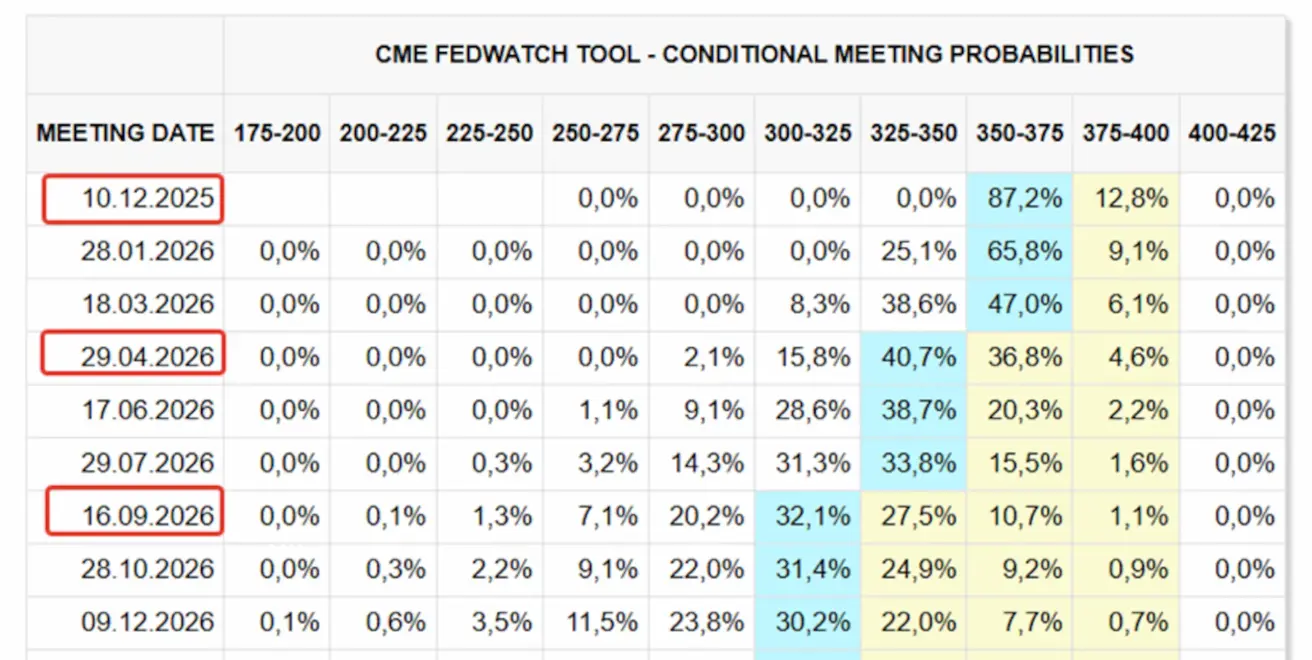
- В течение следующих 12 месяцев: ожидается два снижения ставки по 0.25%, что опустит целевой диапазон до 3.00–3.25%.
Сегодня:
Неделей ранее:
Рынок
SP500
Индекс S&P 500 приблизился к своему историческому максимуму на уровне 3,900 пунктов; за неделю он снизился на 0.63% (закрытие недели: 6,827.42). С начала 2025 года индекс вырос на 15.66%.
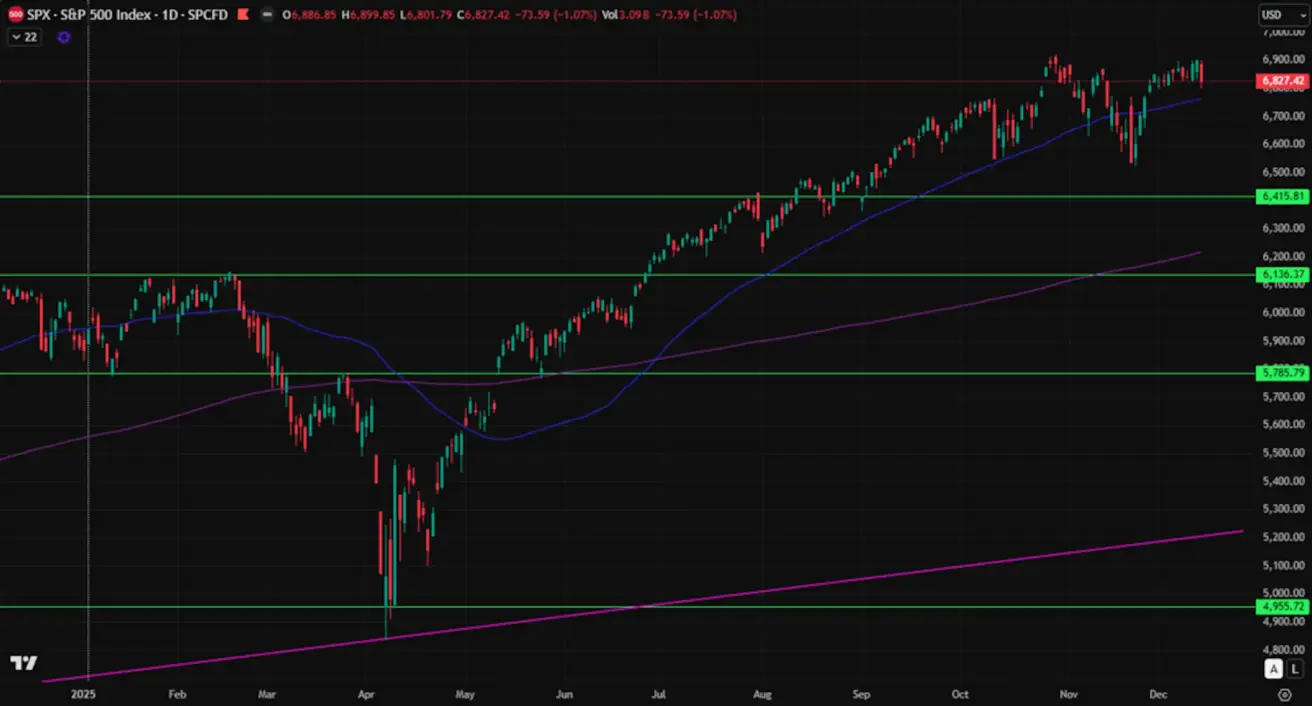
Несмотря на то что итоги заседания в целом оказались позитивными для технологического сектора, волатильность остаётся повышенной из‑за высоких оценок и прогнозов менеджмента, указывающих на сжатие маржи.
NASDAQ100
Динамика за неделю: −1.93% (закрытие недели: 25,196.73). Доходность с начала года: +19.30%.

Goldman Sachs прогнозирует, что S&P 500 достигнет 7,600 пунктов к концу 2026 года, что предполагает потенциал роста на 10% от текущих уровней.
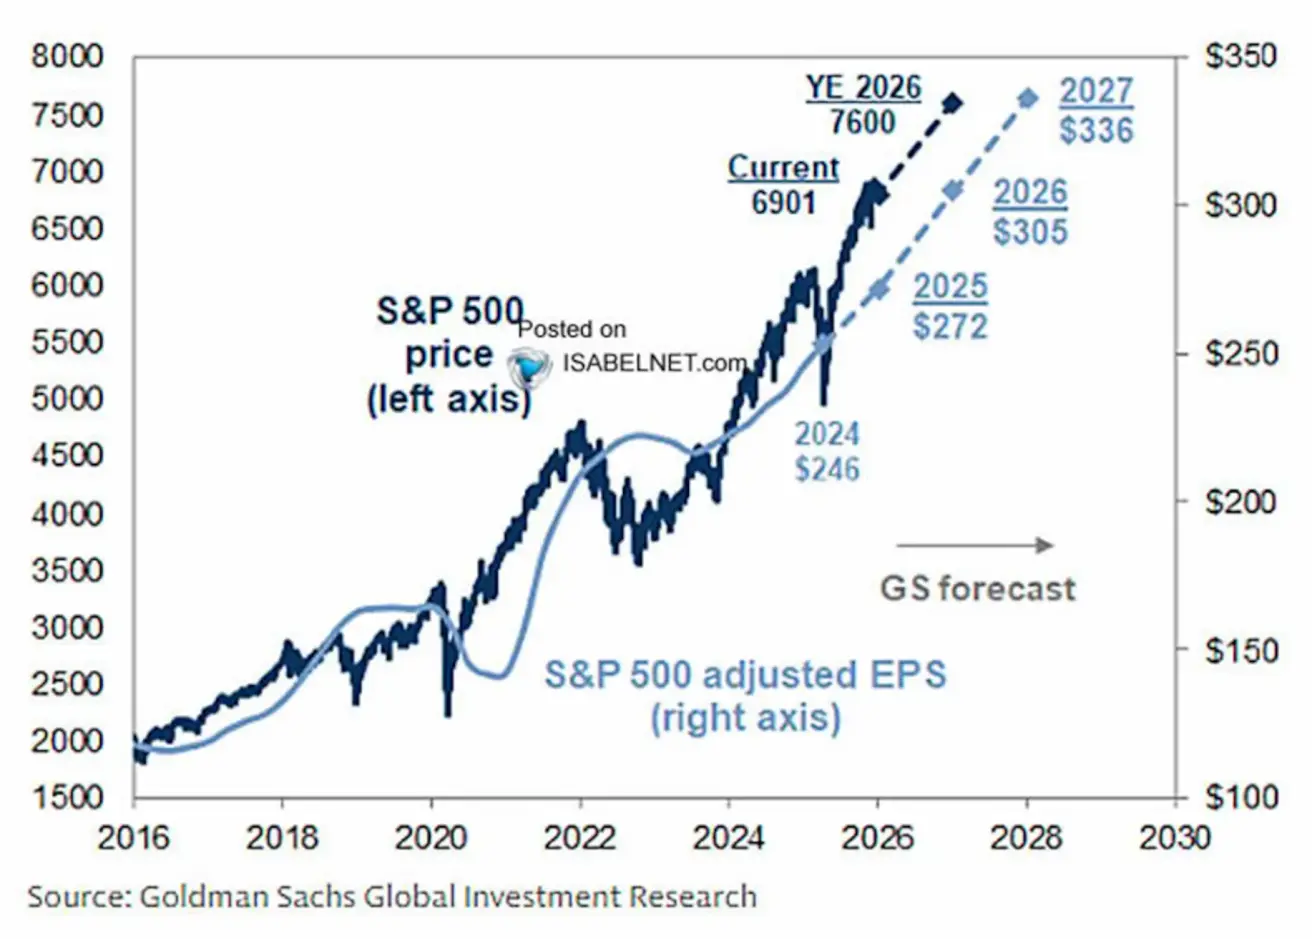
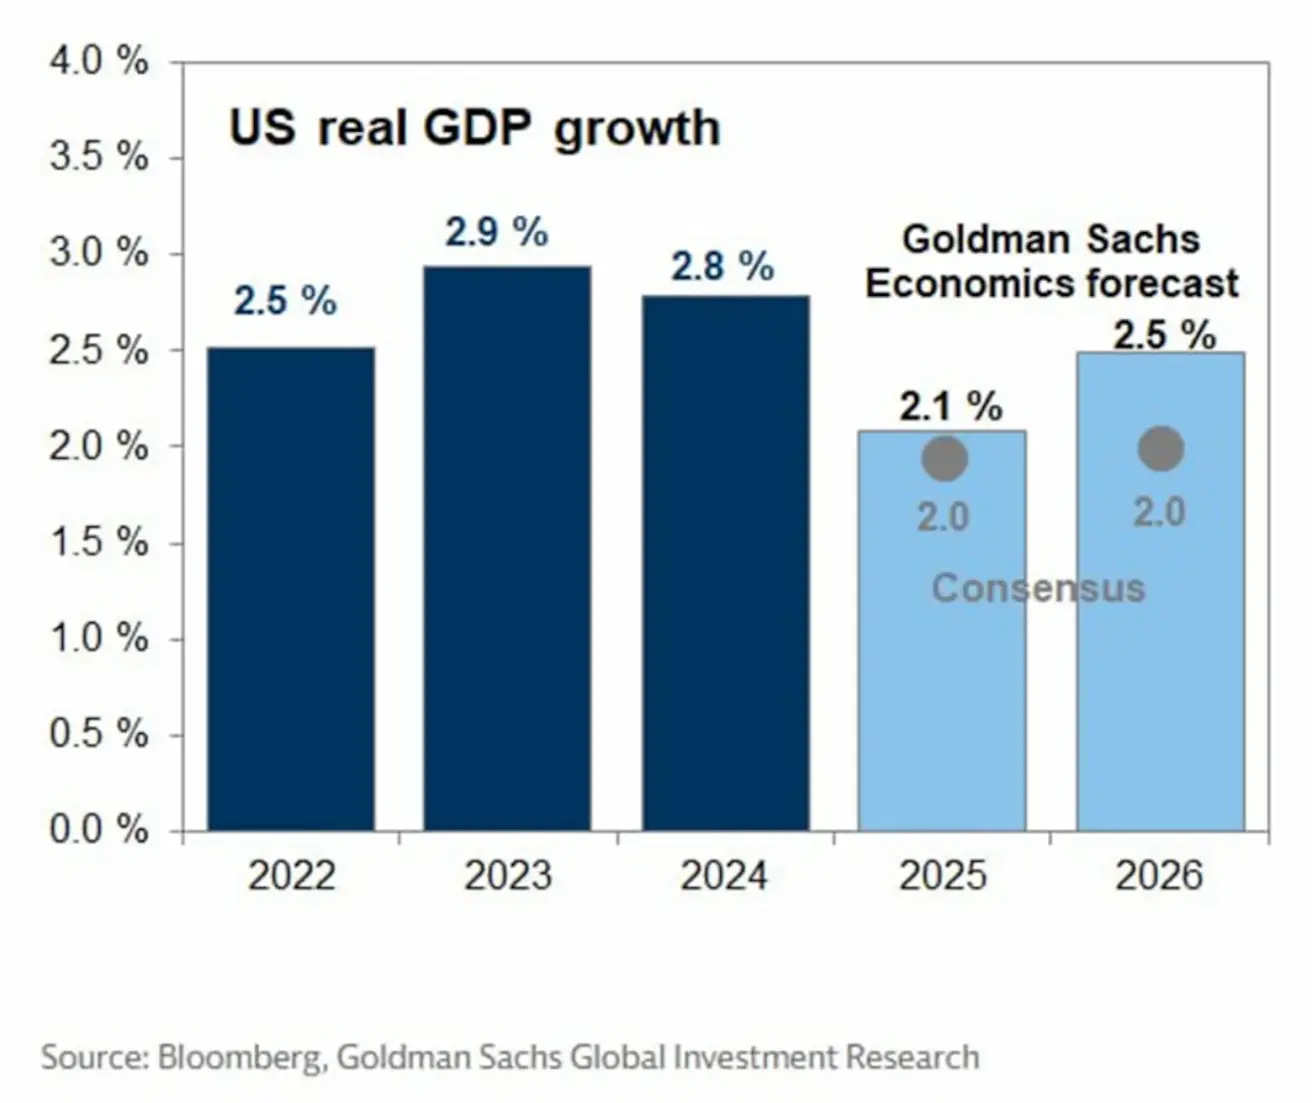
Консенсус‑прогноз по росту реального ВВП США предполагает расширение на 2.0% как в 2025, так и в 2026 году. Это соответствует прогнозу ФРС на 2027 год, но на 0.3 п.п. ниже прогноза ФРС на 2026 год.
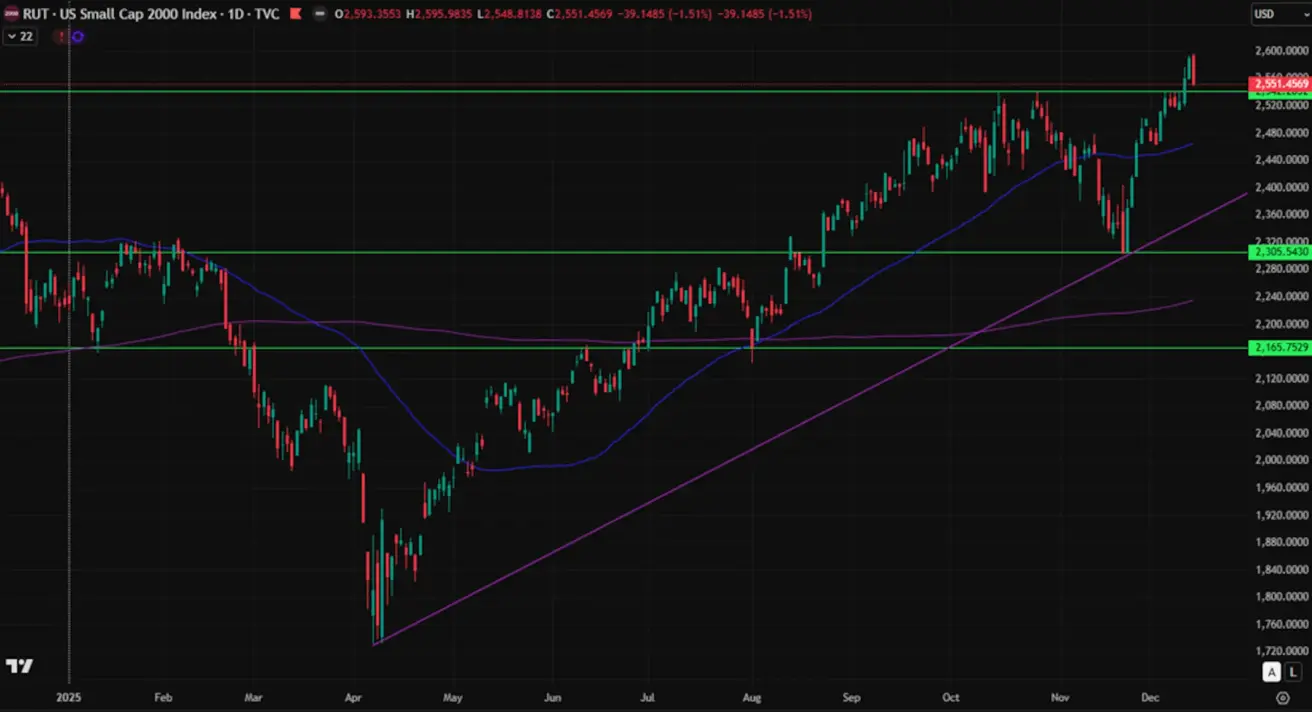
Russel 2000 (RUT)
Динамика за неделю: +1,19% (закрытие недели: 2551,45). Динамика с начала года: +13,84%.
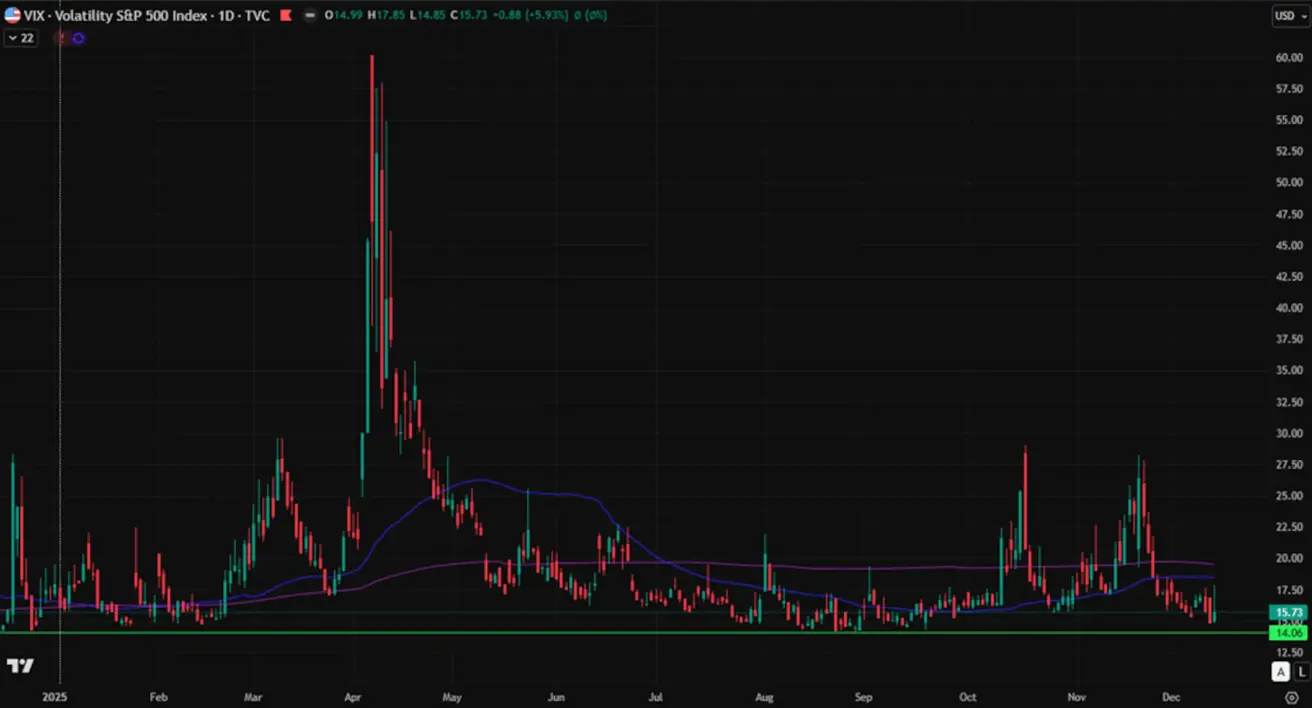
VIX
Закрытие недели на уровне 15.73
Еврозона
Процентные ставки:
- Ставка по депозитной facility: 2.0% (предыдущее: 2.0%);
- Ставка по маржинальному кредитованию: 2.4% (предыдущее: 2.4%) — ставка, по которой банки могут занимать средства у центрального банка на ночь;
- Краткосрочная (ключевая) ставка: 2.15% (предыдущее: 2.15%).
Инфляция: индекс потребительских цен (CPI), ноябрь:
- Базовый CPI (г/г): 2.4% (предыдущее: 2.4%);
- CPI (м/м): −0.3% (предыдущее: 0.2%);
- CPI (г/г): 2.2% (предыдущее: 2.1%).
ВВП, 3 кв. (окончательные данные):
- кв/кв: 0.3% (предыдущее: 0.1%);
- г/г: 1.4% (предыдущее: 1.5%).
Уровень безработицы (октябрь): 6.4% (предыдущее: 6.3%).
Индекс деловой активности (PMI), октябрь:
- Сектор услуг: 53.6 (предыдущее: 53.0);
- Обрабатывающая промышленность: 49.6 (предыдущее: 50.0);
- S&P Global Composite: 52.8 (предыдущее: 52.5).
Euro Stoxx 600
Динамика за неделю: +0,35% (неделя закрылась на уровне 580,7). С начала года: +14,85%.

Китай:
- 1Y Loan Prime Rate (среднесрочная ставка кредитования): 3.50%;
- 5Y Loan Prime Rate (пятилетняя ставка, влияющая на ипотечные кредиты): 3.50%.
Индикаторы инфляции (октябрь):
- Индекс потребительских цен (CPI, м/м): −0.1% (предыдущее: 0.2%);
- CPI (г/г): 0.7% (предыдущее: 0.2%).
- Уровень безработицы (октябрь): 5.1% (предыдущее: 5.2%);
- Промышленное производство (октябрь, г/г): 4.9% (против 6.5%);
- Инвестиции в основные средства (октябрь, г/г): −1.7% (против −0.5%);
- Импорт (декабрь, г/г): 1.9% (против 1.0%);
- Экспорт (декабрь, г/г): 5.9% (против −1.1%);
- Сальдо внешней торговли (декабрь): $111.68 bn (против $90.7 bn).
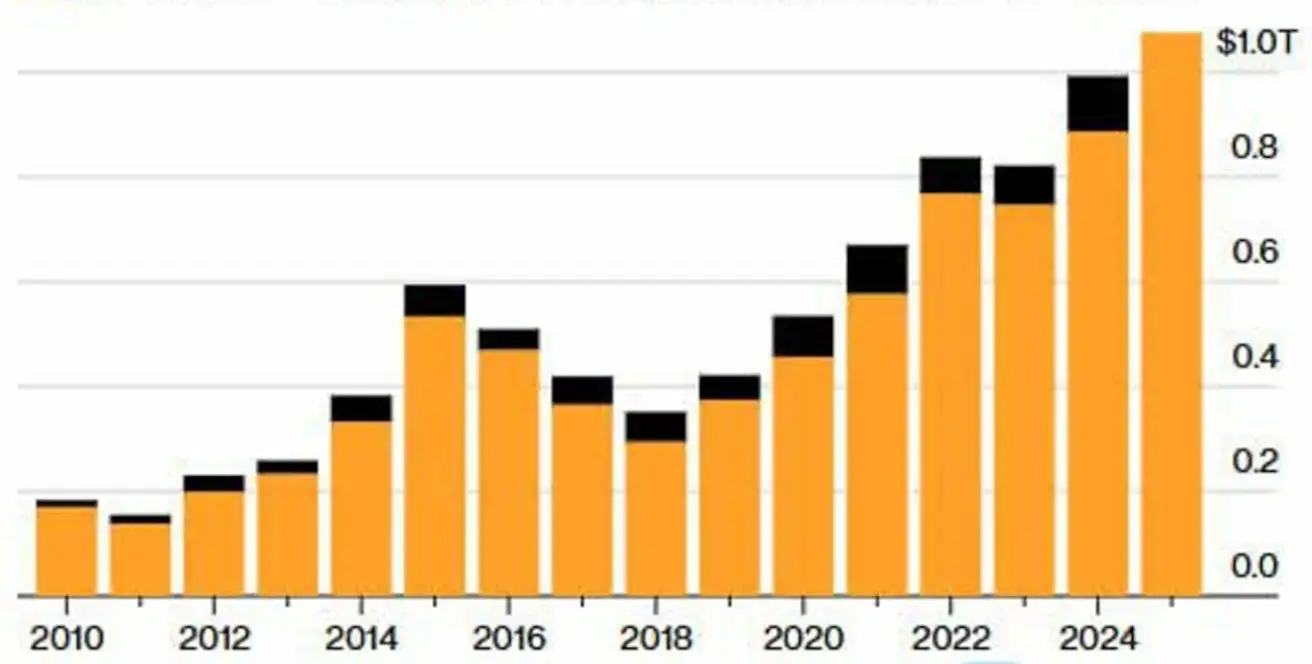 Профицит торгового баланса за январь–ноябрь (выделен жёлтым) и декабрь (чёрным).
Экспорт Китая в ноябре вырос на 5.9% г/г, что позволило совокупному годовому объёму экспорта превысить отметку в $1 трлн. Поставки в США снизились на 29% из‑за тарифов, однако более сильный экспорт в ЕС, Латинскую Америку и Африку более чем компенсировал это снижение. Экспорт в ЕС увеличился почти на 15%, тогда как поставки в Африку выросли почти на 28%.
Индексы деловой активности (PMI), ноябрь:
- Обрабатывающая промышленность: 49.2 (предыдущее: 49.0);
- Непроизводственный сектор: 49.0 (предыдущее: 49.0);
- Композитный PMI: 49.5 (предыдущее: 50.1).
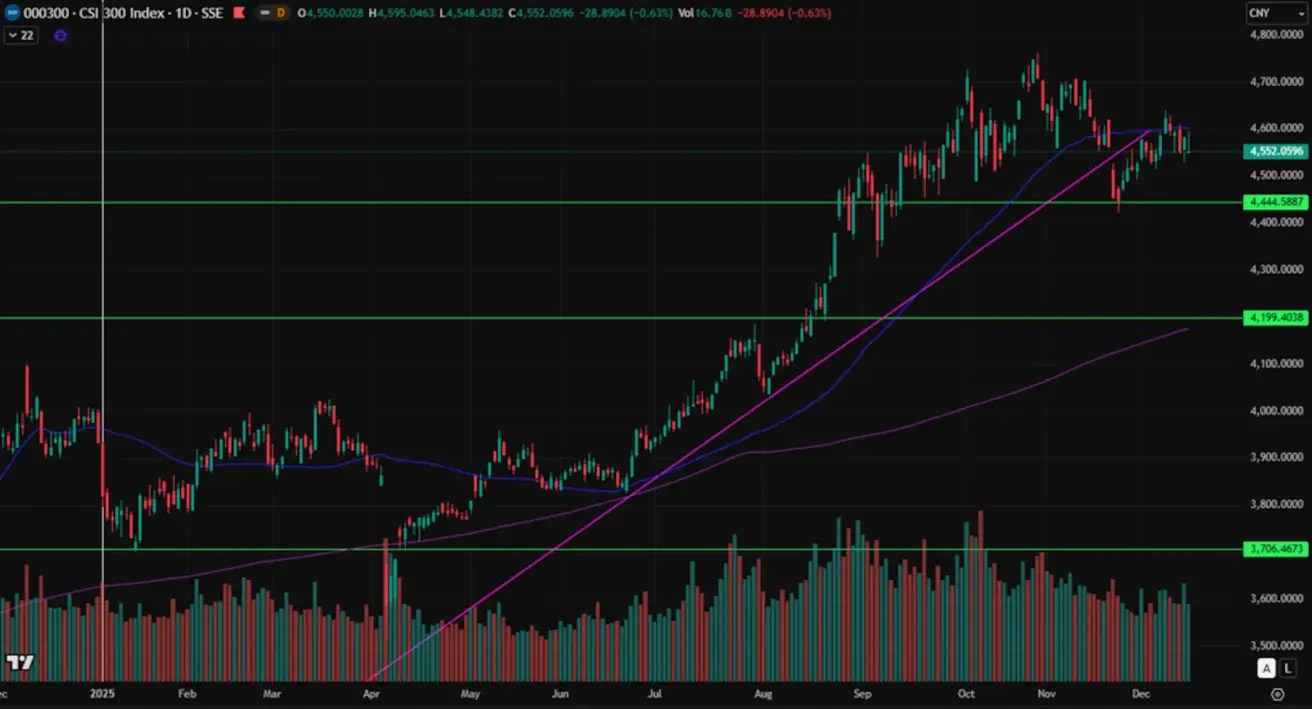
Индекс CSI 300
Динамика за неделю: −0.08% (закрытие недели: 4,580.95); динамика с начала года: +16.53%.
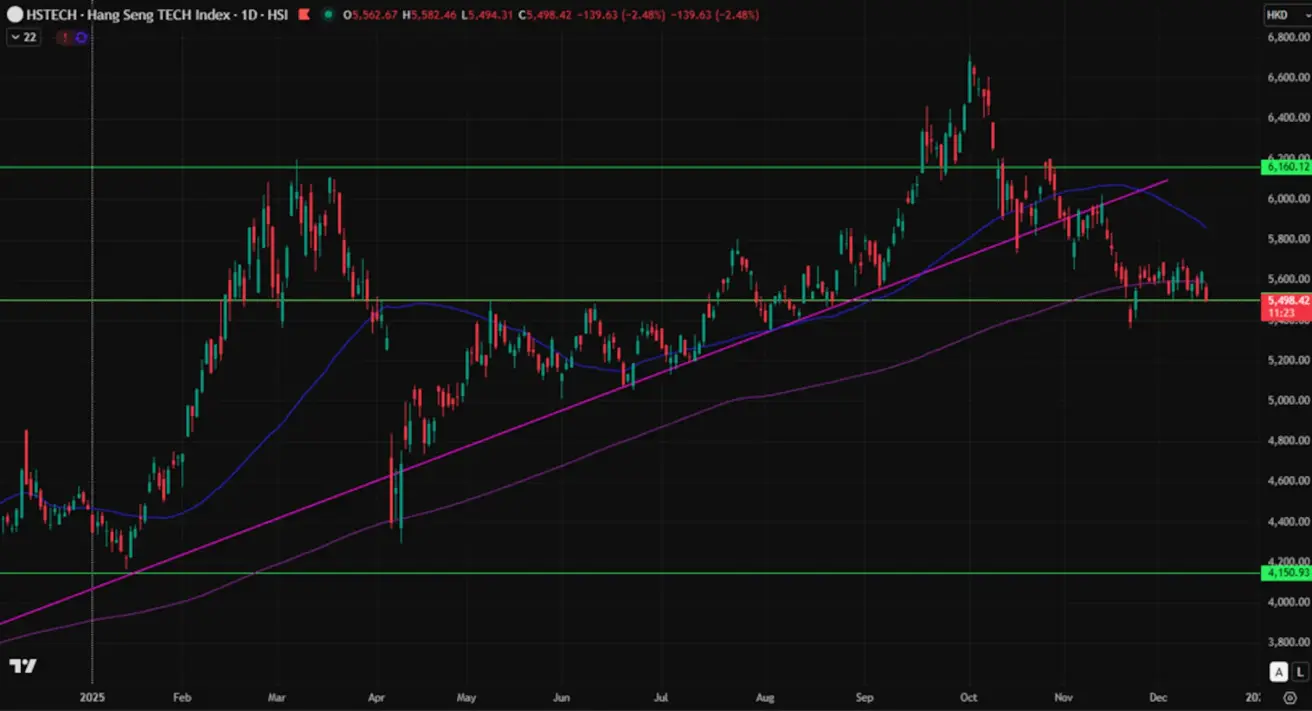
Индекс Hang Seng TECH (HSTECH.HK)
Динамика за неделю: −0.43% (закрытие недели: 5,638.05); динамика с начала года: +27.08%.
РЫНОК ОБЛИГАЦИЙ – доходности долгосрочных казначейских бумаг США выросли
20+ летние казначейские облигации США (ETF TLT): за неделю: −0.94% (закрытие недели: 87.34). За 2025 год: −0.52%.

Доходности и спрэды
- Рыночная доходность 10‑летних казначейских бумаг США (постоянная дюрация 10 лет): 4.18% (против 4.14%);
- Доходность 2‑летних казначейских бумаг: 3.51% (против 3.56%);
- Эффективная доходность индекса ICE BofA BBB U.S. Corporate Index: 5.02% (против 5.02%).
- Спред доходности между 10‑летними и 2‑летними казначейскими бумагами США: 67 б.п. (против 58 б.п.);
- Спред доходности между 10‑летними и 3‑месячными казначейскими бумагами США: 54 б.п. (против 43 б.п.).

Стоимость 5‑летнего кредитного дефолтного свопа (CDS) на США, выступающего индикатором стоимости страхования от дефолта, составляет 27.88 б.п. (против 28.78 б.п. неделей ранее).
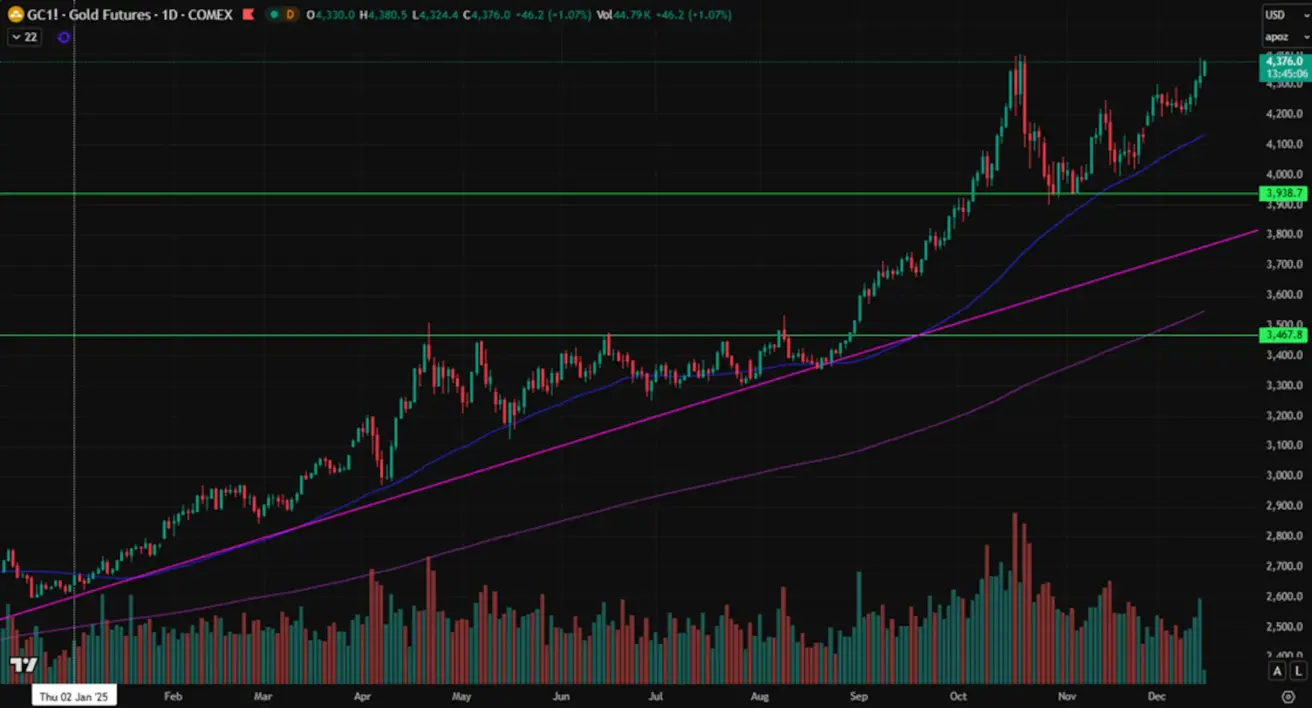
ФЬЮЧЕРСЫ НА ЗОЛОТО (GC)
Динамика за неделю: +2.42% (закрытие недели: $4,329.8 за тройскую унцию). Рост с начала года: +63.95%.
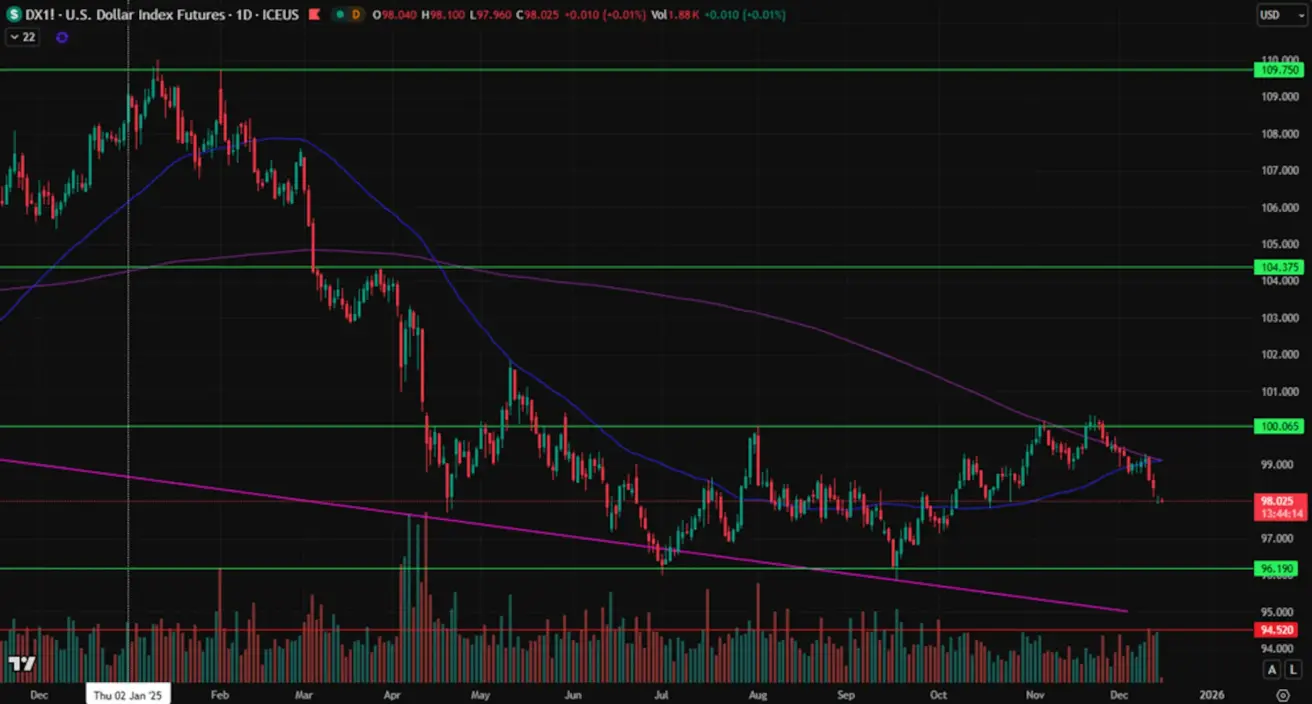
ФЬЮЧЕРСЫ НА ИНДЕКС ДОЛЛАРА (DX)
Динамика за неделю: −0.99%; закрытие недели: 98.015; за 2025 год: −9.52%.
ФЬЮЧЕРСЫ НА НЕФТЬ
Динамика за неделю: -4.34% (закрытие недели: $57.53 за баррель). Динамика с начала года: −19.93%.

- Ожидается, что мировой спрос на нефть в 2025 году увеличится на 830 тыс. барр./сутки (против 790 тыс. барр./сутки), чему способствуют улучшающиеся макроэкономические и торговые перспективы;
- В 2026 году рост спроса прогнозируется на уровне 860 тыс. барр./сутки (против 770 тыс. барр./сутки ранее).
Криптовалюты
Народный банк Китая ввёл запрет на цифровые активы, объявив виртуальные валюты — включая стейблкоины — незаконными и запретив их использование в качестве средства платежа.
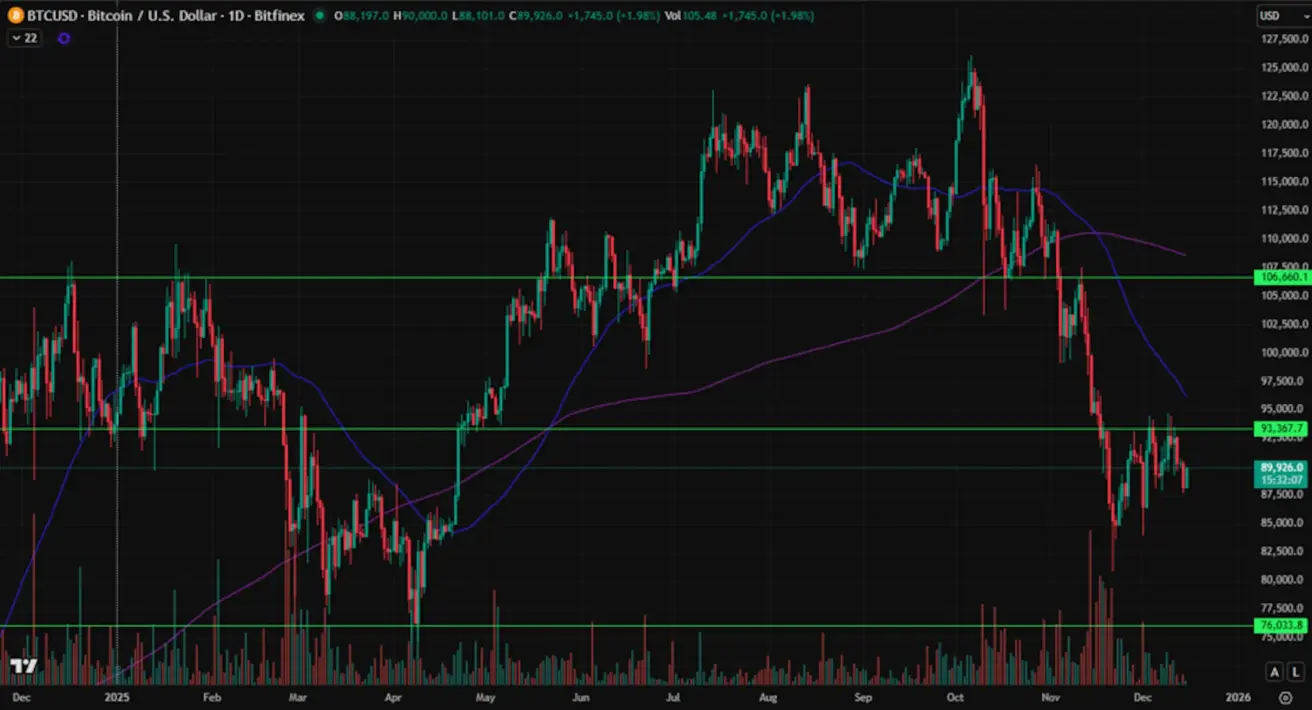
ФЬЮЧЕРСЫ НА BTC
Динамика за неделю: −2.53% (закрытие недели: $88,181). Динамика с начала года: −5.95%.
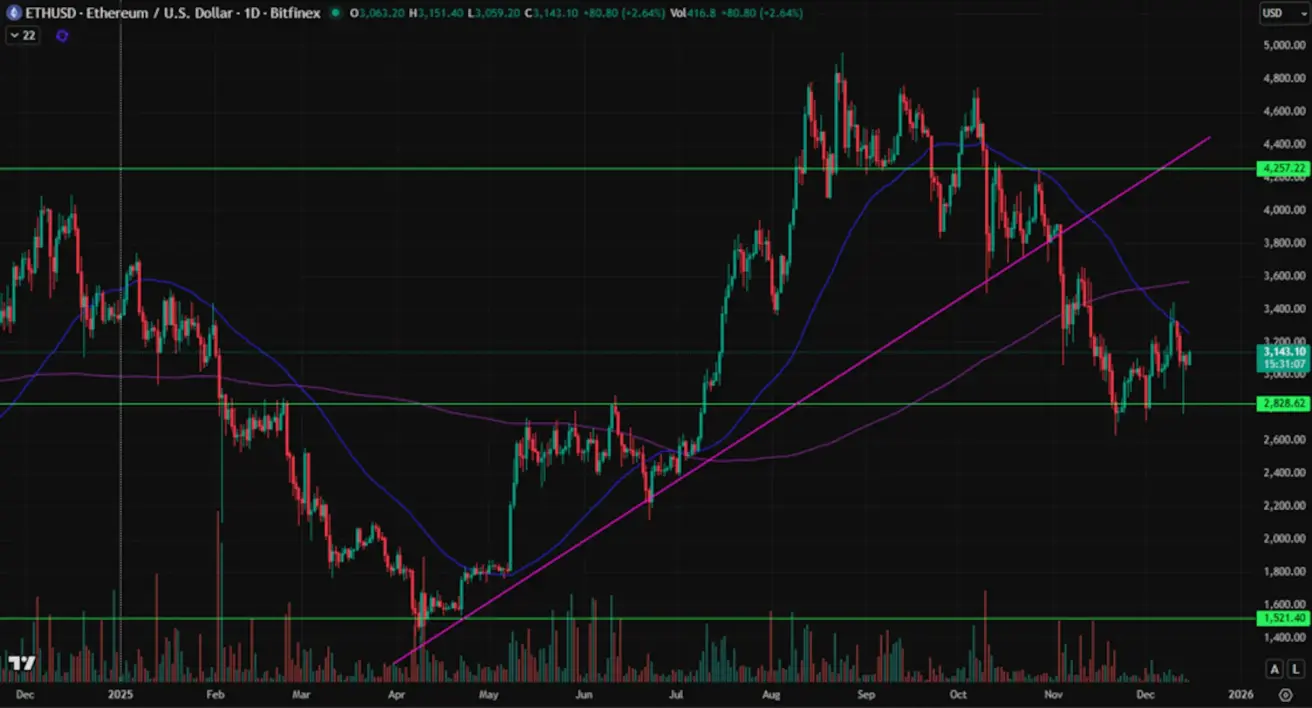
ФЬЮЧЕРСЫ НА ETH
Динамика за неделю: +0.01% (закрытие недели: $3,062.3). Динамика с начала года: −8.43%.
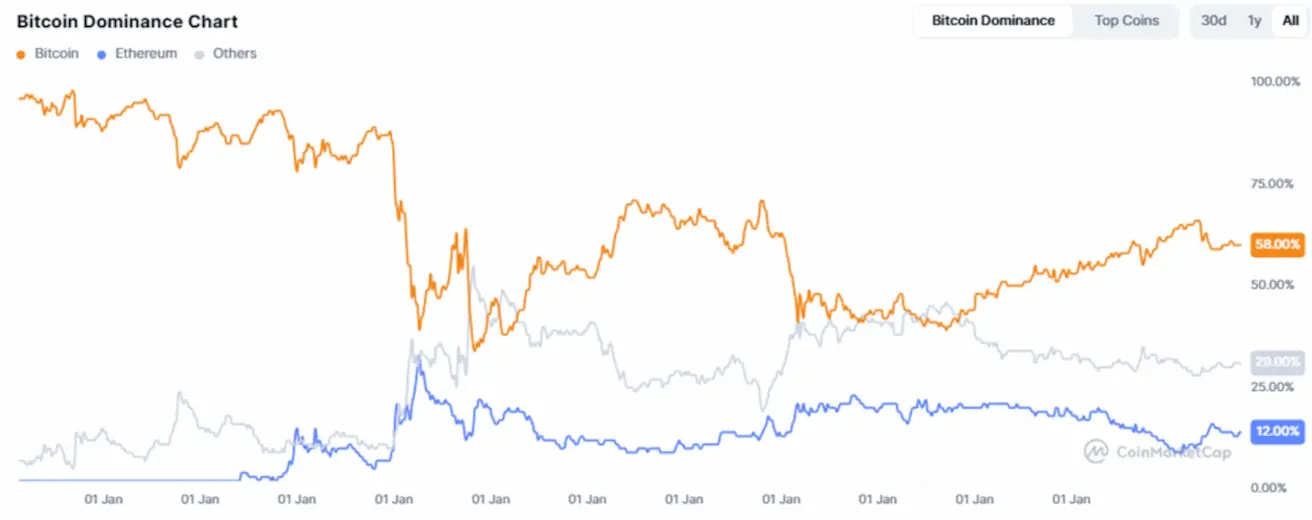
Совокупная рыночная капитализация криптовалют составляет $3.06 трлн (против $3.11 трлн неделей ранее), по данным CoinMarketCap.
Доли рынка криптовалют:
- Bitcoin: 58.6% (58.7%);
- Ethereum: 12.4% (12.1%);
- Прочие: 29.0% (29.7%).
Публичные компании с казначейскими стратегиями в Bitcoin: доля Bitcoin, удерживаемая на балансах корпораций, сейчас составляет 5.30% от общего предложения Bitcoin, по сравнению с 5.02% неделей ранее.
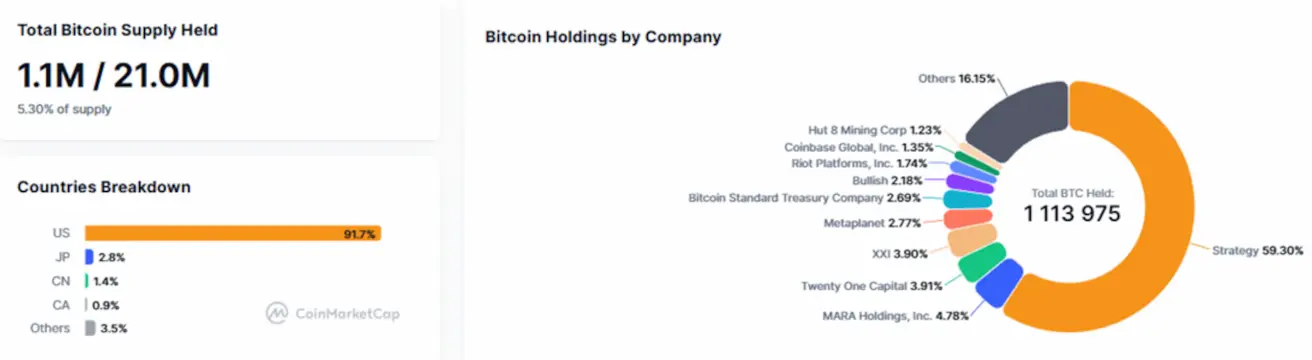
График чистых потоков в ETF:
