English
 Lietuvių
 Қазақша
 Eesti
Eesti19–25 января 2026 года: Еженедельный экономический обзор
Ключевые обновления рынка

За прошедшую неделю фондовые индексы продемонстрировали в целом нейтральную динамику на фоне ослабления геополитической напряженности и торговых споров.
Переходя к Всемирному экономическому форуму в Давосе, президент Трамп заявил, что не намерен добиваться приобретения Гренландии силой и отозвал предложенные тарифы в отношении европейских стран, сославшись на достижение рамочного соглашения с НАТО по будущему устройству, включающему Гренландию. В ответ Европейский союз также приостановил введение ответных тарифов.
Что касается экономической повестки в Давосе, основной тезис был явно подтвержден: инвестиции в цифровизацию, инфраструктуру искусственного интеллекта и передовые технологии остаются ключевыми драйверами следующей волны глобального экономического роста. Однако обсуждения среди участников подчеркнули растущий разрыв между ожиданиями и фактическими результатами. Генеральный директор NVIDIA отметил, что создание глобальной инфраструктуры искусственного интеллекта потребует инвестиций в несколько триллионов долларов.
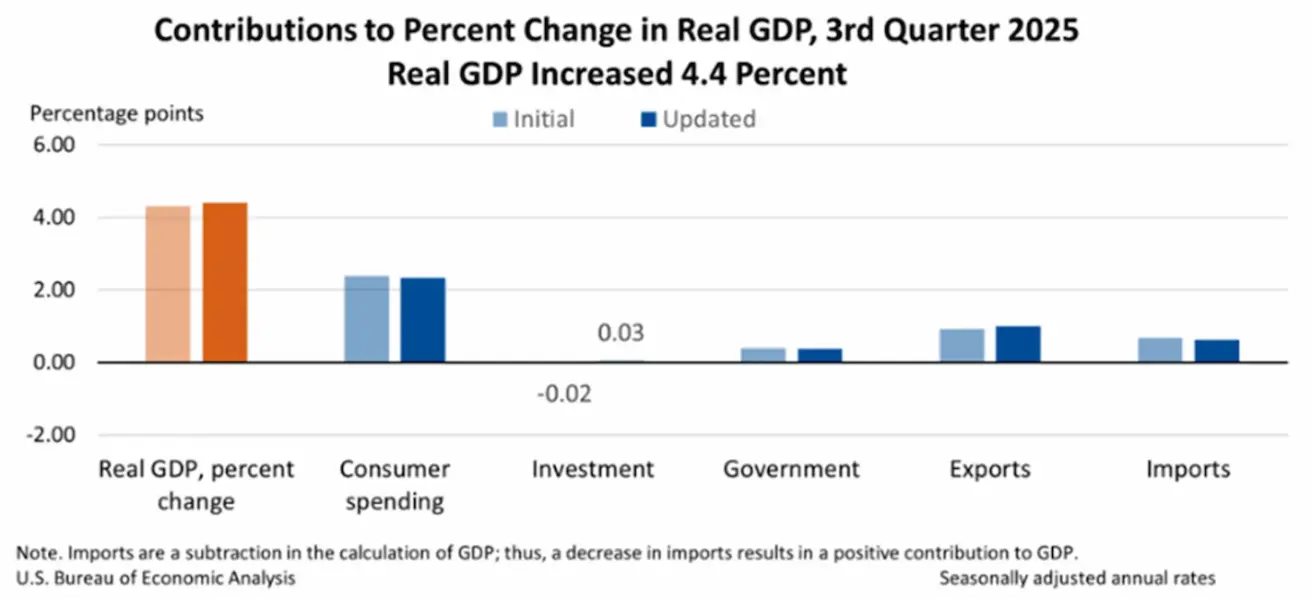
На внутреннем рынке макроэкономические данные США оказались сильнее ожиданий. Оценка ВВП за третий квартал была пересмотрена в сторону повышения до 4,4%, что отражает рост потребительских расходов (2,34%), экспорта (1,62%), государственных расходов (0,38%) и капитальных вложений (0,03%).
Число первичных и повторных заявок на пособие по безработице осталось практически без изменений. Инфляция, измеряемая индексом расходов на личное потребление (PCE) — предпочтительным индикатором инфляции Федеральной резервной системы — совпала с ожиданиями и осталась на уровне предыдущего значения: 0,2% в месячном выражении и 2,8% в годовом.
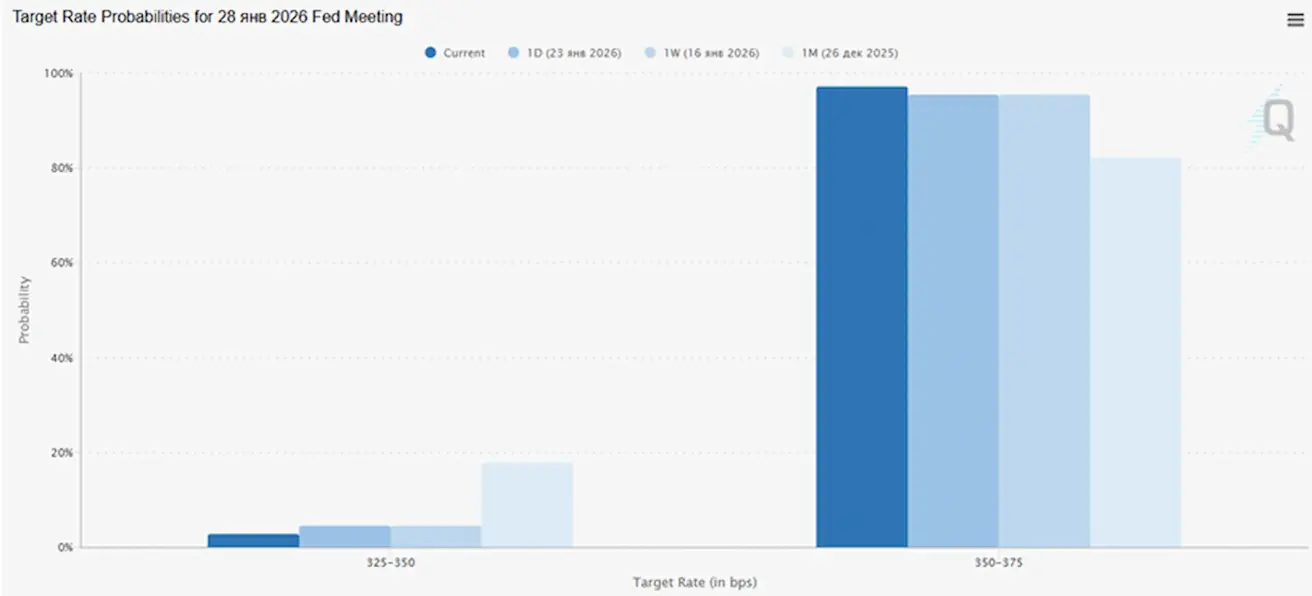
В преддверии ближайшего заседания Федеральной резервной системы 28 января подразумеваемая вероятность снижения ставки на 25 базисных пунктов составляет всего 2,77%.
В выходные вероятность приостановки работы правительства США 31 января выросла с 9% до 74%.
Макроэкономическая статистика
ИНФЛЯЦИЯ: ИНДЕКС ПОТРЕБИТЕЛЬСКИХ ЦЕН (СЕНТЯБРЬ):
- Базовый ИПЦ: (м/м) 0,2% (предыдущее: 0,2%); (г/г) 2,6% (предыдущее: 2,6%)
- ИПЦ: (м/м) 0,3% (предыдущее: 0,3%); (г/г) 2,7% (предыдущее: 2,7%).
ИНДЕКС ЦЕН ПРОИЗВОДИТЕЛЕЙ (НОЯБРЬ):
- ИПП (м/м): 0,2%, предыдущее: 0,6%
- Базовый ИПП (м/м): 0,3%, предыдущее: 0,1%.
ИНФЛЯЦИОННЫЕ ОЖИДАНИЯ (МИЧИГАН) (ДЕКАБРЬ):
- 12-месячные инфляционные ожидания: 4,2%, предыдущее: 4,1%
- 5-летние инфляционные ожидания: 3,4%, предыдущее: 3,2%.
ВВП (Бюро экономического анализа США, BEA) (3 квартал 2025 г., в годовом выражении, вторая оценка): +4,4% (2 квартал 2025 г.: +3,8%)
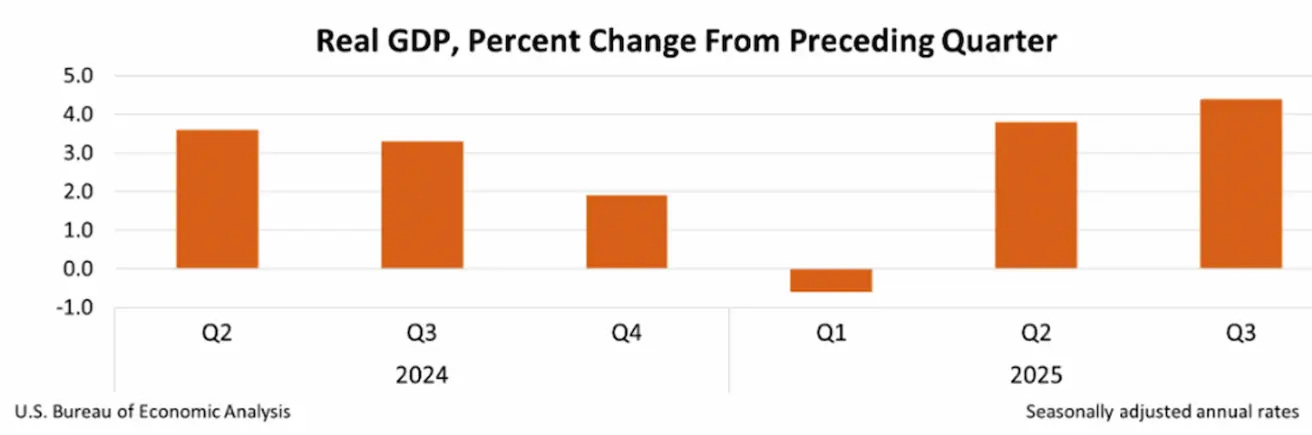
Индикатор GDPNow Федерального резервного банка Атланты (4 квартал): 5,4% (предыдущее: 5,3%).
ИНДЕКС ДЕЛОВОЙ АКТИВНОСТИ (PMI) (ДЕКАБРЬ):
(Значение выше 50 указывает на расширение; ниже 50 — на сокращение)
- Сектор услуг: 52,5 (предыдущее: 52,5);
- Промышленный сектор: 51,9 (предыдущее: 51,8);
- S&P Global Composite: 52,8 (предыдущее: 52,7).
РЫНОК ТРУДА (BLS) (Декабрь)
- Уровень безработицы: 4,4% (предыдущее: 4,6%);
- Общее число получателей пособий по безработице в США: 1 875 тыс. (предыдущее: 1 884 тыс., пересмотрено);
- Первичные заявки на пособие по безработице: 200 тыс. (предыдущее: 198 тыс.);
- Изменение числа рабочих мест вне сельского хозяйства: 37 тыс. (предыдущее: 64 тыс.);
- Изменение числа частных рабочих мест вне сельского хозяйства: 37 тыс. (предыдущее: 69 тыс.);
- Средний рост почасовой оплаты труда (г/г): 3,8% (предыдущее: 3,5%);
- Количество открытых вакансий (JOLTS): 7,146 млн (предыдущее: 7,227 млн).
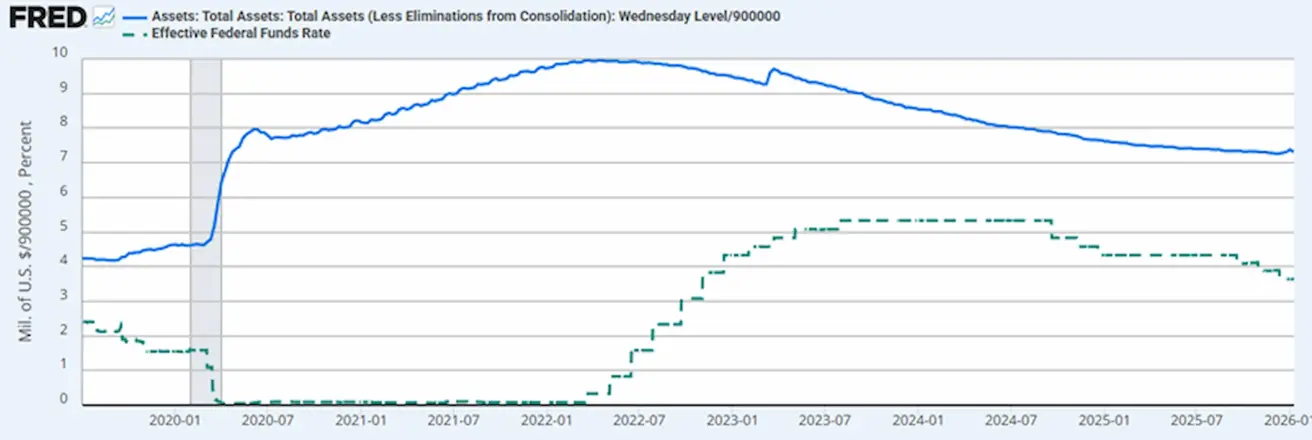
ДЕНЕЖНО-КРЕДИТНАЯ ПОЛИТИКА
- Эффективная ставка по федеральным фондам (EFFR): 3,50%–3,75%;
- Баланс Федеральной резервной системы: $6,584 трлн, +0,76% с момента приостановки количественного ужесточения ($6,535 трлн).
ПРОГНОЗ РЫНКА ПО СТАВКЕ (FEDWATCH)
В преддверии ближайшего заседания (28 января) подразумеваемая вероятность снижения ставки на 25 базисных пунктов составляет 2,77%.
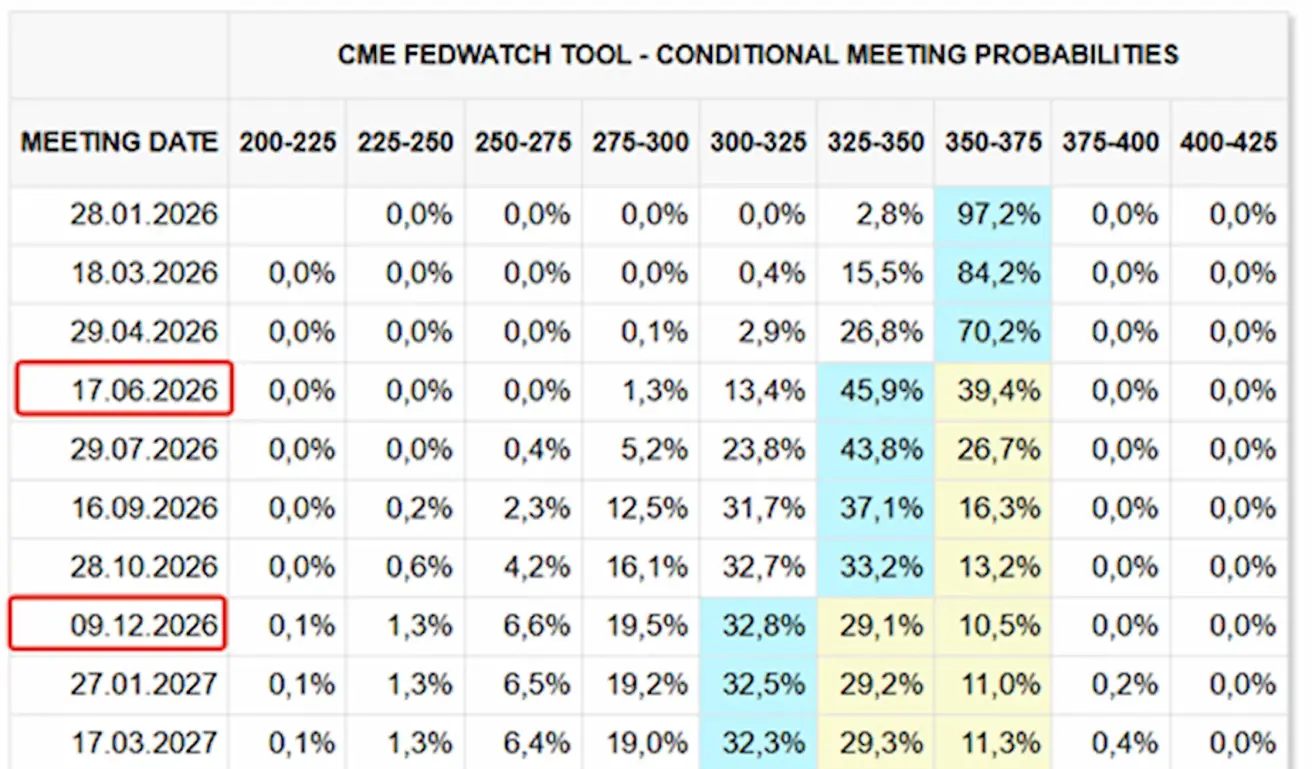
12-месячный прогноз: рынок закладывает два снижения ставки на 25 б.п., что приведет к диапазону ключевой ставки 3,00–3,25%. Первое снижение ожидается в июле, после трех заседаний FOMC.
Сегодня:
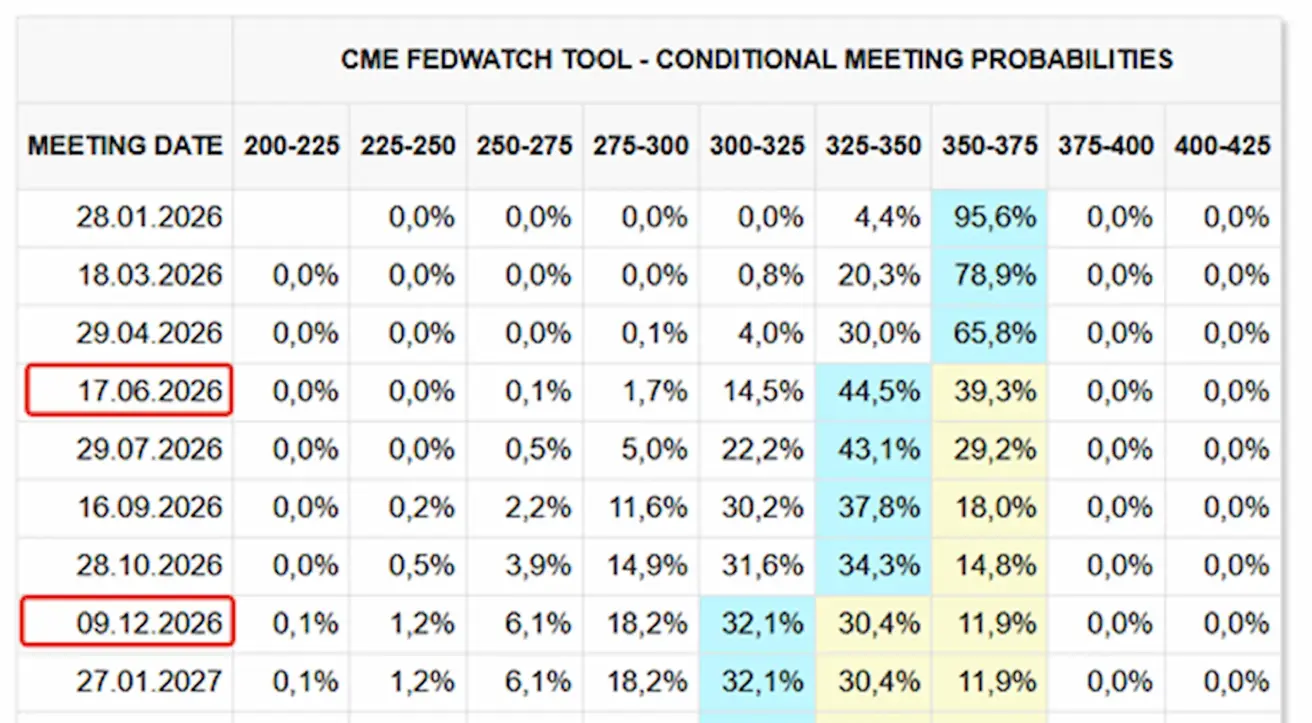
Неделей ранее:
Рынок
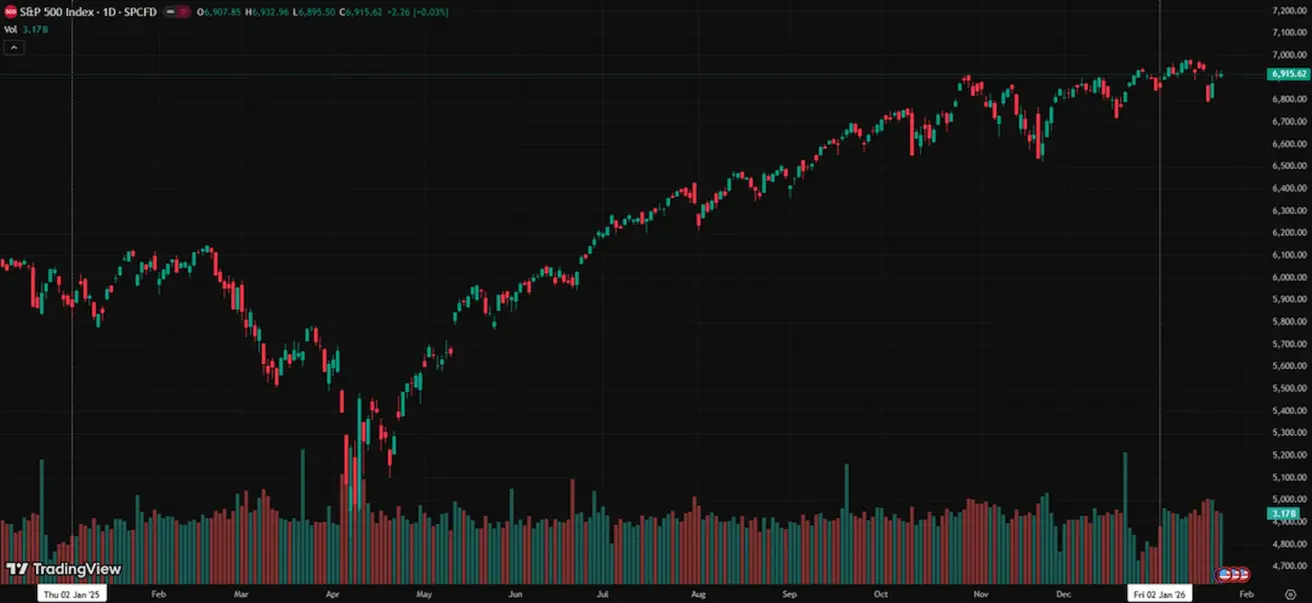
SP500
Динамика за неделю: −0,35% (закрытие недели на уровне 6915,62); с начала года: +1,02%.
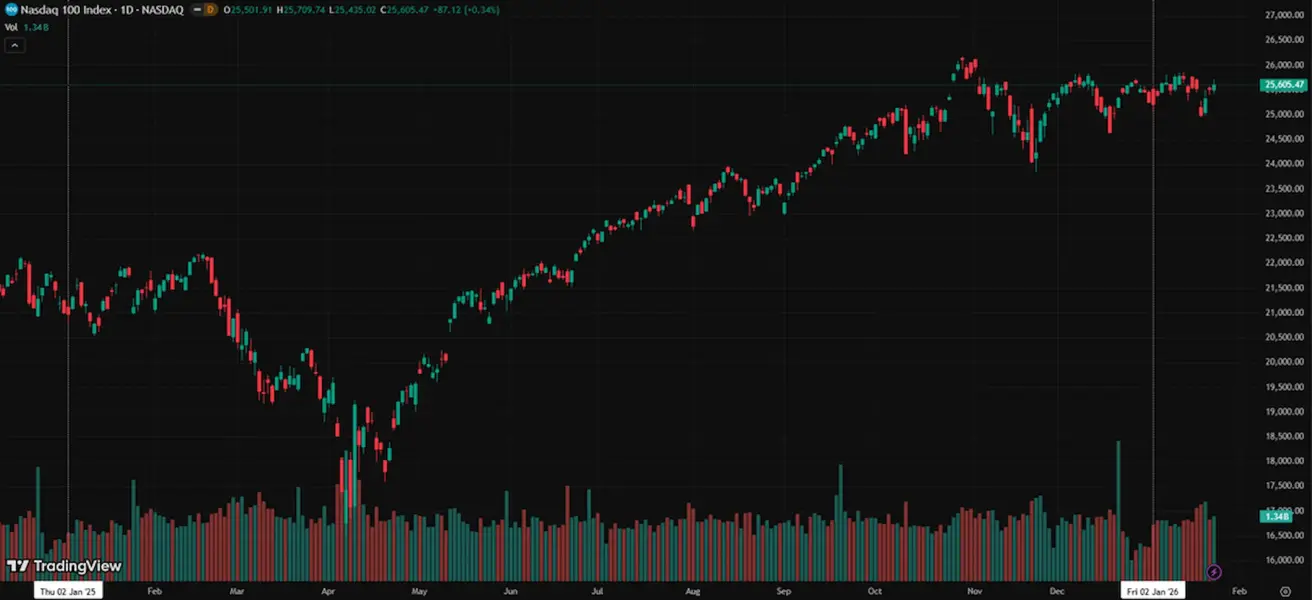
NASDAQ100
Динамика за неделю: +0,3% (закрытие недели на уровне 25605,47); с начала года: +1,41%.
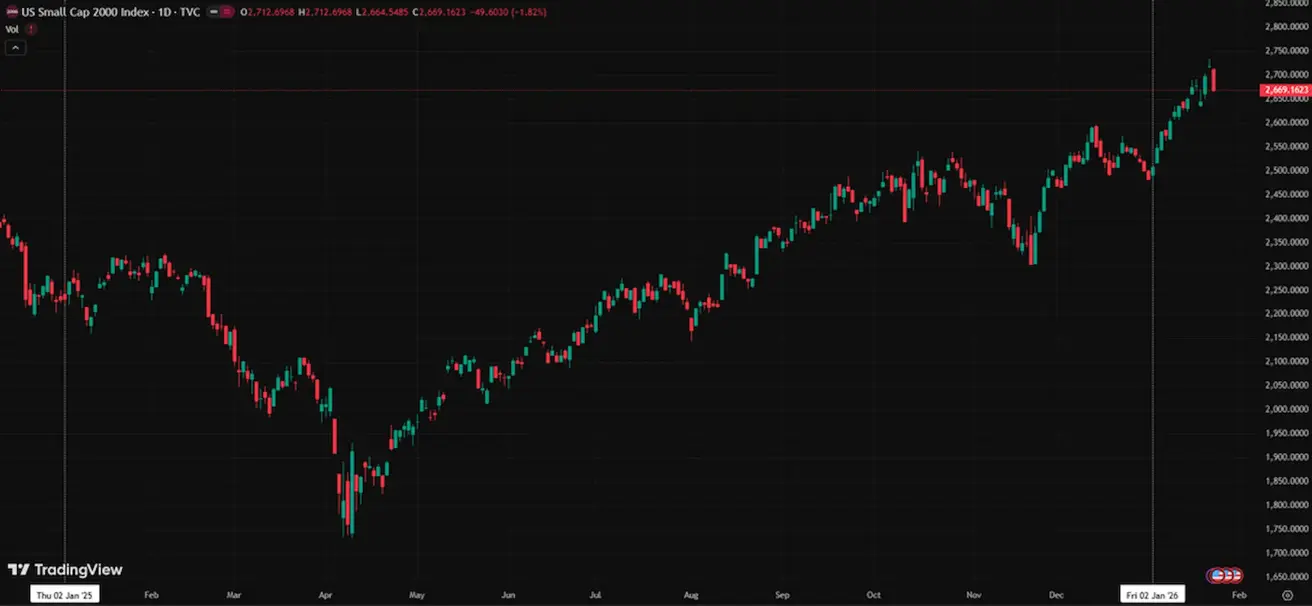
RUSSEL 2000 (RUT)
Динамика за неделю: -0,32% (закрытие недели на уровне 2669,16); с начала года: +7,54%.
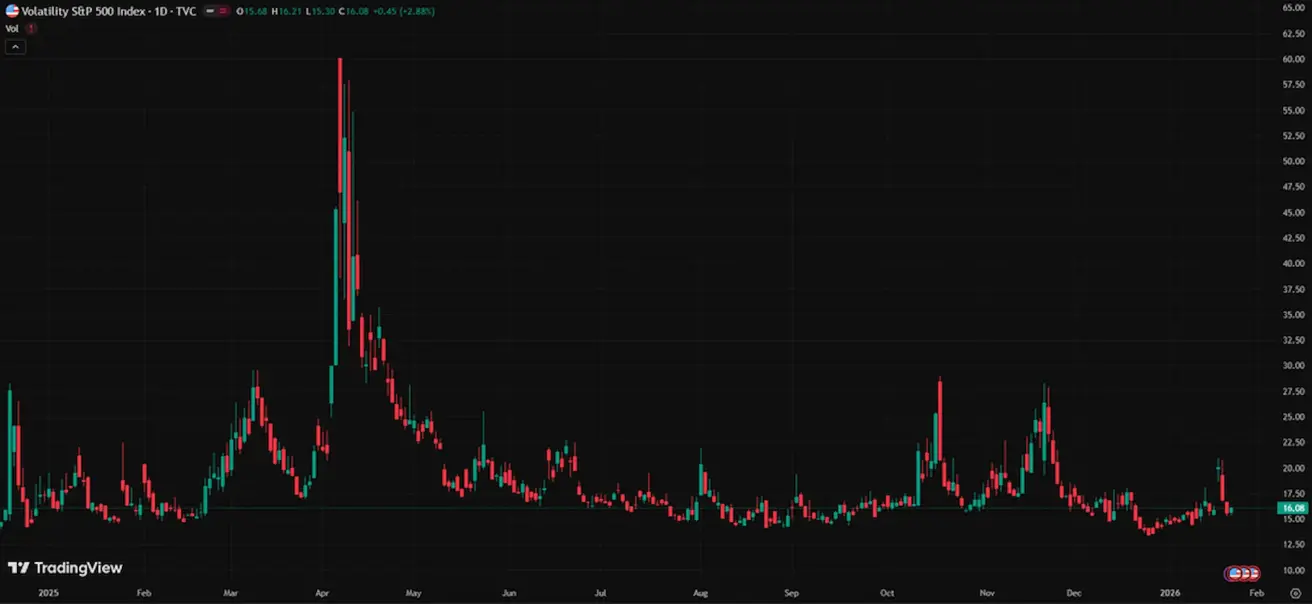
VIX
Индекс волатильности VIX составляет 16,08.
Еврозона
- Ключевые ставки остались без изменений; инфляция под контролем.
- Денежно-кредитная политика нейтральна; однако баланс рисков смещается от инфляции к экономической слабости.
- На фоне ослабления торговых споров ЕЦБ повысил прогнозы по ВВП и инфляции на ближайшие годы.
- В этих условиях Европа стабилизируется, но по темпам роста по-прежнему отстает от США.
Процентные ставки
- Ставка по депозитным операциям: 2,0% (ранее 2,0%).
- Ставка по маржинальным кредитам: 2,4% (ранее 2,4%), ставка овернайт.
- Краткосрочная (ключевая) ставка: 2,15% (ранее 2,15%).
Инфляция: индекс потребительских цен (CPI), декабрь
- Базовый ИПЦ (г/г): 2,3% (ранее 2,4%).
- Общий ИПЦ: 0,2% м/м (ранее -0,3%); 1,9% г/г (ранее 2,1%).
ВВП, 3 квартал (окончательные данные)
- Квартал к кварталу: 0,3% (ранее 0,1%).
- Год к году: 1,4% (ранее 1,5%).
Уровень безработицы (декабрь): 6,23% (ранее 6,4%).
Индекс деловой активности (PMI), январь
- Сфера услуг: 51,9 (ранее 52,4).
- Промышленность: 49,4 (ранее 48,8).
- S&P Global Composite PMI: 51,5 (без изменений).
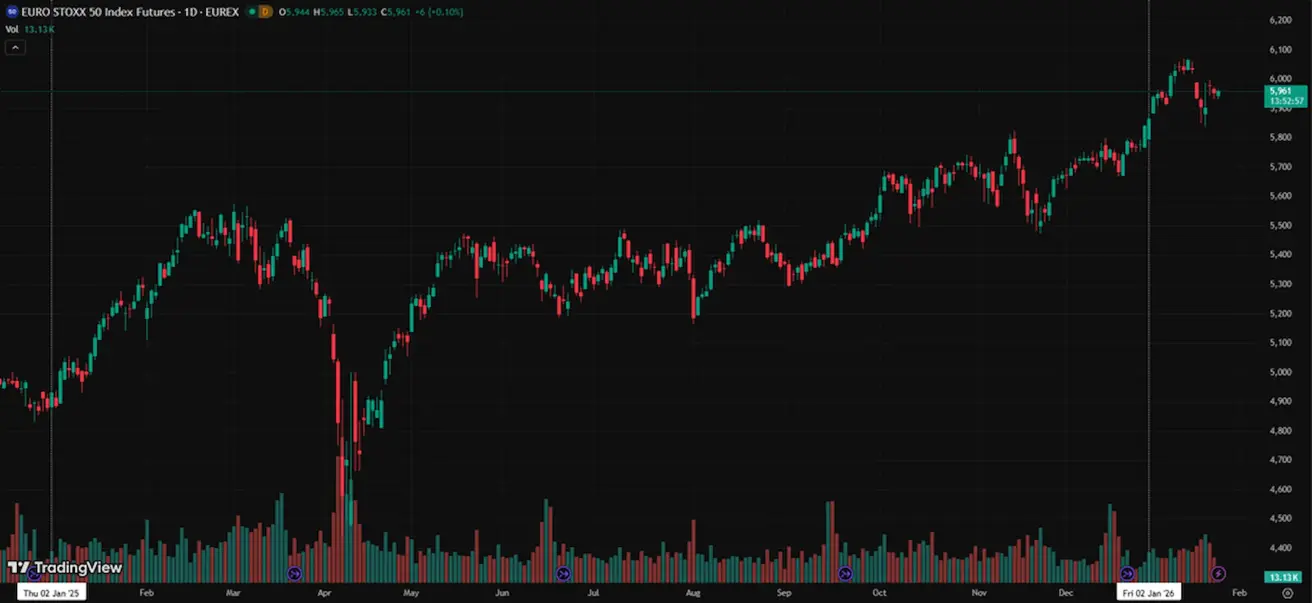
EURO STOXX 600
Динамика за неделю: -1,24%; с начала года: +2,50%.
Китай
Экономическая стабилизация в основном обеспечивается за счет экспорта, при этом индикаторы указывают на продолжающуюся слабость внутреннего спроса и частных инвестиций. Меры политики избирательны и сдержанны.
- Ключевые ставки без изменений.
- Денежно-кредитная политика остается стимулирующей.
- Китай подтвердил приверженность фискальным мерам поддержки роста в рамках плана на 2026 год. Основное внимание уделяется стимулированию внутреннего спроса, совершенствованию налоговых льгот и субсидий, а также модернизации промышленности.
Процентные ставки
- 1-летняя базовая ставка по кредитам (среднесрочное кредитование): 3,00%.
- 5-летняя базовая ставка по кредитам (влияет на ипотечные ставки): 3,50%.
Инфляционные индикаторы (декабрь)
- Индекс потребительских цен (CPI): 0,2% м/м (ранее -0,1%); 0,8% г/г (ранее 0,7%).
- Индекс цен производителей (PPI): -1,9% г/г (ранее -2,2%).
ВВП, 4 квартал (окончательные данные)
- Квартал к кварталу: 1,2% (ранее 1,1%).
- Год к году: 4,5% (ранее 4,8%).
Уровень безработицы (декабрь): 5,1% (без изменений).
Промышленное производство (декабрь, г/г): 5,9% (ранее 4,8%).
Инвестиции в основной капитал (декабрь, г/г): -3,8% (ранее -2,6%).
Розничные продажи (декабрь, г/г): 0,9% (ранее 1,3%).
Внешняя торговля (декабрь)
- Импорт: +5,7% г/г (ранее +1,9%).
- Экспорт: +6,6% г/г (ранее +5,9%).
- Сальдо торгового баланса: 114,30 млрд долл. США (ранее 111,68 млрд долл. США).
Индексы деловой активности (PMI), ноябрь
- Промышленный PMI: 49,2 (ранее 49,0).
- PMI в непроизводственном секторе: 49,0 (ранее 49,0).
- Сводный PMI: 49,5 (ранее 50,1).
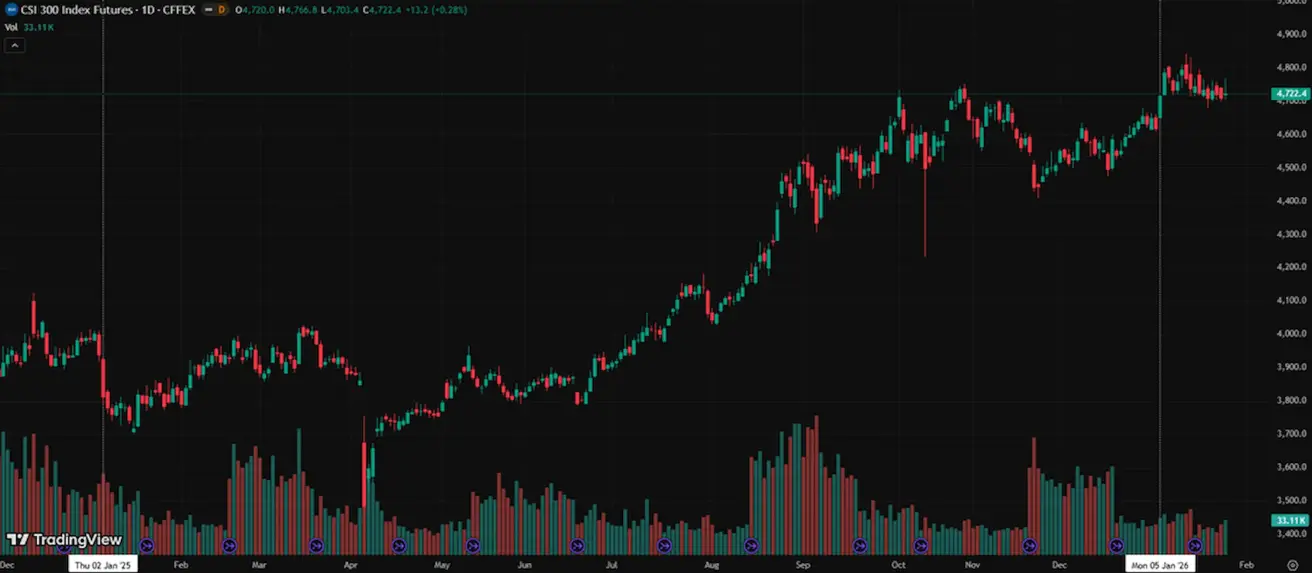
CSI 300 INDEX
Динамика за неделю: −0,20% (закрытие недели на уровне 4722,4); с начала года: +2,00%.
ДОЛГОВОЙ РЫНОК
Доходности гособлигаций США и кредитные спрэды в настоящее время не сигнализируют о сценарии глубокой рецессии или повышенного системного риска.
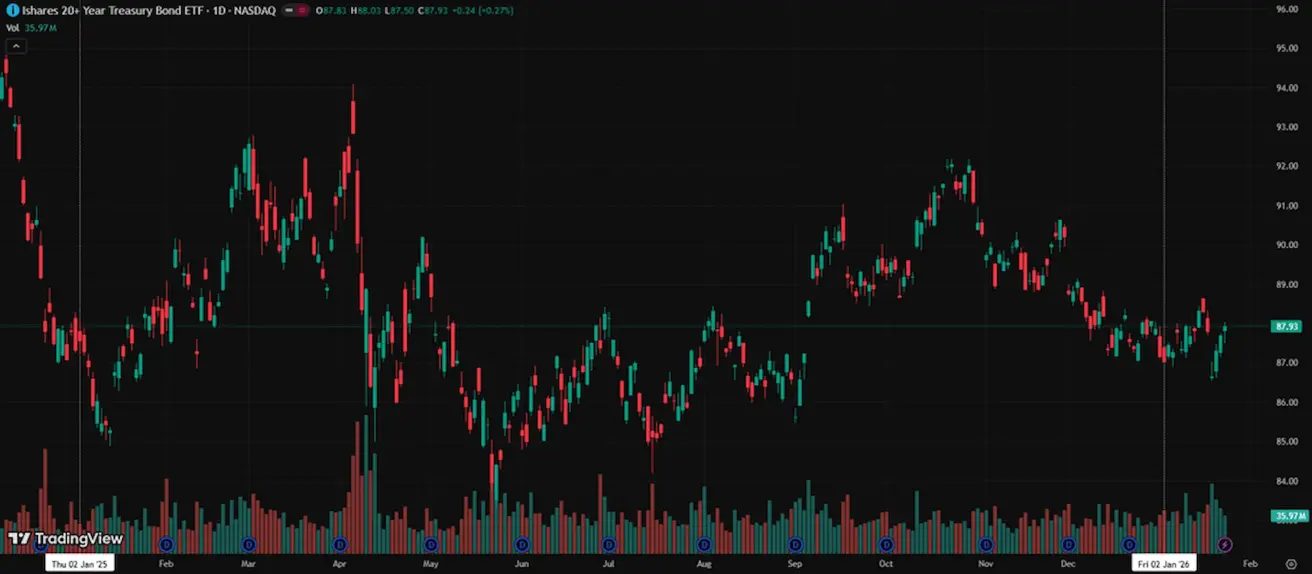
U.S. Treasuries 20+ Years (ETF TLT): динамика за неделю: +0,15% (закрытие недели: 87,93). Динамика с начала года: +0,88%.
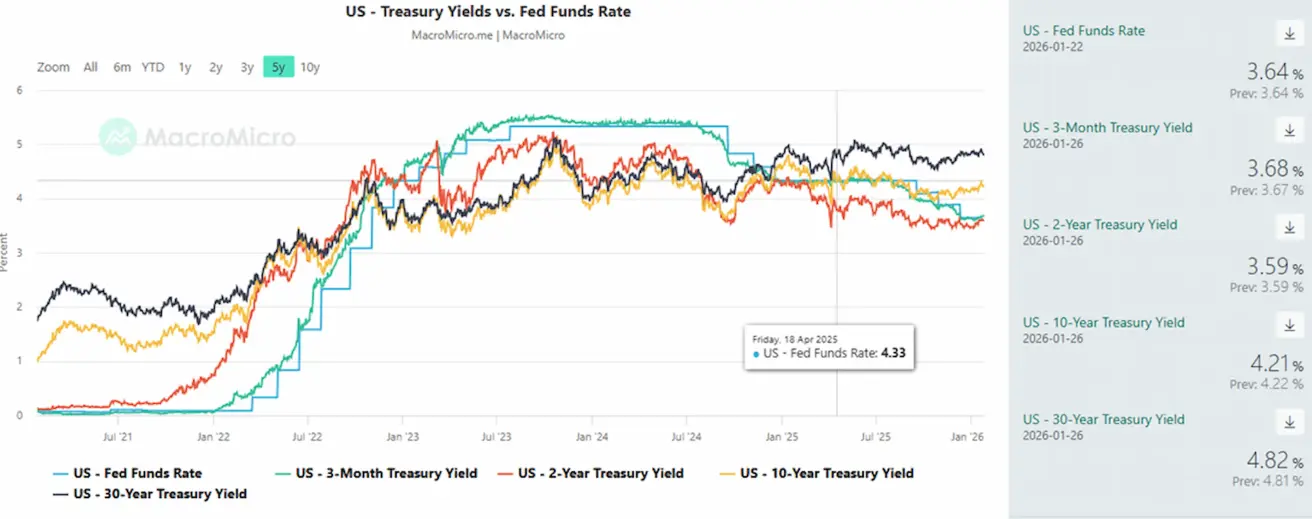
ДОХОДНОСТИ И СПРЭДЫ
- Рыночная доходность 10-летних казначейских облигаций США: 4,21% (ранее 4,23%).
- Доходность 2-летних казначейских облигаций США: 3,59% (ранее 3,60%).
- ICE BofA BBB U.S. Corporate Index — эффективная доходность: 5,03% (ранее 5,00%).
5-летний суверенный CDS США (стоимость защиты от дефолта): 28,34 б.п., против 26,09 б.п. неделей ранее.
В настоящее время кривая доходности США вернулась к нормальной форме и отражает конструктивный макроэкономический сценарий: ожидания перехода ФРС к более нейтральной политике на фоне продолжающейся устойчивости экономики. Рынки закладывают постепенное замедление роста без рецессии, не ожидая возврата к нулевым ставкам.
Спред доходности между 10-летними и 2-летними казначейскими облигациями США составляет 62 базисных пункта (ранее 63 б.п.).
Спред доходности между 10-летними и 3-месячными казначейскими облигациями США составляет 53 базисных пункта (ранее 59 б.п.).
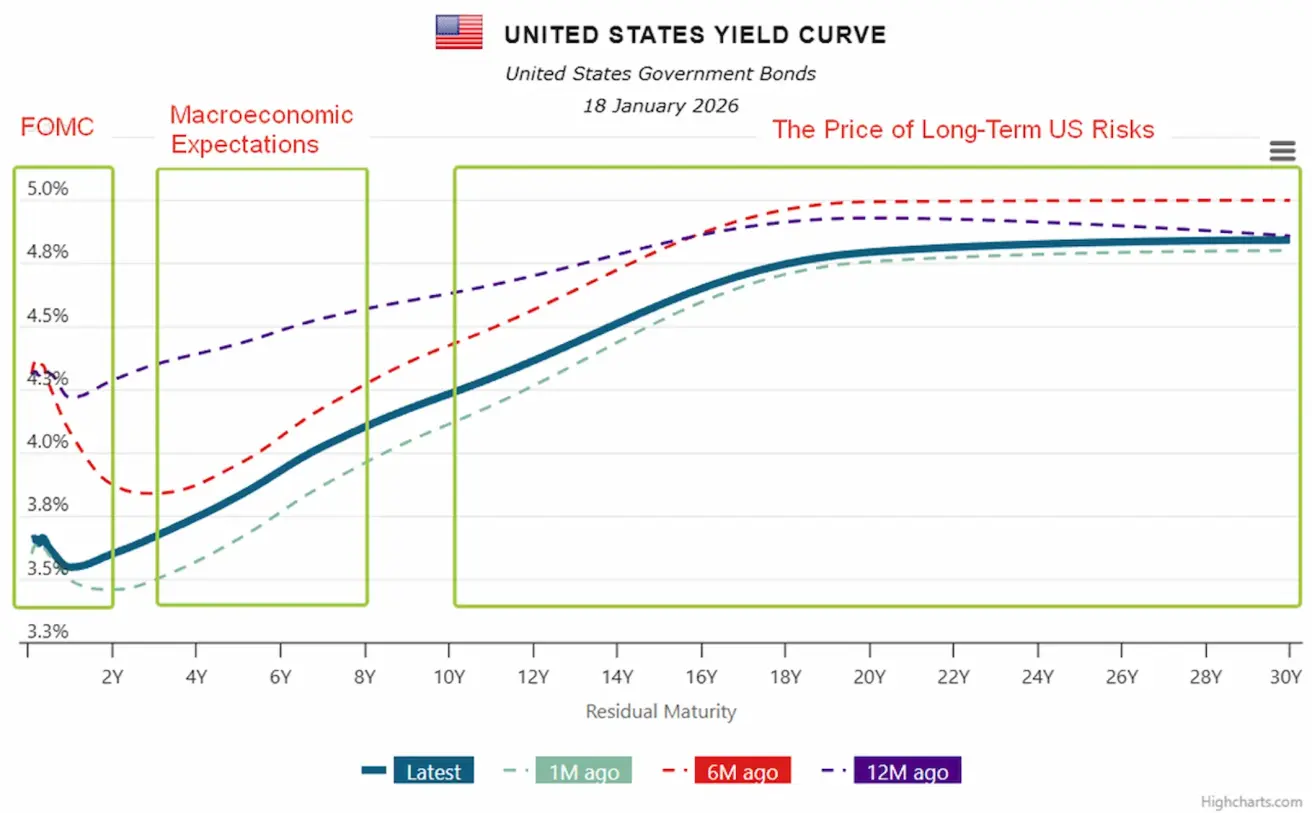
Кривая доходности служит картой рыночных ожиданий относительно процентных ставок, общего экономического прогноза и восприятия рисков. Каждый сегмент кривой отражает отдельный набор ожиданий.
Как интерпретировать кривую:
- Краткосрочный сегмент (до 2 лет) — «зона ФРС», отражающая ожидания по ключевой ставке и ближайшим решениям FOMC:
- Рост доходностей указывает на ожидания ужесточения политики.
- Снижение доходностей говорит о закладываемых рынком снижениях ставок.
В настоящее время кривая подразумевает ожидания снижения ставки на 25 базисных пунктов.
Среднесрочный сегмент (3–7 лет) — «зона макроэкономических ожиданий», отражающая взгляды на экономический рост, среднесрочную инфляцию и вероятность мягкой посадки или более резкого замедления:
- Текущий восходящий наклон относительно краткосрочных ставок указывает на ожидания дальнейшего экономического роста.
- Снижение в этом сегменте сигнализировало бы о замедлении роста.
Долгосрочный сегмент (10–30 лет) — «зона доверия и долгосрочного ценообразования рисков для США», отражающая долгосрочные инфляционные ожидания, фискальные риски США, доверие к доллару и суверенному долгу, а также премию за срок:
- Долгосрочные доходности остаются повышенными, что говорит об отсутствии закладываемого рынком кризиса, при сохранении фискальных и инфляционных премий.
- Снижение указывало бы на усиление рецессионных или дефляционных опасений.
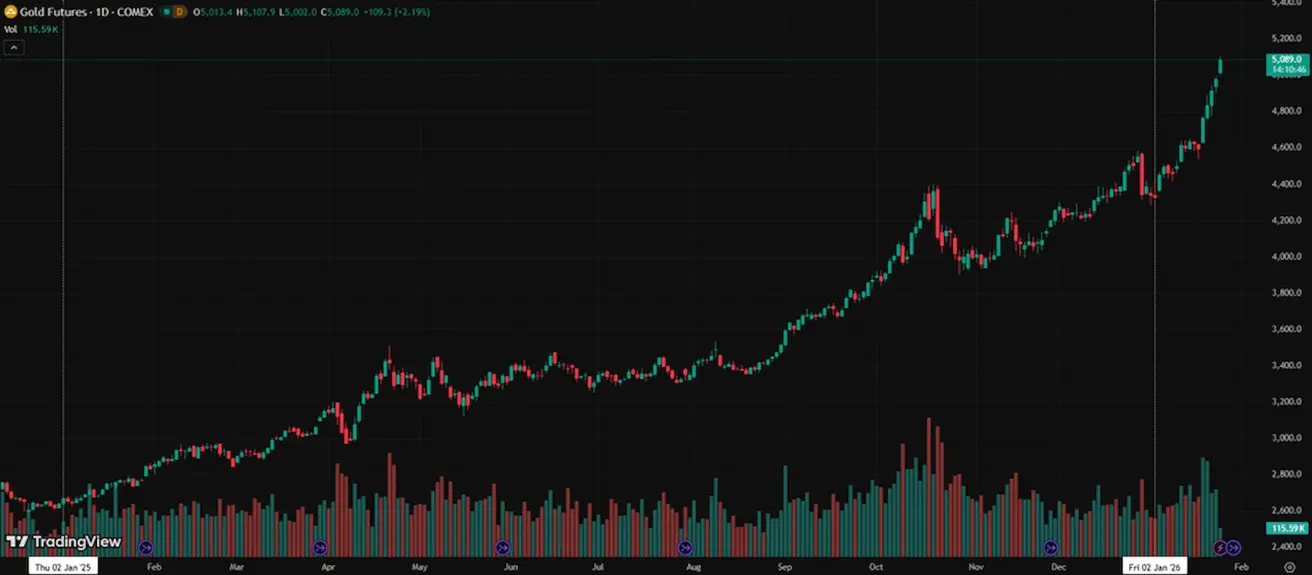
ФЬЮЧЕРСЫ НА ЗОЛОТО (GC)
Динамика за неделю: +10,61% (закрытие недели на уровне $5089,1 за тройскую унцию); с начала года: +17,47%.
Цены на золото продолжают расти на фоне устойчивого спроса со стороны центральных банков и быстрого роста глобального долга в условиях сохраняющейся геополитической и макроэкономической неопределенности.
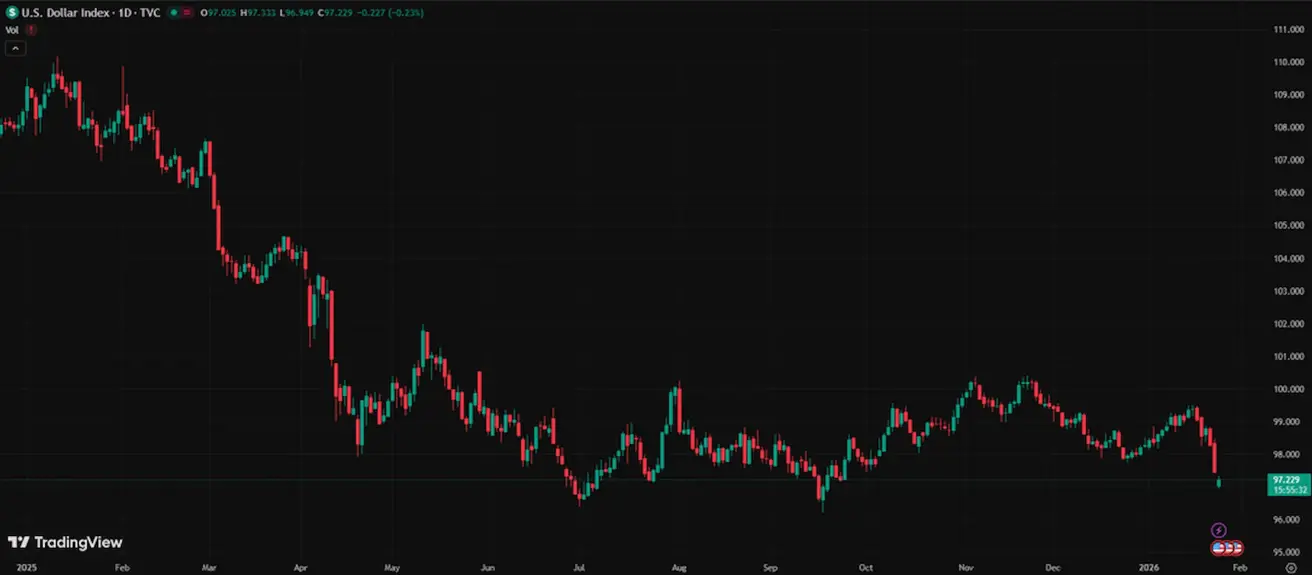
ФЬЮЧЕРСЫ НА ИНДЕКС ДОЛЛАРА (DX)
Динамика за неделю: -1,74% (закрытие недели на уровне 97,456); с начала года: -0,55%.
После снижения в конце 2025 года доллар США перешел в фазу стабилизации и частичного восстановления. Ожидания более нейтральной политики ФРС ограничивают потенциал дальнейшего укрепления, но не создают устойчивого давления на снижение курса доллара, что продолжает поддерживать спрос на золото и сырьевые активы.
ФЬЮЧЕРСЫ НА НЕФТЬ
Динамика за неделю: +3,31% (закрытие недели на уровне $61,18 за баррель); с начала года: +6,57%.
- Прогнозы по росту предложения нефти пока сохраняются.
- OPEC+ планирует приостановить дальнейшее увеличение добычи нефти.
- Геополитические риски на Ближнем Востоке — включая протесты и рост напряженности в Иране — усиливают опасения по поводу возможных перебоев в поставках.
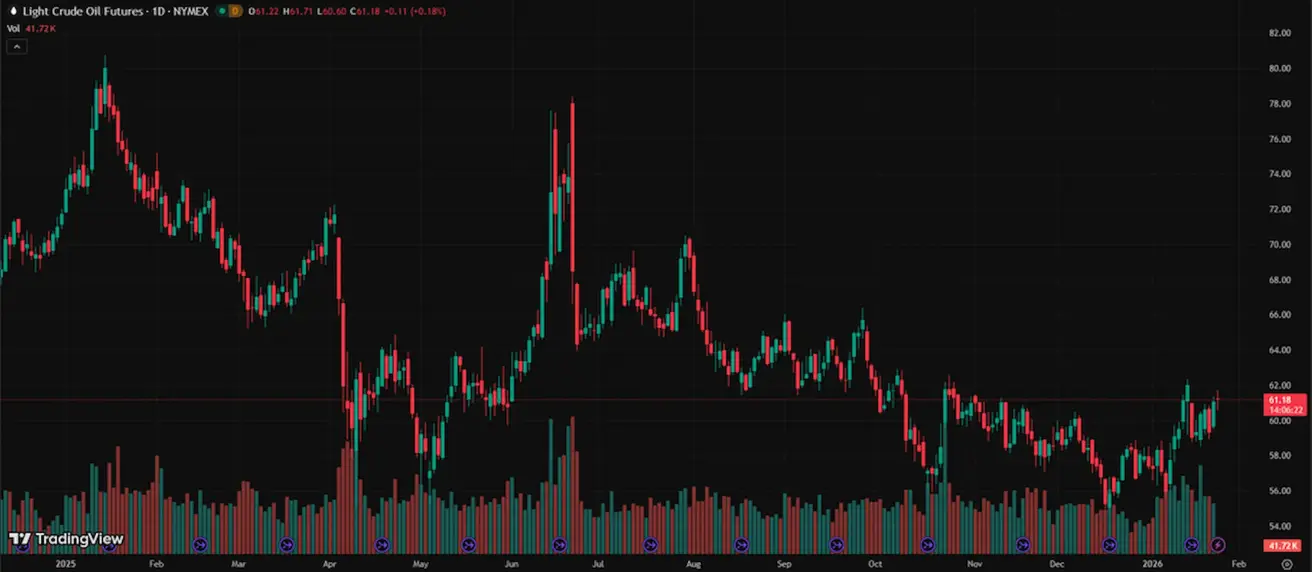
Цены на нефть продолжают расти после объявления президентом Трампом о введении новых 25% тарифов на торговлю с США для стран, поддерживающих коммерческие отношения с Ираном.
Согласно последнему ежемесячному отчету Международного энергетического агентства (IEA), среднегодовой прирост мирового спроса на нефть в 2026 году ожидается на уровне 930 тыс. баррелей в сутки против 850 тыс. баррелей в сутки в 2025 году.
Агентство ожидает нормализации экономических условий после прошлогодних тарифных шоков и снижения цен на нефть относительно предыдущего года.
Восстановление спроса на нефтехимическое сырье частично компенсируется продолжающимся замедлением роста спроса на бензин. В 2026 году на страны вне ОЭСР вновь придется весь прирост мирового спроса.
Общие мировые запасы нефти увеличились на 470 млн баррелей в 2025 году, что соответствует среднему приросту 1,3 млн баррелей в сутки.
Текущий глобальный профицит обусловлен устойчивым ростом предложения с начала 2025 года, при этом на долю производителей вне OPEC+ приходится почти 60% от общего прироста в 3 млн баррелей в сутки.
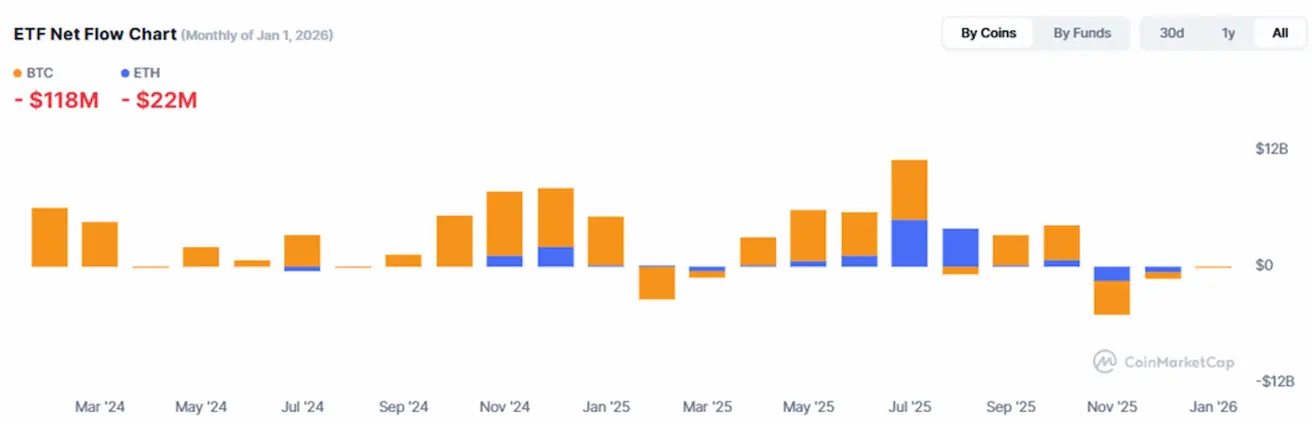
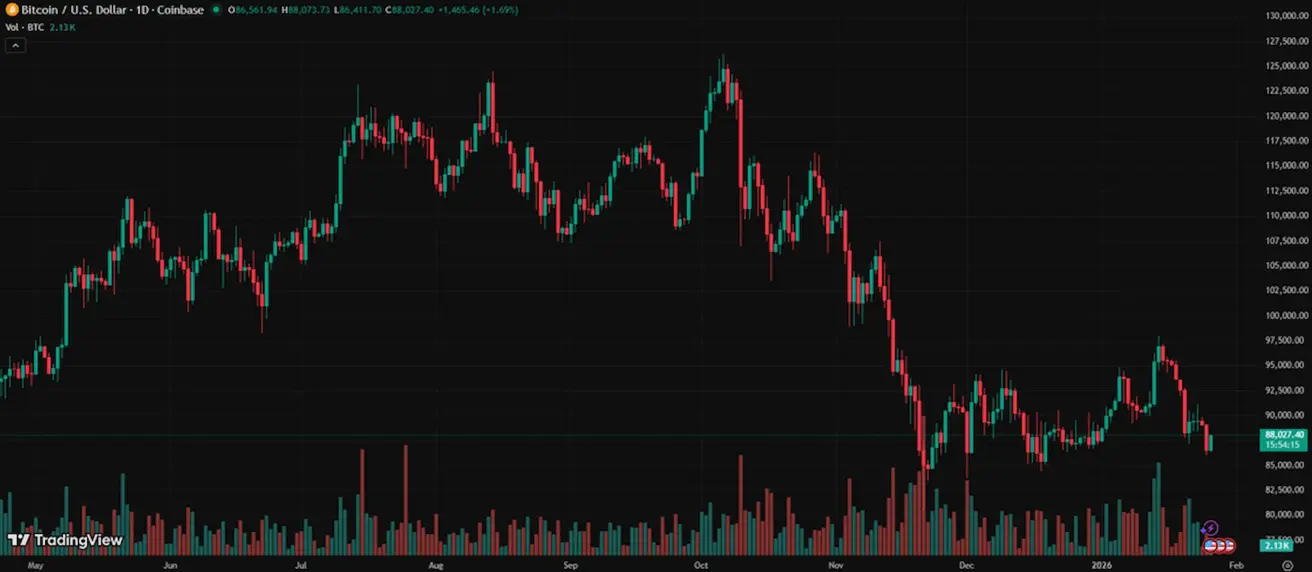
BTC-ФЬЮЧЕРСЫ
Крипторынок проходит этап институционализации: расширение инфраструктуры, рост участия банков и увеличение ликвидности в блокчейне формируют более зрелый рынок без признаков спекулятивного перегрева.
Динамика за неделю: -10,92% (закрытие недели на уровне $86561,94); с начала года: -1,32%.
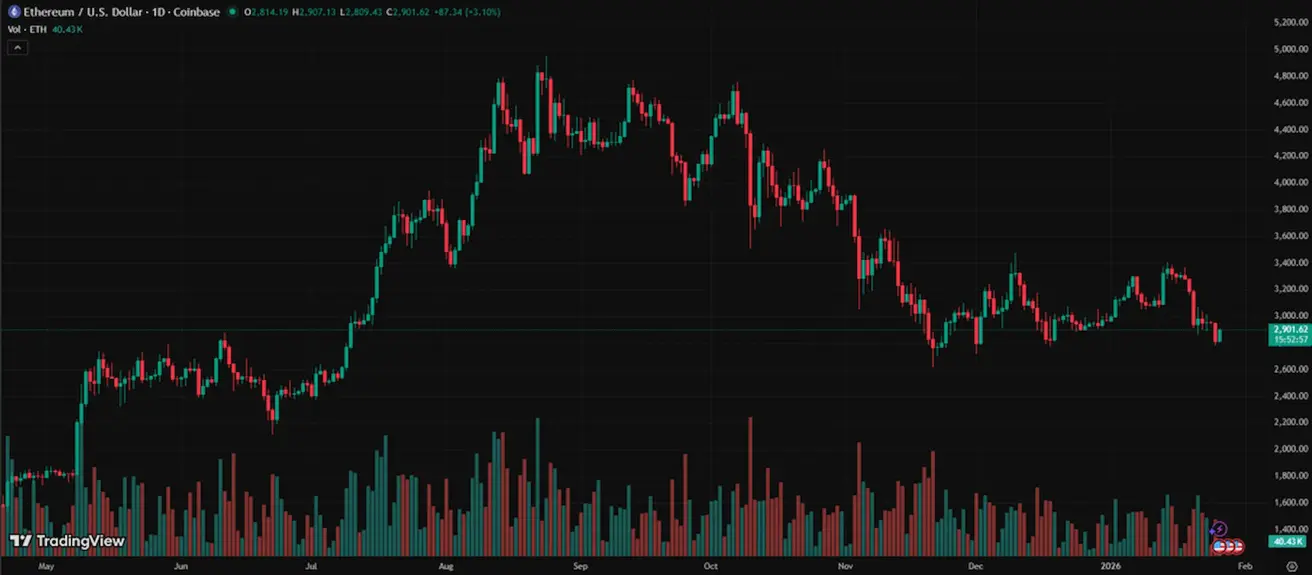
ETH-ФЬЮЧЕРСЫ
Динамика за неделю: -15,61% (закрытие недели на уровне $2814,28); с начала года: -5,37%.
ОБЩАЯ РЫНОЧНАЯ КАПИТАЛИЗАЦИЯ КРИПТОВАЛЮТ
$2,97 трлн (против $3,23 трлн неделей ранее) (CoinMarketCap)
Доля рынка по активам:
- Bitcoin: 59,2% (58,9%).
- Ethereum: 11,8% (12,5%).
- Прочие криптоактивы: 29,1% (28,6%).
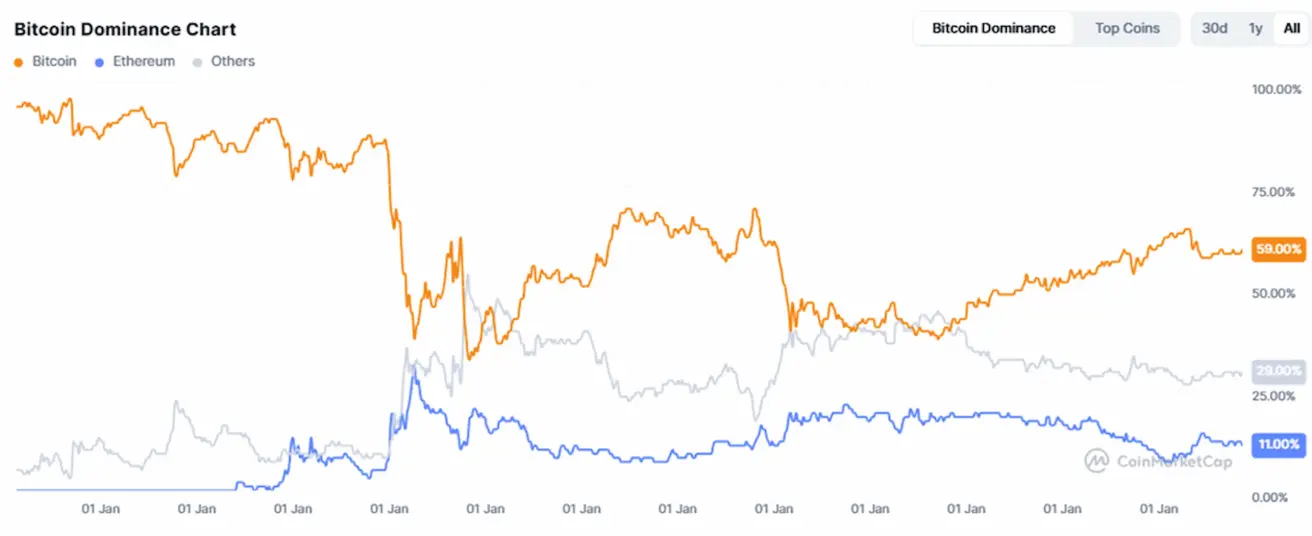
График чистых потоков ETF: