English
 Lietuvių
 Қазақша
 Eesti
Eesti2–8 марта 2026 года: Еженедельный экономический обзор
Ключевые обновления рынка

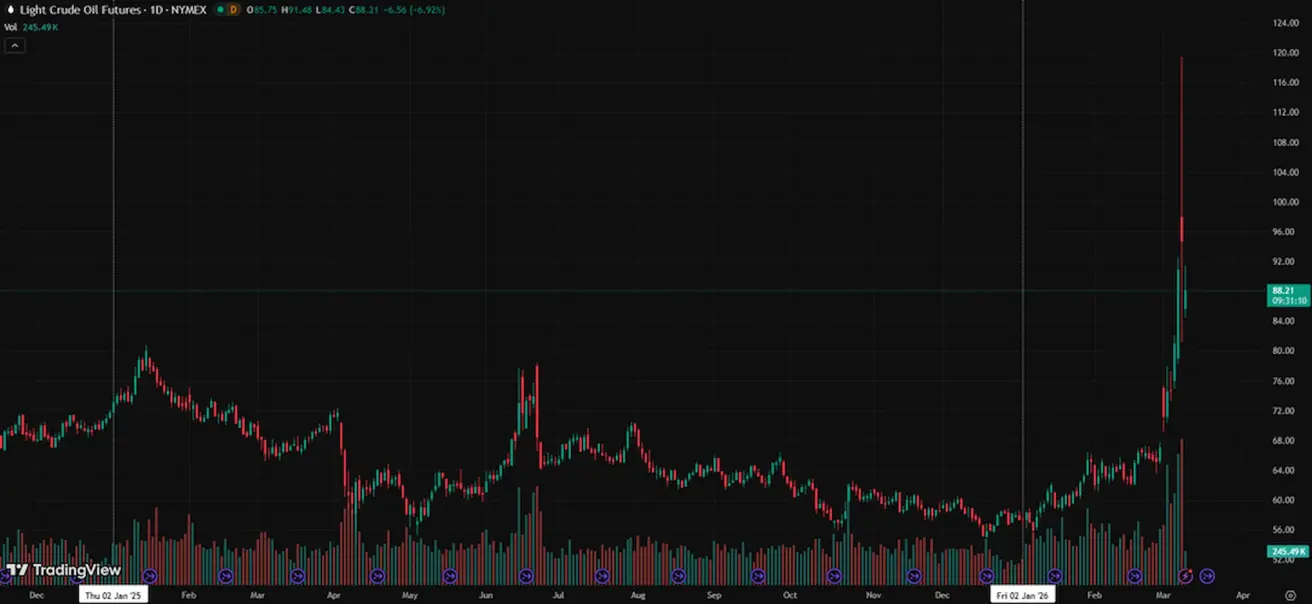
Фьючерсы на нефть кратковременно достигли $120 за баррель.
В минувшие выходные Израиль и США начали интенсивные удары по нефтеперерабатывающим заводам в Иране, в то время как Иран нанес ответные удары по НПЗ в Израиле. Конфликт все больше распространяется на региональную энергетическую инфраструктуру, что отразилось на резком росте цен на энергоносители.
Позднее цены снизились до $100 за баррель после сообщений о том, что страны G7 рассматривают возможность выпуска до 400 млн баррелей сырой нефти из своих стратегических резервов. Кроме того, по различным данным, общая интенсивность ракетных ударов снизилась примерно на 80–90%.
Наземная операция в настоящее время маловероятна, поскольку ряд факторов — включая географию Ирана — может затянуть конфликт. В результате ожидается, что цены на энергоносители останутся на повышенном уровне.
Из-за возможной потери части электората республиканцы рискуют проиграть предстоящие промежуточные выборы в Конгресс, чего Дональд Трамп не может себе позволить. Сегодня Дональд Трамп заявил, что война может скоро закончиться, что способствовало снижению цен на энергоносители.
Представитель Израиля заявил, что в целом ключевые задачи выполнены — а именно, уничтожена ядерная программа Ирана и снижены его ракетные возможности.
В то же время заместитель министра иностранных дел Ирана заявил, что Иран готов отказаться от своей ядерной программы при условии, что США смогут предложить приемлемую альтернативу, которая пока не была представлена.
Главный открытый вопрос на сегодня — Ормузский пролив.
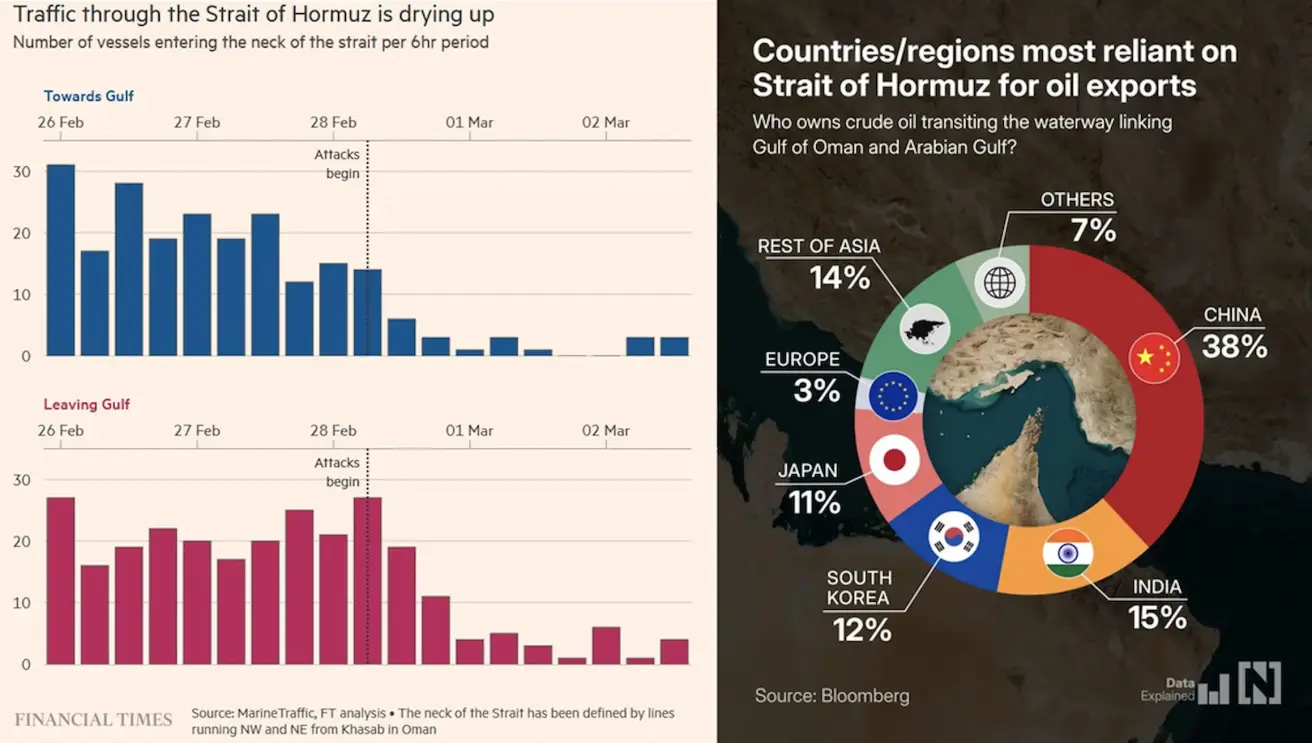
После начала атак наблюдается резкое сокращение судоходства через Ормузский пролив. До этого через самое узкое место пролива проходило в обоих направлениях в среднем 20–30 судов каждые шесть часов.
Сейчас количество судов практически снизилось до нуля. Ормузский пролив — один из важнейших узлов мировой энергетической логистики, и столь резкое сокращение трафика значительно увеличивает риск перебоев с поставками энергоносителей и усиливает волатильность на сырьевых рынках.
Министр энергетики Катара заявил, что война может вынудить страны Персидского залива прекратить экспорт энергоносителей в течение нескольких недель.
Кувейт и ОАЭ уже начали сокращать добычу по мере заполнения хранилищ после закрытия пролива, а Ирак начал приостанавливать часть производства. Сегодня Саудовская Аравия также объявила о сокращении добычи, сославшись на полностью заполненные хранилища.
Основными получателями нефти, транспортируемой через Ормузский пролив, являются азиатские страны (более 80%), в первую очередь Китай, Индия, Южная Корея и Япония. Соответственно, любые потенциальные перебои с поставками в первую очередь создают инфляционные риски для экономик Азии.
Влияние на США более ограничено. США импортируют очень мало нефти из Персидского залива благодаря высокому уровню собственной сланцевой добычи, что позволяет частично компенсировать рост цен за счет увеличения доходов энергетического сектора.
Инфляционный риск связан не с краткосрочным скачком цен, а с его продолжительностью. Длительное нарушение поставок может ускорить инфляцию, ухудшить торговый баланс и ослабить валюты азиатских экономик.
Влияние роста цен на нефть на инфляцию в США:

По оценкам Goldman Sachs, рост цен на нефть на 10% может увеличить общий индекс потребительских цен (CPI) примерно на 0,28 процентного пункта, а индекс расходов на личное потребление (PCE) — примерно на 0,20 процентного пункта, при этом влияние на базовую инфляцию ограничено — около 0,04 процентного пункта. Иными словами, даже значительный рост цен на нефть, как ожидается, окажет лишь ограниченное влияние на инфляцию в США.
США — основные выводы
- Процентные ставки остаются без изменений, ФРС сохраняет осторожный тон.
- Денежно-кредитная политика остается умеренно жесткой, постепенно приближаясь к нейтральной.
- Федеральная резервная система поддерживает хрупкий баланс: поддерживает финансовые рынки, избегая сигналов о скором или резком снижении ставок.
- Макроэкономические данные США продолжают поддерживать сценарий мягкой посадки: экономический рост превышает потенциальный, инфляция постепенно замедляется, рынок труда охлаждается, признаков рецессии нет.
ИНФЛЯЦИЯ: ИНДЕКС ПОТРЕБИТЕЛЬСКИХ ЦЕН (ЯНВАРЬ)
- Базовый CPI: (м/м) 0,2% (пред.: 0,2%); (г/г) 2,6% (пред.: 2,6%).
- CPI: (м/м) 0,3% (пред.: 0,3%); (г/г) 2,7% (пред.: 2,7%).
ИНДЕКС ЦЕН ПРОИЗВОДИТЕЛЕЙ (ЯНВАРЬ)
- PPI (м/м): 0,5%, пред.: 0,2%.
- Базовый PPI (м/м): 0,7%, пред.: 0,0% (пересмотрено):
ИНФЛЯЦИОННЫЕ ОЖИДАНИЯ (МИЧИГАН) (ФЕВРАЛЬ)
- 12-месячные инфляционные ожидания: 3,4%, пред.: 4,0%.
- 5-летние инфляционные ожидания: 3,3%, пред.: 3,3%.
ВВП
ВВП (Бюро экономического анализа США, BEA) (4 кв. 25 г., в годовом выражении, предварительная оценка): +4,4% (2 кв. 25 г.: +3,8%)
Индикатор GDPNow Федерального резервного банка Атланты («текущая» оценка официального показателя до публикации): 3,0% (пред.: 3,0%).
Индекс деловой активности Чикаго (PMI), США: 54,0 (предыдущее значение: 42,7):
ИНДЕКС ДЕЛОВОЙ АКТИВНОСТИ (PMI) (ФЕВРАЛЬ)
- (Значение выше 50 — расширение, ниже 50 — сокращение)
- Сектор услуг: 51,7 (пред.: 52,7);
- Промышленный сектор: 51,2 (пред.: 52,4);
- S&P Global Composite: 51,9 (пред.: 53,0).
РЫНОК ТРУДА (BLS) (ФЕВРАЛЬ)
- Уровень безработицы: 4,3% (пред.: 4,4%);
- Общее число продолжающих получать пособие по безработице в США: 1 868 тыс. (пред.: 1 869 тыс.);
- Первичные заявки на пособие по безработице: 213 тыс. (пред.: 213 тыс.);
- Изменение числа рабочих мест вне сельского хозяйства: 130 тыс. (пред.: 48 тыс.);
- Изменение числа частных рабочих мест вне сельского хозяйства: 172 тыс. (пред.: –64 тыс.);
- Средний рост почасовой оплаты труда (г/г): 3,7% (пред.: 3,8%);
- Открытые вакансии JOLTS: 6,542 млн (пред.: 6,928 млн).
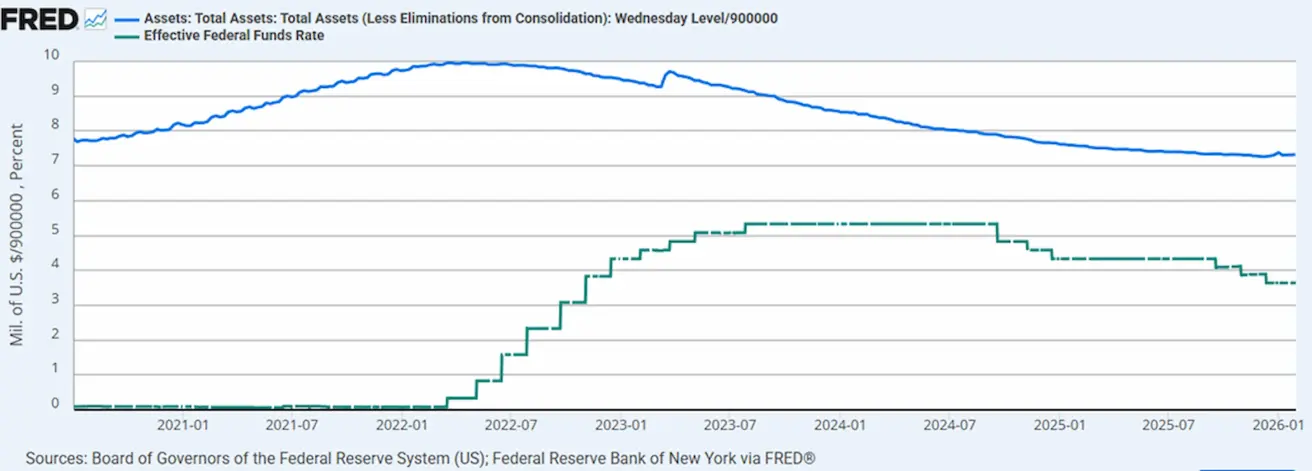
ДЕНЕЖНО-КРЕДИТНАЯ ПОЛИТИКА
- Эффективная ставка по федеральным фондам (EFFR): 3,50%–3,75%;
- Баланс Федеральной резервной системы: $6,629 трлн, +1,44% с момента приостановки QT ($6,535 трлн).
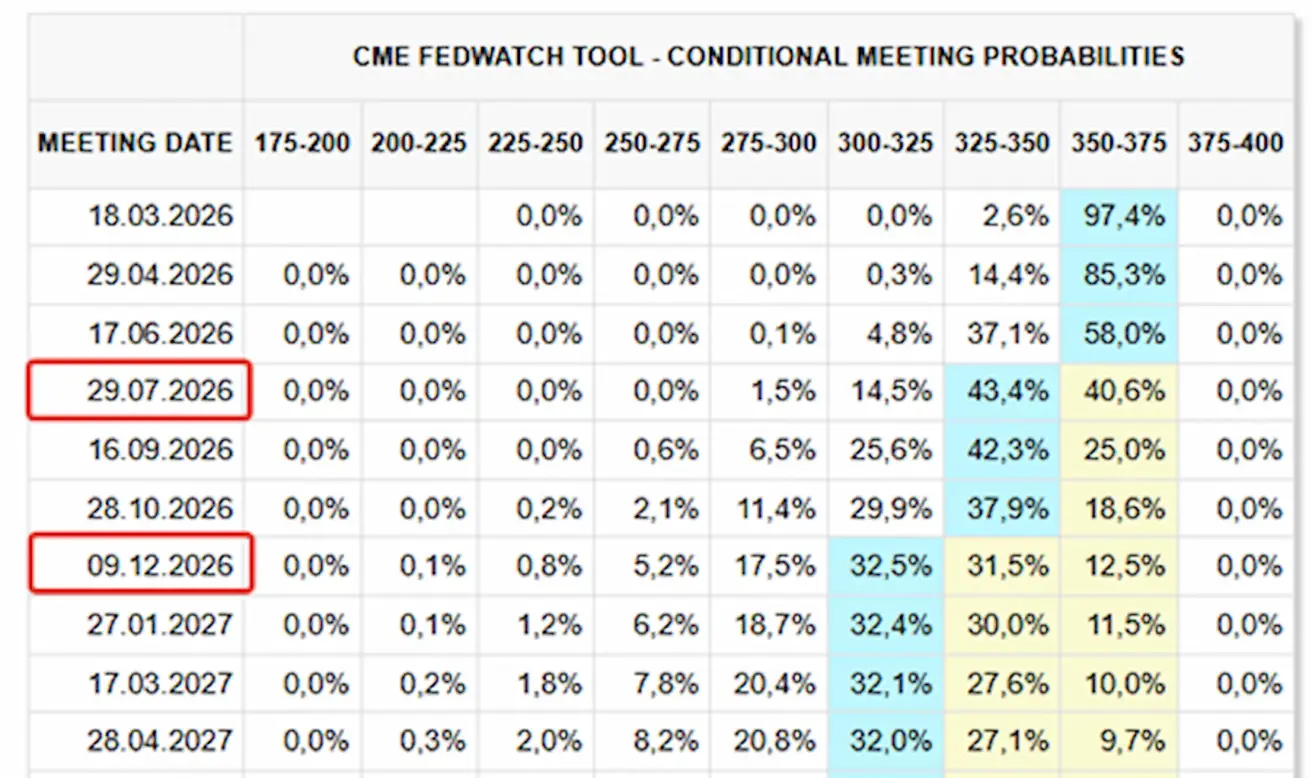
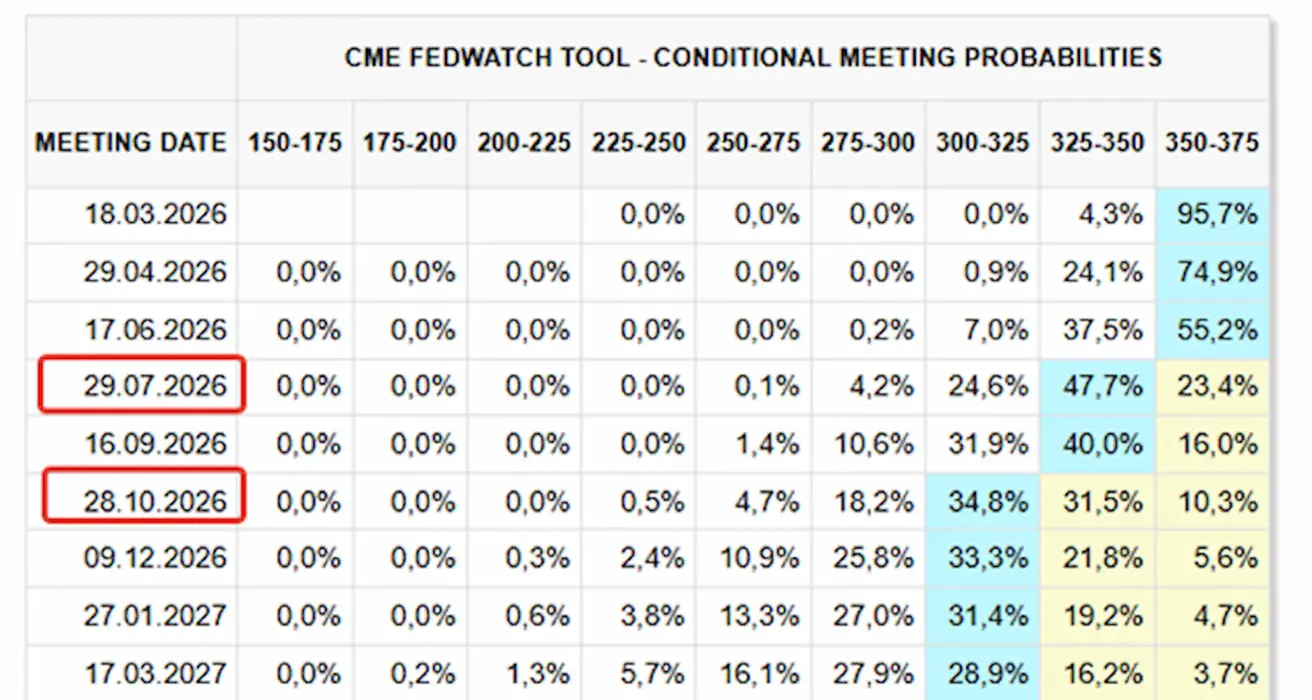
ПРОГНОЗ РЫНКА ПО СТАВКЕ (FEDWATCH)
На предстоящем заседании (18 марта) оценочная вероятность снижения ставки на 0,25% составляет 2,59%.
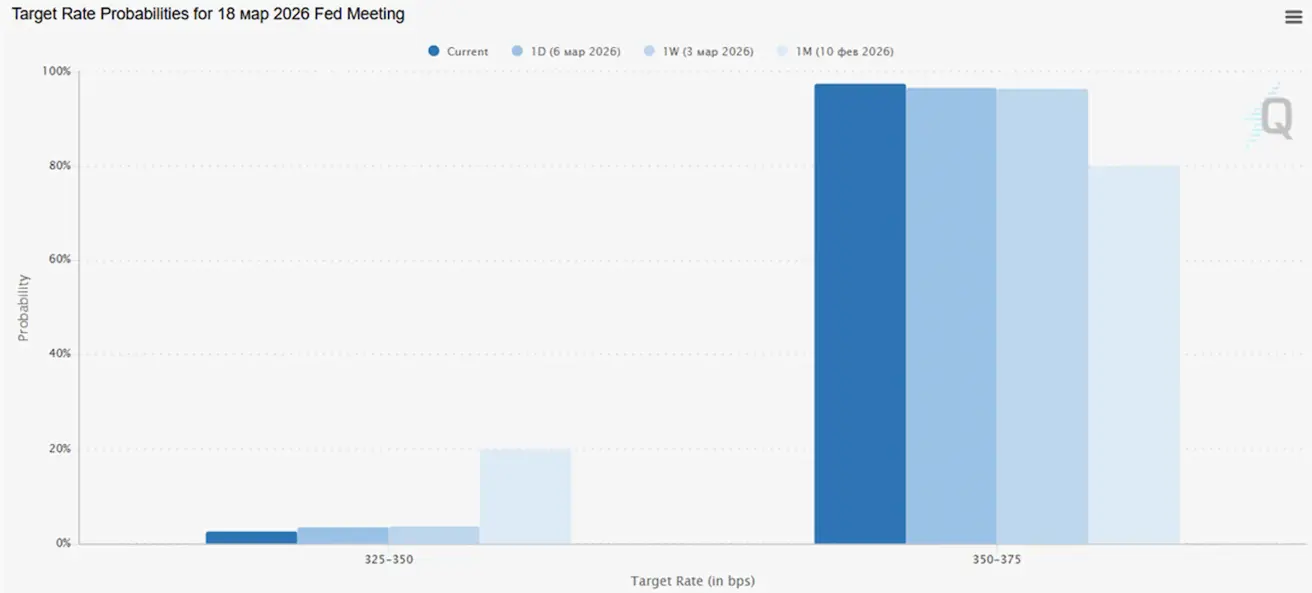
В течение следующих 12 месяцев рынок закладывает два снижения ставки по 0,25%, что приведет целевой диапазон к 3,00–3,25%. Первое снижение ожидается на заседании в июле.
Сегодня:
Неделей ранее:
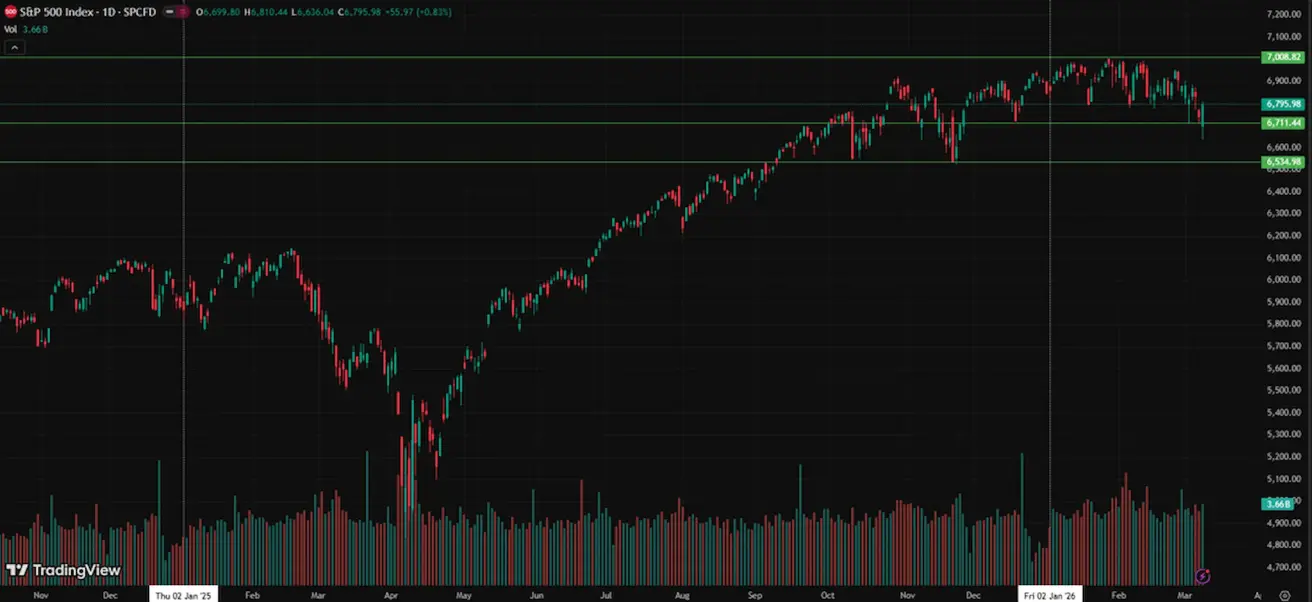
SP500
- Итог за неделю: –2,02% (закрытие недели: 6 740,01); с начала года: –1,54%. В понедельник индекс вырос на +1,53%.
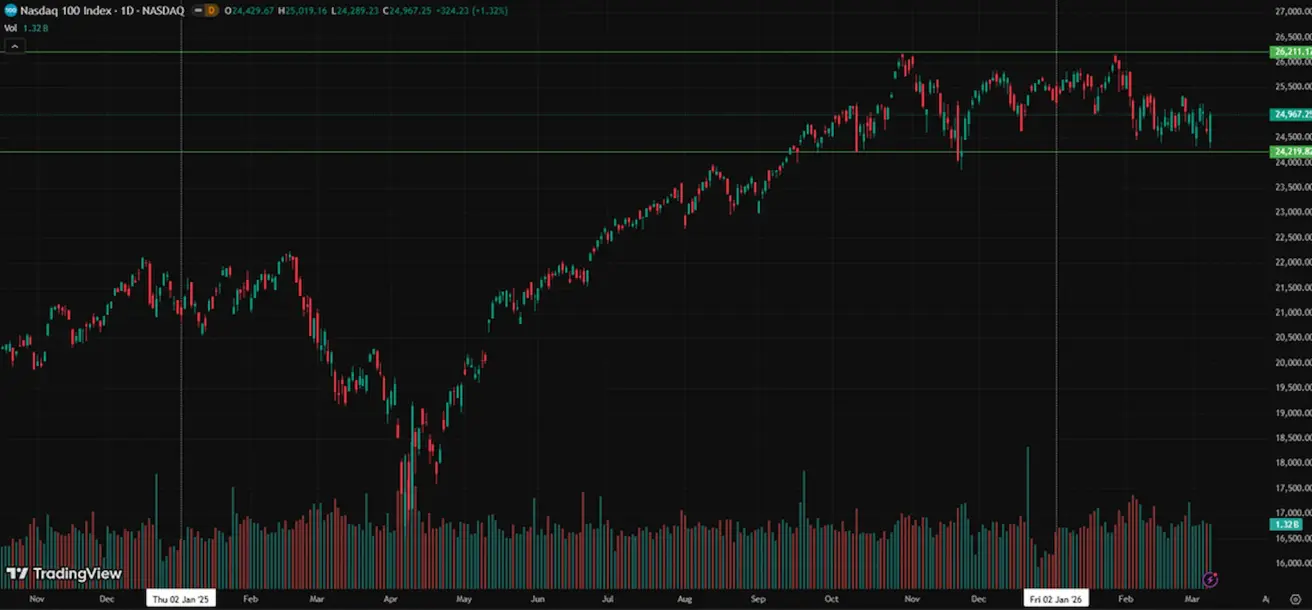
NASDAQ100
- Итог за неделю: –1,27% (закрытие недели: 24 643,01); с начала года: –2,40%. В понедельник индекс вырос на +2,5%.
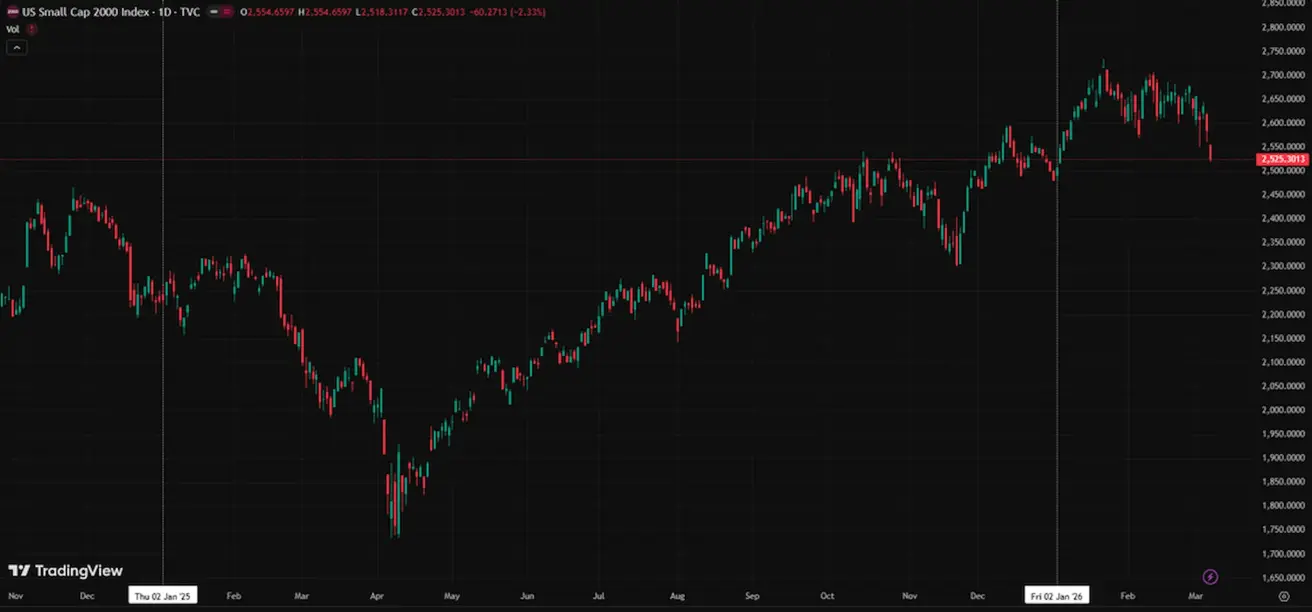
RUSSEL 2000 (RUT)
- Итог за неделю: –4,07% (закрытие недели: 2 525,3013); с начала года: +1,75%.
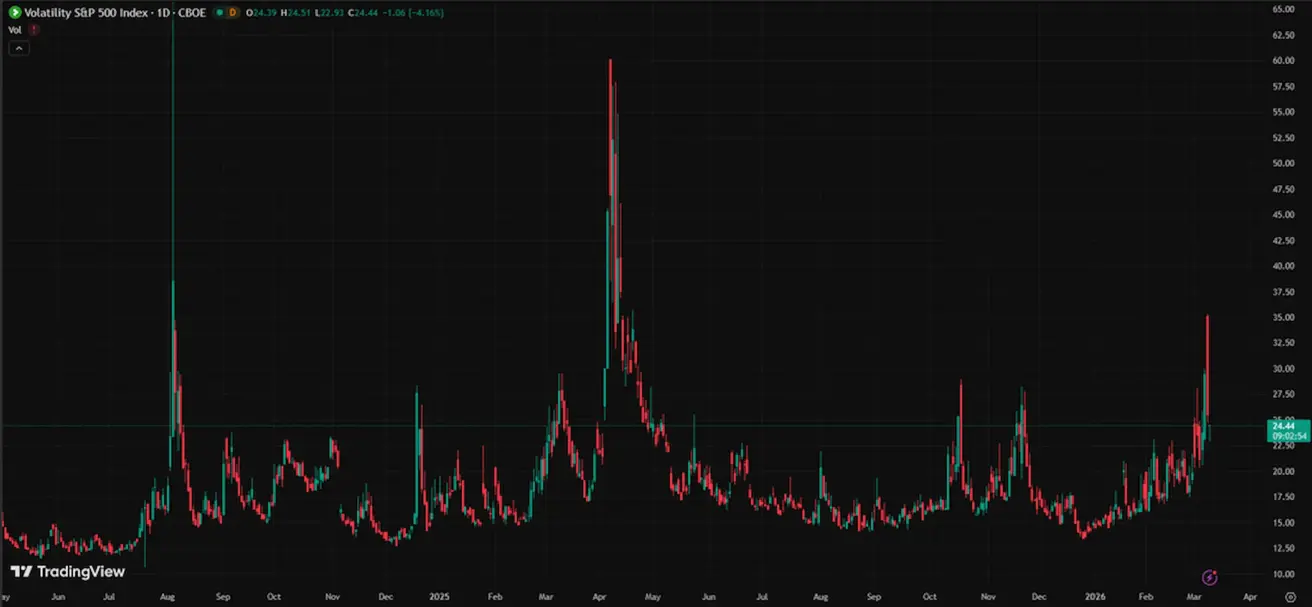
VIX
Индекс волатильности VIX снизился с пика 35,30 пункта до 23 пунктов.
На графике показана динамика чистого притока иностранного капитала в активы США (Net foreign inflows into U.S. assets):
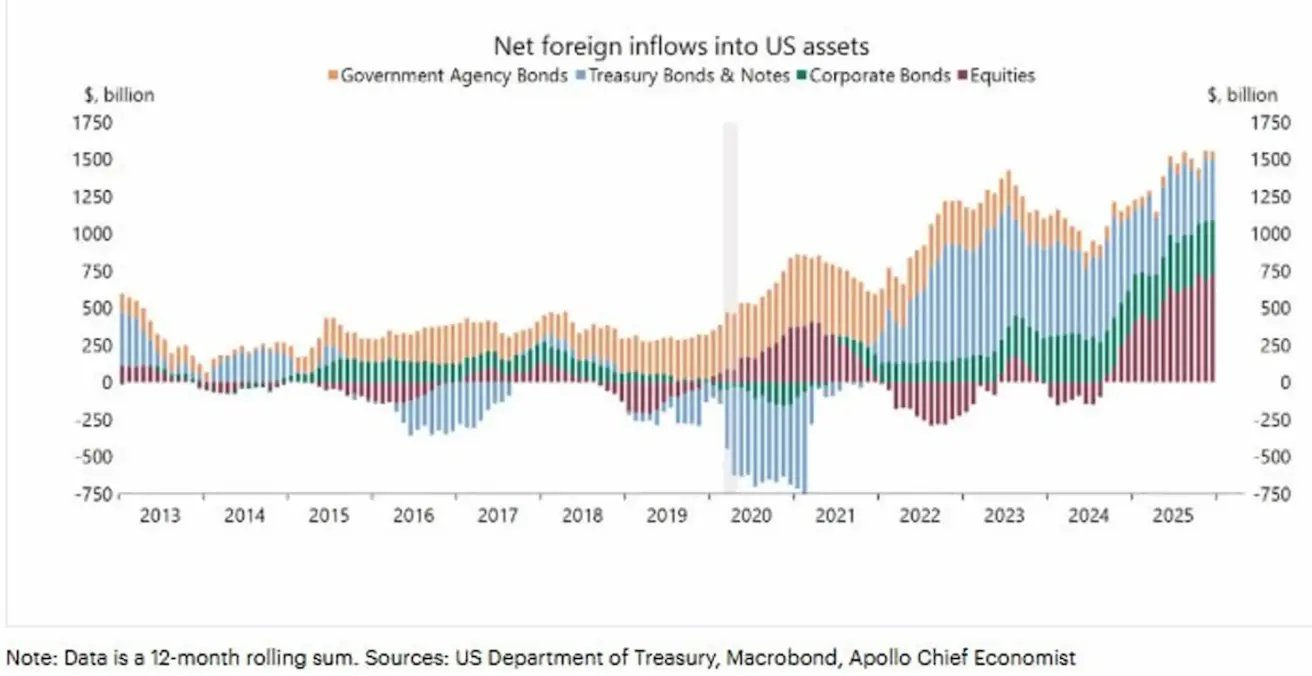
Данные представлены в виде скользящей суммы за 12 месяцев и разбиты по основным классам активов: государственные облигации США, агентские облигации, корпоративные облигации и акции.
После значительного оттока капитала во время пандемии 2020 года приток иностранных инвестиций в активы США начал стабильно восстанавливаться. В 2024–2025 годах глобальный спрос на активы США, особенно на акции, заметно вырос, а спрос на государственные облигации остался стабильным. Это отражает привлекательность американского рынка на фоне высоких ставок и относительной устойчивости экономики США.
К концу 2025 года общий приток достиг максимальных значений за рассматриваемый период, превысив $1,5 трлн в годовом выражении.
Еврозона
Процентные ставки остаются без изменений, инфляция в целом под контролем.
Денежно-кредитная политика в целом нейтральна — баланс рисков сместился с инфляции в сторону экономической слабости.
По мере снижения торговых напряженностей ЕЦБ пересмотрел прогнозы по ВВП и инфляции в сторону повышения на ближайшие годы.
Европа стабилизируется, однако темпы роста по-прежнему отстают от США.
Процентные ставки
- Ставка по депозитным операциям: 2,0% (предыдущее значение: 2,0%)
- Ставка по маржинальному кредитованию: 2,4% (предыдущее значение: 2,4%) — ставка, по которой банки могут получать овернайт-финансирование у регулятора
- Основная ставка рефинансирования: 2,15% (предыдущее значение: 2,15%)
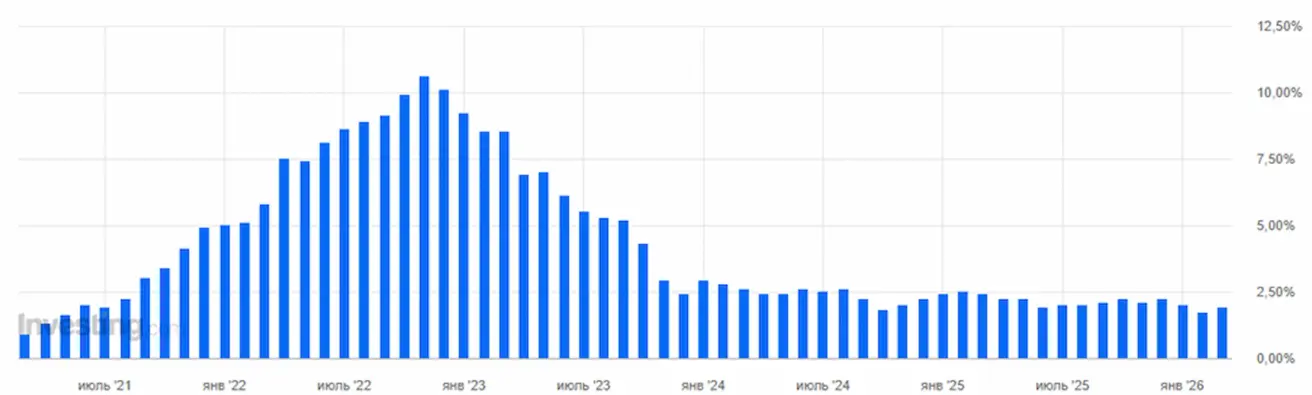
Инфляция — индекс потребительских цен (CPI) (февраль)
- Базовый CPI (г/г): 2,4% (пред.: 2,2%)
- CPI (м/м): 0,7% (пред.: –0,6%, пересмотрено)
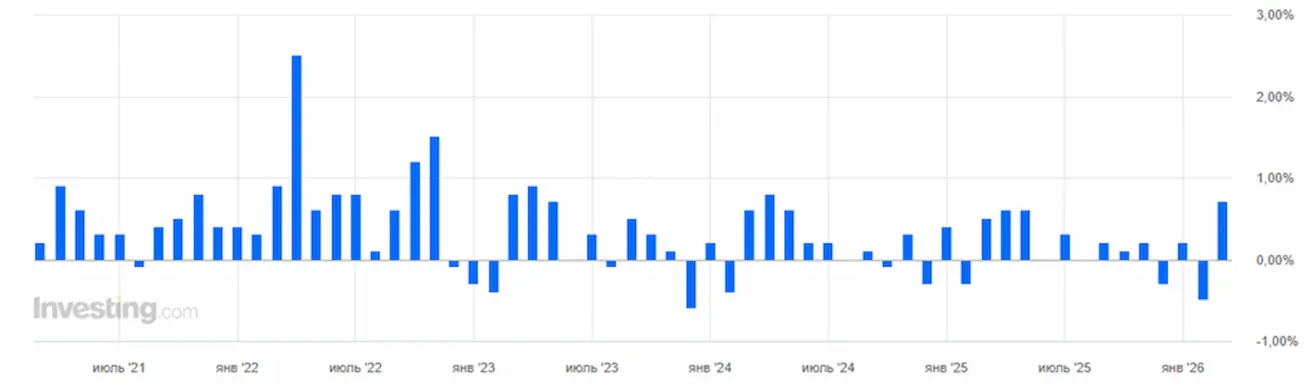
- CPI (г/г): 1,9% (пред.: 1,7%, пересмотрено)
ВВП (4 кв., окончательная оценка)
- Квартал к кварталу: 0,3% (пред.: 0,3%)
- Год к году: 1,3% (пред.: 1,4%)
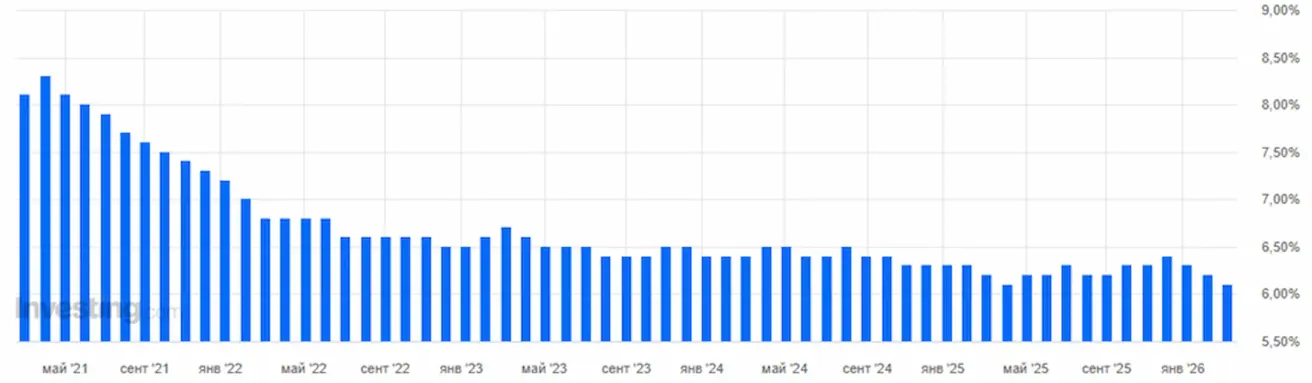
Уровень безработицы (февраль)
- 6,10% (пред.: 6,20%).
Индекс деловой активности (PMI) (февраль)
- Сектор услуг: 51,9 (пред.: 51,8)
- Промышленный сектор: 49,5 (пред.: 49,4)
- S&P Global Composite PMI: 51,9 (пред.: 51,9)
EURO STOXX 600 (FXXP1!)
- Итог за неделю: –5,85% (закрытие недели: 597,1); с начала года: +0,52%.
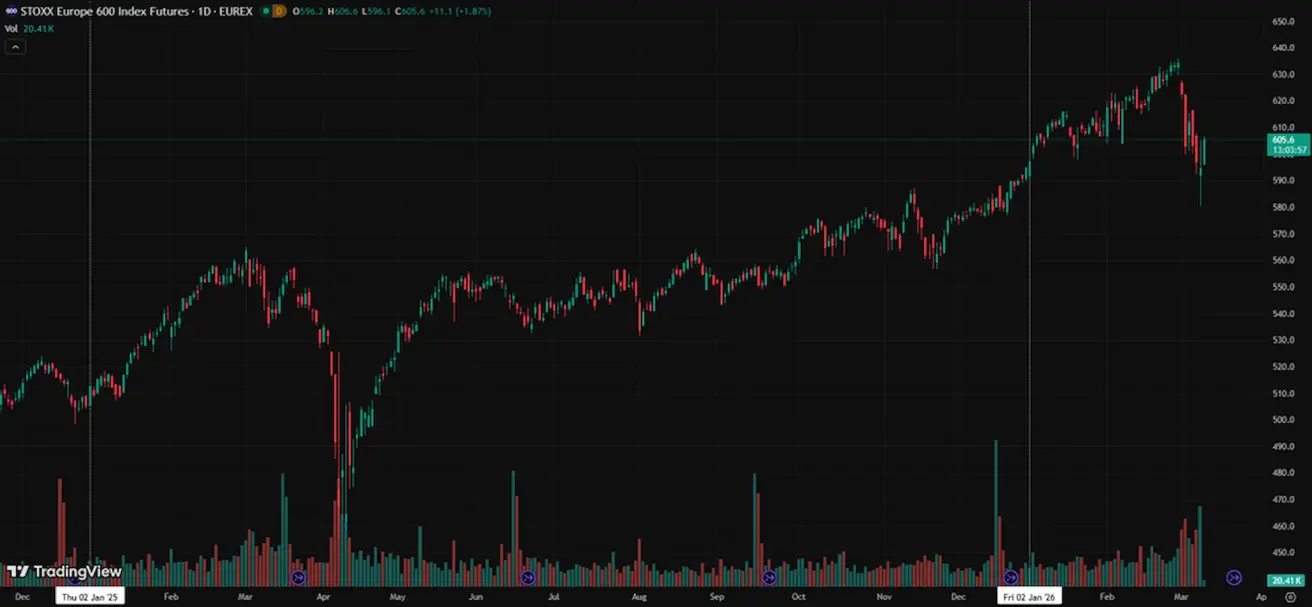
С момента эскалации конфликта индекс снизился более чем на 8% от недавних максимумов. С тех пор он отскочил на +4,5% от вчерашнего минимума.
Это движение напрямую связано с ростом энергетических рисков. Хотя зависимость Европы от поставок нефти через Ормузский пролив относительно невелика — около 3%, европейская экономика остается значительно более чувствительной к ценам на энергоносители, особенно на природный газ.
Природный газ — ключевой источник энергии как для промышленности, так и для коммунального сектора. В отличие от США, где в энергобалансе доминируют нефть и относительно дешевый внутренний газ, в Европе газ широко используется в промышленности, включая химию, металлургию, производство удобрений, стекла и цемента, а также для генерации электроэнергии.
В этих секторах газ является не только топливом, но и важнейшим сырьем, поэтому рост цен напрямую увеличивает производственные издержки.
Европа остается чистым импортером природного газа, значительная часть поставок поступает в виде СПГ, цены на который напрямую зависят от мировых рынков. Это делает европейский энергетический рынок крайне чувствительным к геополитическим рискам.
Передача инфляции в еврозоне происходит относительно быстро, учитывая центральную роль газа как в генерации электроэнергии, так и в промышленности. По мере роста цен эффекты быстро отражаются на:
- PPI (инфляция цен производителей)
- Транспортных расходах
- Тарифах на коммунальные услуги
Впоследствии часть этих издержек переходит в CPI (потребительскую инфляцию), что может привести к ужесточению денежно-кредитной политики.
Китай
Экономика стабилизируется в первую очередь за счет экспорта, внутренний спрос и инвестиции остаются слабыми. Стимулирующие меры по-прежнему адресные и осторожные.
Процентные ставки остаются без изменений;
Денежно-кредитная политика остается стимулирующей;
Китай объявил о продолжении фискальной поддержки экономического роста в рамках плана на 2026 год, включая меры по стимулированию внутреннего спроса, оптимизации налоговых льгот и субсидий, а также модернизации промышленности.
Процентные ставки
- 1-летняя базовая ставка по кредитам (среднесрочное кредитование): 3,00%
- 5-летняя базовая ставка по кредитам (ориентир для ипотечных кредитов): 3,50%
Инфляционные показатели (январь)
- Индекс потребительских цен (CPI):
- м/м: 0,2% (пред.: 0,2%)
- г/г: 0,2% (пред.: 0,8%)
- Индекс цен производителей (PPI) (г/г): –1,4% (пред.: –1,9%)
ВВП (4 кв., окончательная оценка)
- Квартал к кварталу: 1,2% (пред.: 1,1%)
- Год к году: 4,5% (пред.: 4,8%)
Уровень безработицы (январь)
- 5,1% (пред.: 5,1%).
Промышленное производство / инвестиции / розничные продажи
- Промышленное производство (январь, г/г): 5,9% (пред.: 4,8%).
- Инвестиции в основной капитал (январь, г/г): –3,8% (пред.: –2,6%).
- Розничные продажи (январь, г/г): 0,9% (пред.: 1,3%).
Торговые показатели
- Импорт (январь, г/г): 5,7% (пред.: 1,9%)
- Экспорт (январь, г/г): 6,6% (пред.: 5,9%)
- Торговый баланс (январь): $114,30 млрд (пред.: $111,68 млрд)
Индекс деловой активности (PMI) (февраль)
- Промышленность: 49,0 (пред.: 49,3)
- Сфера услуг: 49,5 (пред.: 49,4)
- Композитный PMI: 49,5 (пред.: 49,8).
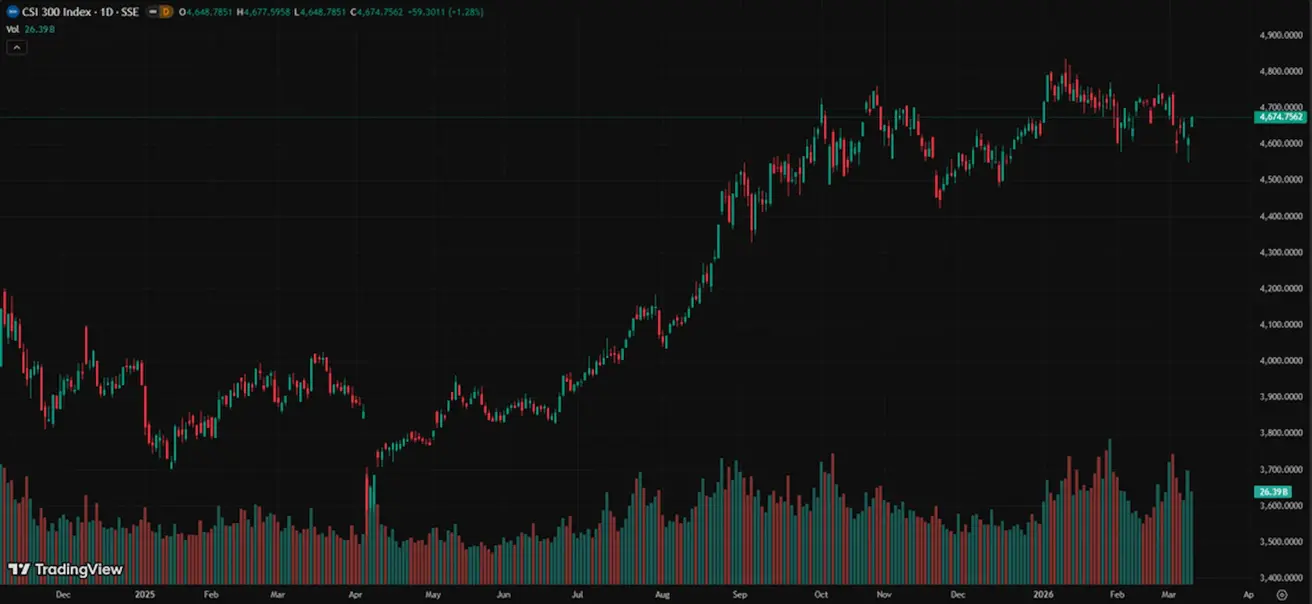
CSI 300 INDEX (000300.HK)
- Итог за неделю: –1,44% (закрытие недели: 4 660,43); с начала года: +0,66%. С начала недели: +1,78%.
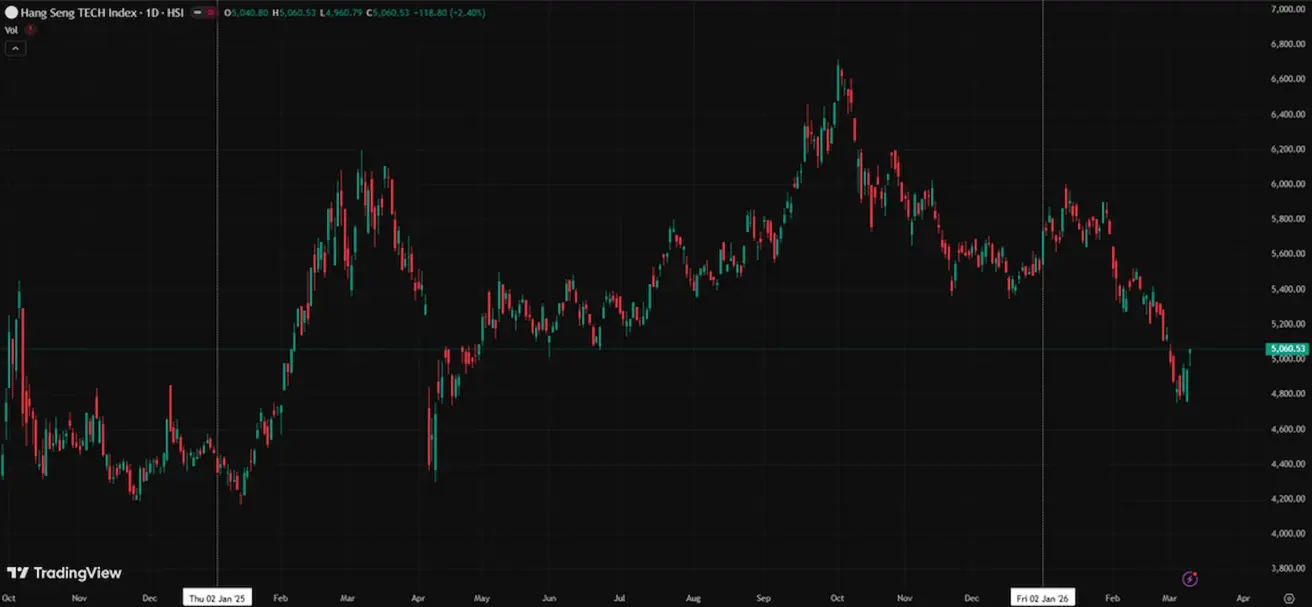
Hang Seng TECH Index (HSTECH)
- Итог за неделю: –3,70% (закрытие недели: 4 947,50); с начала года: –10,12%.
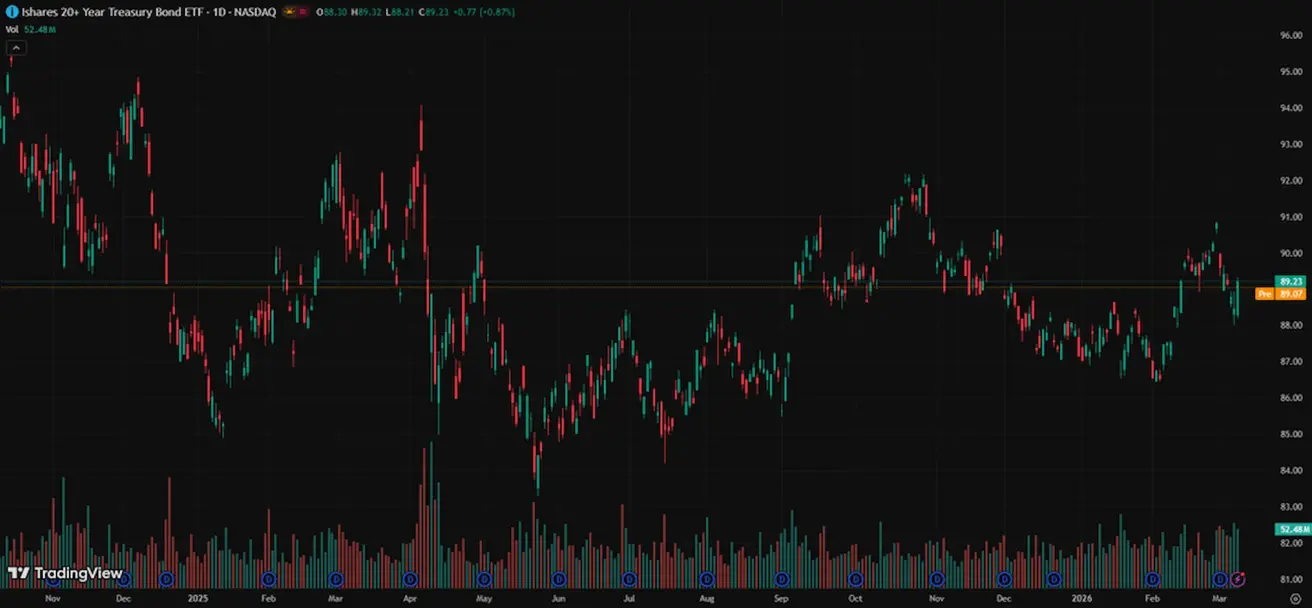
ДОЛГОВОЙ РЫНОК
- Долгосрочные гособлигации США (ETF TLT, 20+ лет): –2,60% за неделю (закрытие недели: 88,46); с начала года: +1,49%.
ДОХОДНОСТИ И СПРЕДЫ
- Рыночная доходность 10-летних казначейских облигаций США: 4,12% (пред.: 3,98%); доходность 2-летних облигаций: 3,57% (пред.: 3,40%);
- ICE BofA BBB US Corporate Index Effective Yield: 5,09% (пред.: 4,91%)
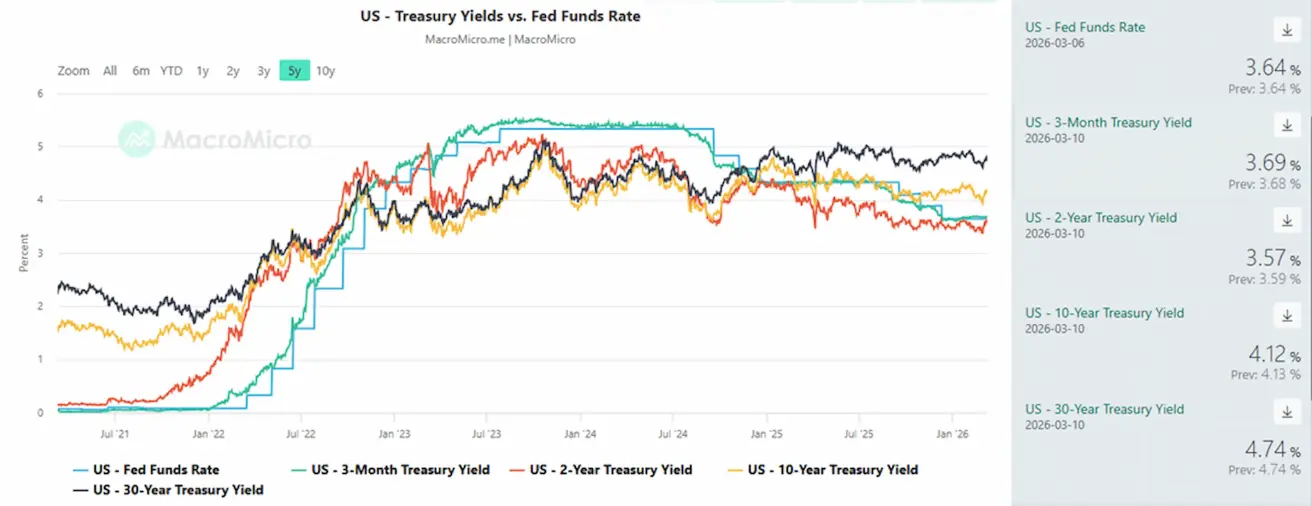
- Спред доходности между 10-летними и 2-летними казначейскими облигациями США составляет 55 базисных пунктов (пред.: 58).
- Спред между 10-летними и 3-месячными казначейскими облигациями США — 43 базисных пункта (пред.: 32).
- Стоимость 5-летнего кредитного дефолтного свопа (CDS) США (страхование от дефолта) — 33,30 б.п. (против 31,03 б.п. на прошлой неделе).
ФЬЮЧЕРСЫ НА ЗОЛОТО (GC)
- Итог за неделю: –1,70% (закрытие недели: $5 158,7 за тройскую унцию); с начала года: +19,08%.
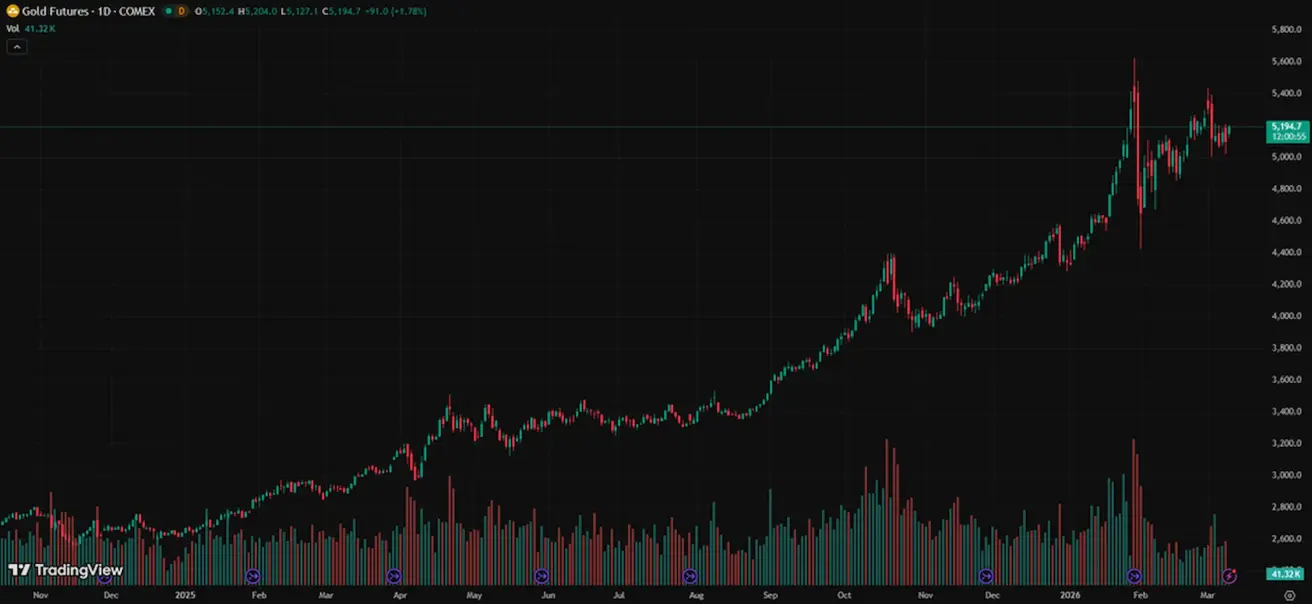
Несмотря на рост геополитической напряженности, золото снизилось примерно на 5% с начала конфликта. Рынок золота пока не закладывает геополитическую премию.
ФЬЮЧЕРСЫ НА НЕФТЬ
- Итог за неделю: +35,63% (закрытие недели: $90,90 за баррель). С начала года: +58,33%.
- OPEC+ объявила об увеличении предложения на 201 тыс. баррелей в сутки (0,2% мирового предложения);
- Геополитические риски в регионе Ближнего Востока.
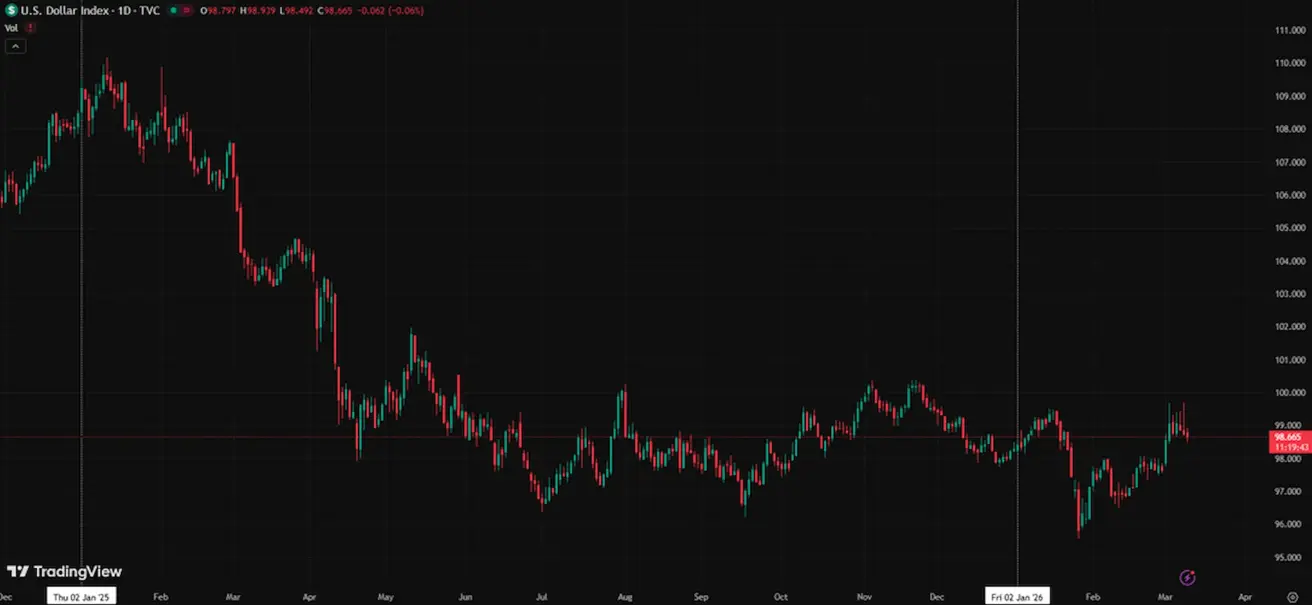
ФЬЮЧЕРСЫ НА ИНДЕКС ДОЛЛАРА (DX)
- Итог за неделю: +1,24% (закрытие недели: 98,855). С начала года: +0,88%.
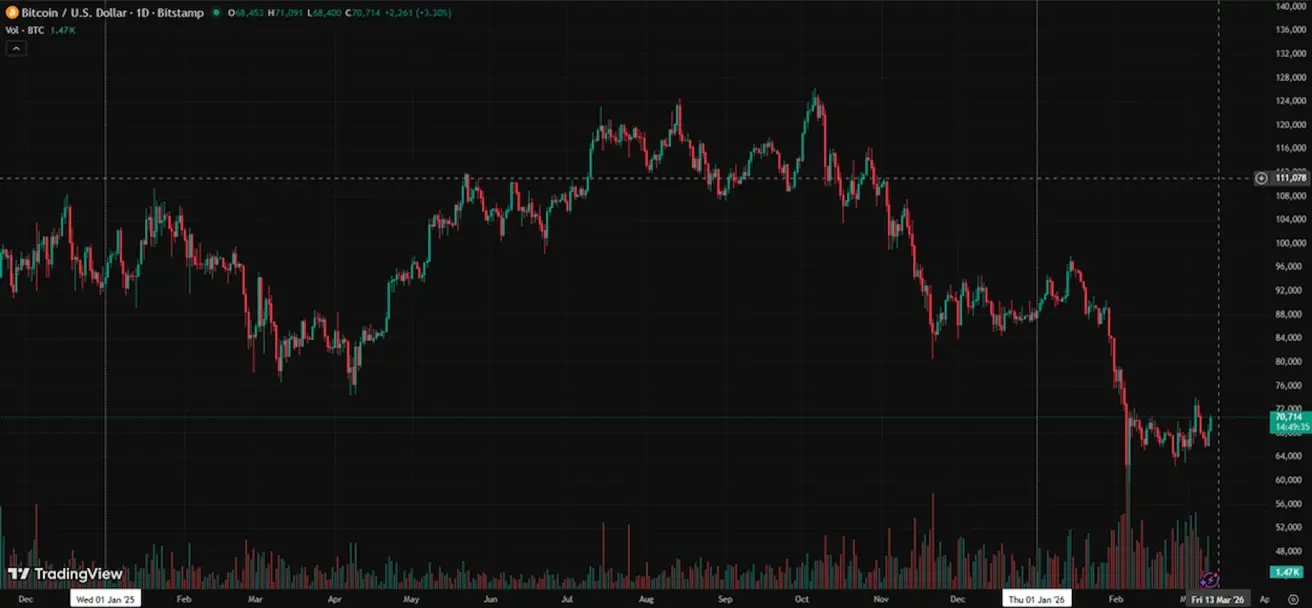
ФЬЮЧЕРСЫ НА BTC
- Итог за неделю: +0,17% (закрытие недели: $65 975); с начала года: –24,79%. Рост с начала недели: +7,07%.
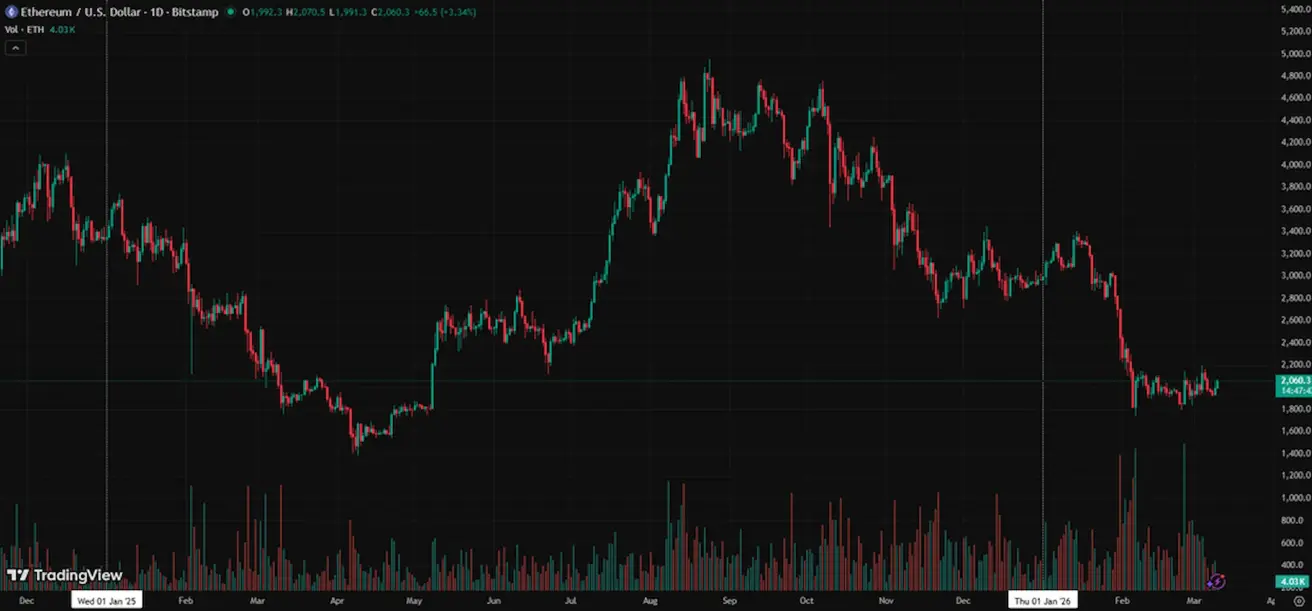
ФЬЮЧЕРСЫ НА ETH
- Итог за неделю: –0,10% (закрытие недели: $1 937,4); с начала года: –34,85%. Рост с начала недели: +6,13%.
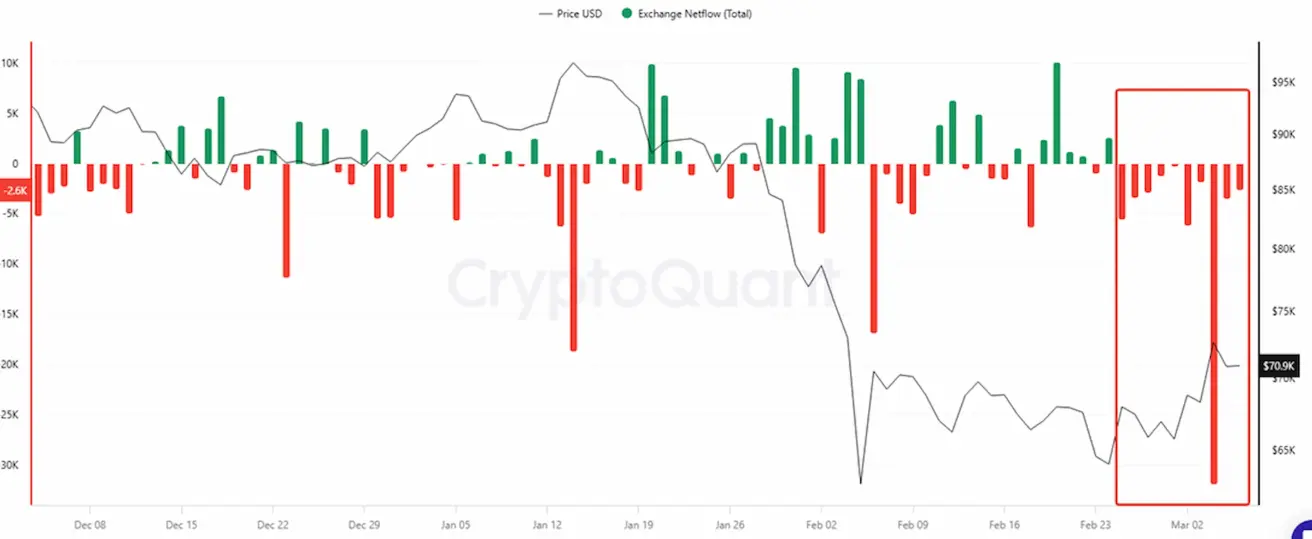
Чистый поток Bitcoin на централизованные биржи
Чистые потоки Bitcoin на централизованные биржи.
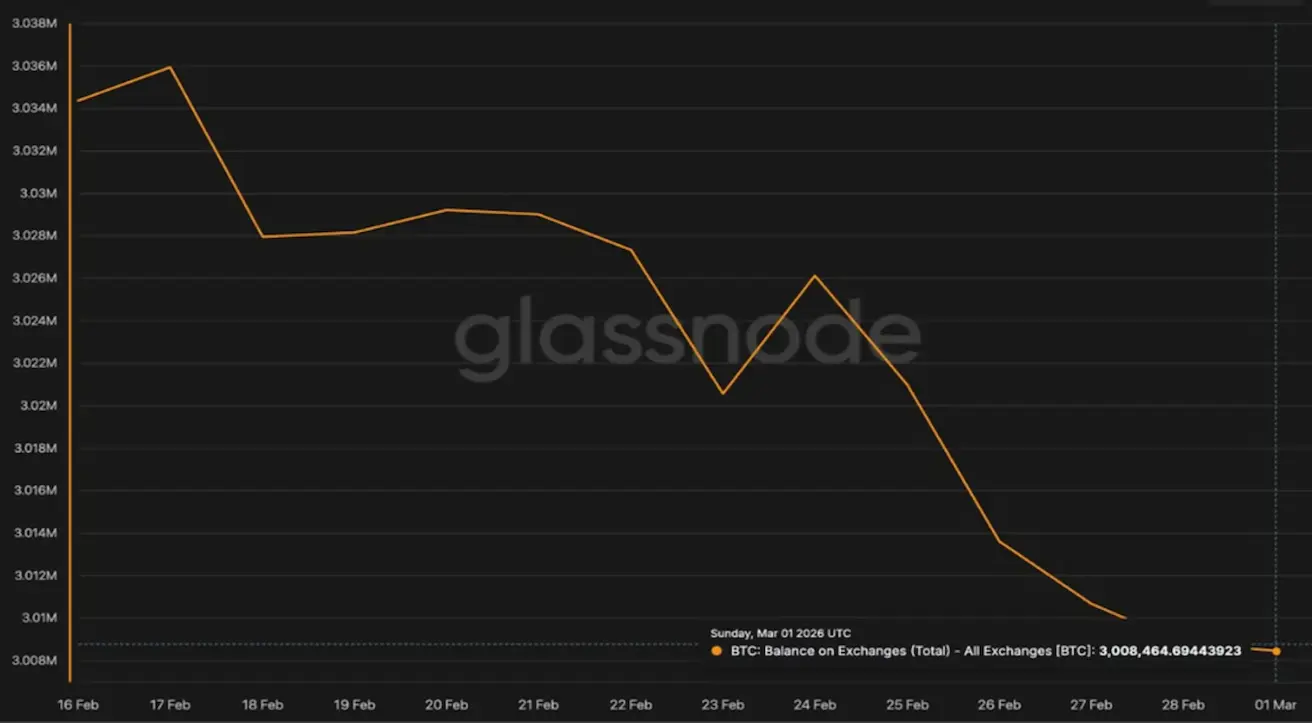
Общий баланс Bitcoin на централизованных биржах (BTC: Balance on Exchanges)
За последние три недели на рынке BTC преобладают отрицательные чистые потоки на биржи. Это означает, что объем вывода монет с торговых платформ превышает приток.
Эта тенденция сопровождается снижением общего баланса BTC на биржах (нижний график). Баланс снизился примерно до 3,01 млн BTC — минимального уровня с 2018 года.
Одновременно продажи со стороны долгосрочных держателей снизились примерно на 87%. Такое сочетание метрик указывает на продолжающийся отток ликвидности с бирж и может свидетельствовать о переходе части инвесторов к долгосрочному хранению.
Исторически аналогичные периоды соответствовали фазам накопления или консолидации рынка после коррекций и сопровождались снижением краткосрочного давления продаж.
Bitcoin и геополитический риск
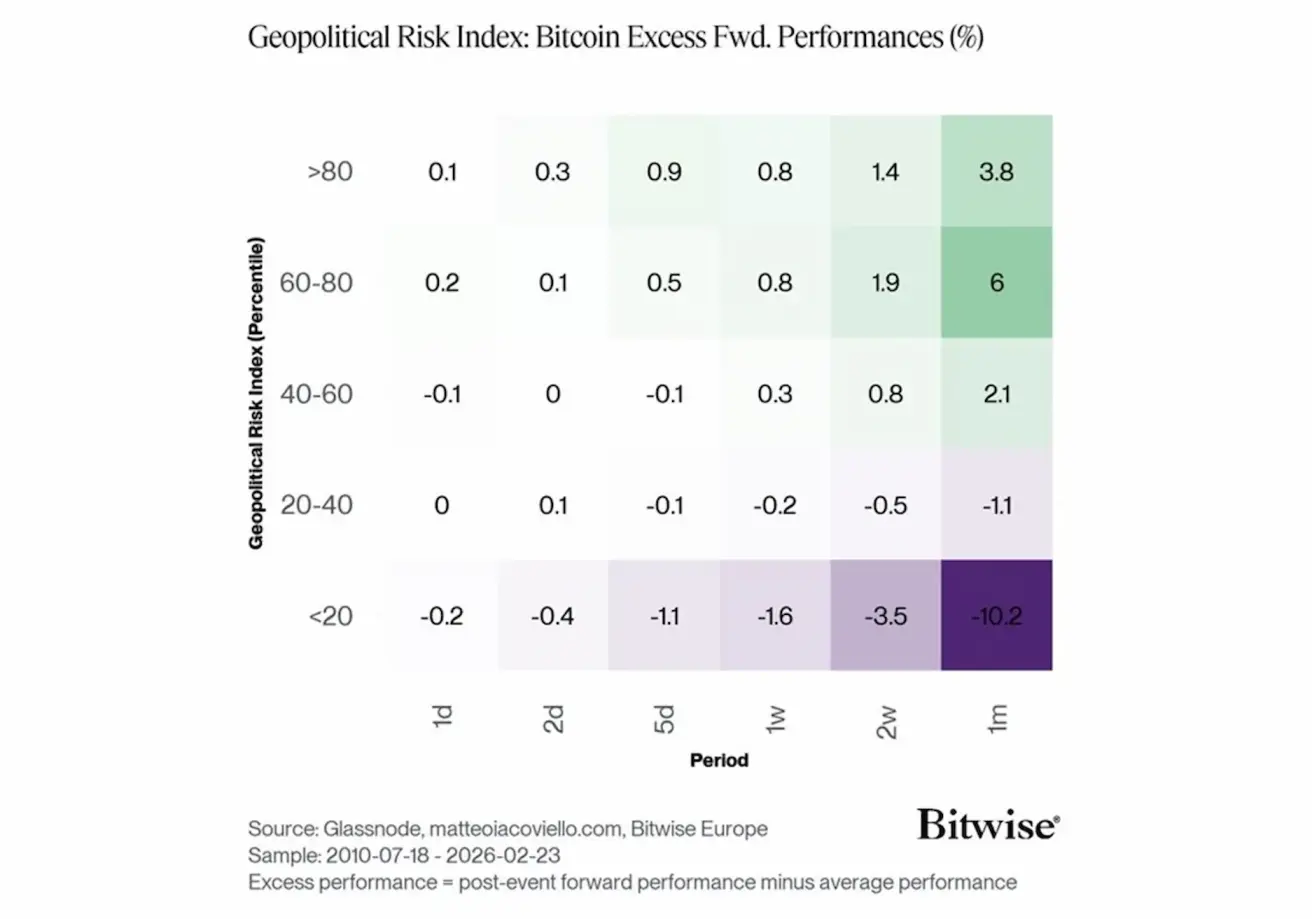
График Bitwise показывает, как ведет себя доходность Bitcoin после периодов повышенного геополитического риска. Анализ основан на индексе геополитического риска (GPR), который делится на перцентили (уровни напряженности). Затем рассчитывается избыточная доходность BTC на различных горизонтах — от 1 дня до 1 месяца.
Данные показывают: чем выше уровень геополитической напряженности, тем выше последующая доходность Bitcoin. Когда индекс риска находится в верхних перцентилях (60–80 и >80), средняя избыточная доходность BTC через месяц достигает примерно +6% и +3,8% соответственно.
Напротив, в периоды очень низкого геополитического риска (<20-й перцентиль) доходность Bitcoin часто отрицательна, достигая –10,2% через месяц.
Это может свидетельствовать о том, что в периоды повышенной неопределенности часть капитала рассматривает BTC как альтернативный защитный актив или инструмент диверсификации.
ОБЩАЯ РЫНОЧНАЯ КАПИТАЛИЗАЦИЯ КРИПТОВАЛЮТ
- Общая рыночная капитализация криптовалют: $2,4 трлн (против $2,28 трлн неделей ранее) (coinmarketcap.com).
- Доли рынка криптоактивов:
- Bitcoin: 58,8% (58,1%)
- Ethereum: 10,4% (10,3%)
- Прочие: 30,8% (31,7%).
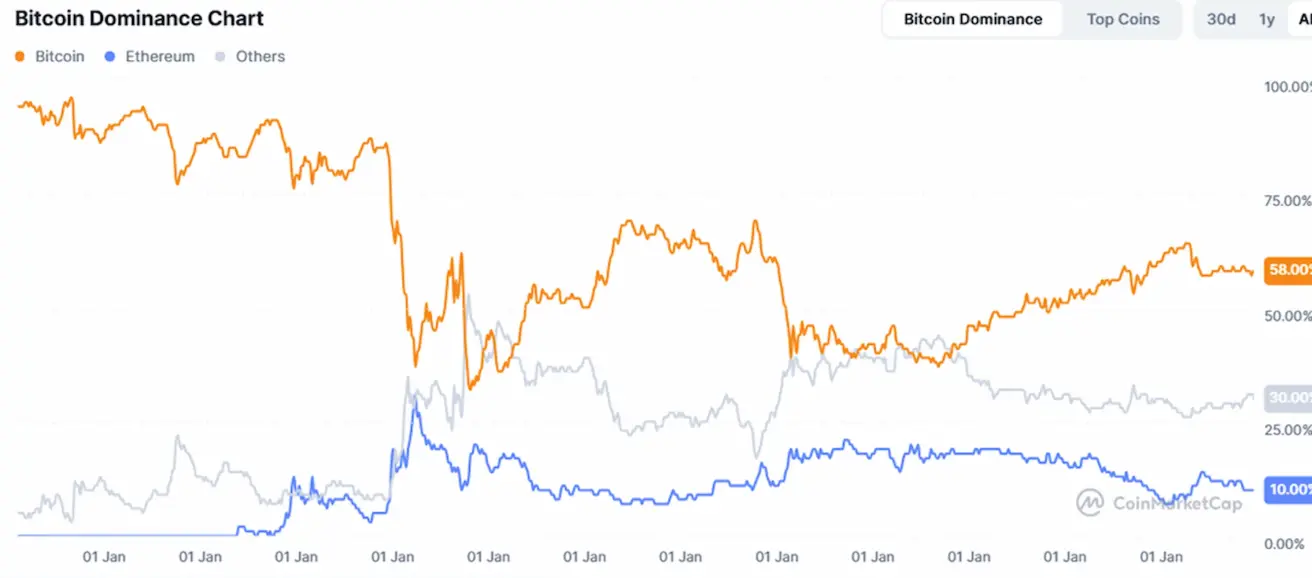
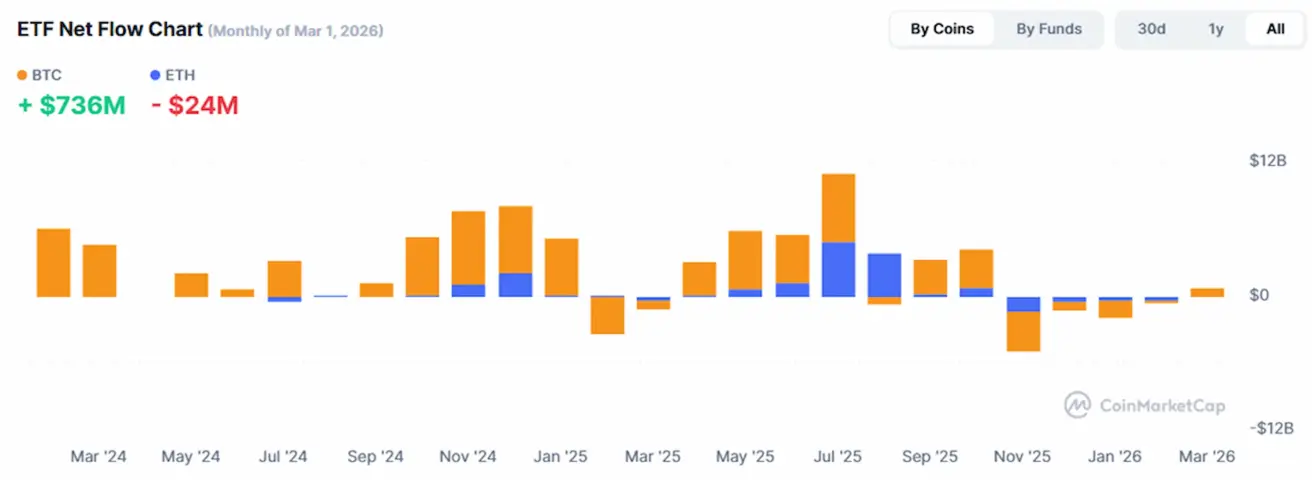
График чистых потоков ETF: