English
 Lietuvių
 Қазақша
 Eesti
Eesti30 марта – 5 апреля 2026 года: Еженедельный экономический обзор
Ключевые обновления рынка

США (ключевые выводы)
- Ключевая ставка осталась без изменений; тон заявлений осторожный;
- Денежно-кредитная политика остается умеренно сдержанной;
- Макроэкономические данные США продолжают поддерживать сценарий мягкой посадки: инфляционные риски растут, рынок труда охлаждается без признаков рецессии, и нет необходимости в немедленном снижении ставок.
Основные тезисы выступления Джерома Пауэлла в Гарвардском университете, Кембридж, Массачусетс:
- «Долгосрочные инфляционные ожидания остаются хорошо закрепленными»;
- «Политика находится в хорошем положении, чтобы подождать» — нет необходимости срочно смягчать или ужесточать условия.
Макроэкономическая статистика
ИНФЛЯЦИЯ: ИНДЕКС ПОТРЕБИТЕЛЬСКИХ ЦЕН (ФЕВРАЛЬ):
- Базовый ИПЦ: (м/м) 0,2% (пред.: 0,3%); (г/г) 2,5% (пред.: 2,5%).
- ИПЦ: (м/м) 0,3% (пред.: 0,2%); (г/г) 2,4% (пред.: 2,4%).
ИНДЕКС ЦЕН ПРОИЗВОДИТЕЛЕЙ (ФЕВРАЛЬ):
- ИПП (м/м): 0,7%, пред.: 0,5%.
- Базовый ИПП (м/м): 0,5%, пред.: 0,8% (пересмотрено):
ИНФЛЯЦИОННЫЕ ОЖИДАНИЯ (МИЧИГАН) (ФЕВРАЛЬ):
- 12-месячные инфляционные ожидания: 3,8%, пред.: 3,4%.
- 5-летние инфляционные ожидания: 3,2%, пред.: 3,3%.
ВВП (Бюро экономического анализа США, BEA) (4 кв. 2025, в годовом выражении, вторая оценка): +0,7% (3 кв. 2025: +4,4%):
Индикатор GDPNow (оперативная оценка официального ВВП до его публикации) Федерального резервного банка Атланты: 1,6% (предыдущее значение: 2,3%).
ИНДЕКС ДЕЛОВОЙ АКТИВНОСТИ (PMI) (МАРТ, ПРЕДВАРИТЕЛЬНЫЕ ДАННЫЕ):
(Значение выше 50 — рост, ниже 50 — спад)
- Сектор услуг: 51,1 (пред.: 51,7);
- Промышленный сектор: 52,4 (пред.: 51,6);
- S&P Global Composite: 51,4 (пред.: 51,9).
РЫНОК ТРУДА (BLS) (ФЕВРАЛЬ)
- Уровень безработицы: 4,3% (пред.: 4,4%);
- Общее число продолжающих получать пособие по безработице в США: 1 819 тыс. (пред.: 1 851 тыс.);
- Первичные заявки на пособие по безработице: 202 тыс. (пред.: 211 тыс.);
- Изменение числа рабочих мест вне сельского хозяйства: 178 тыс. (пред.: -133 тыс.);
- Изменение числа частных рабочих мест вне сельского хозяйства: 186 тыс. (пред.: -129 тыс.);
- Средний рост почасовой оплаты труда (г/г): 3,5% (пред.: 3,8%);
- Открытые вакансии JOLTS: 6,542 млн (пред.: 6,928 млн).
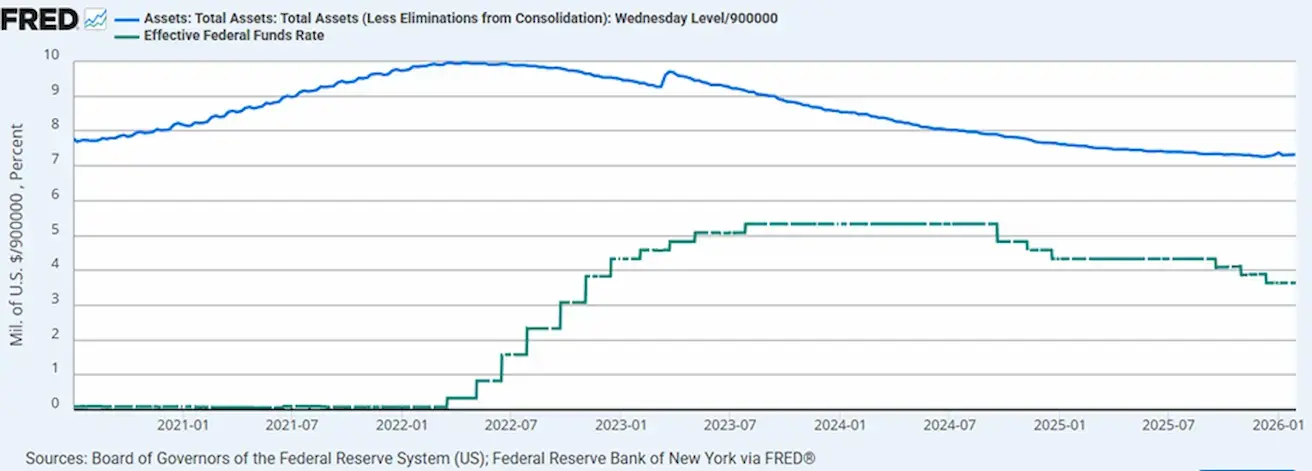
ДЕНЕЖНО-КРЕДИТНАЯ ПОЛИТИКА
- Эффективная ставка по федеральным фондам (EFFR): 3,50%–3,75%;
- Баланс Федеральной резервной системы составляет $6,675 трлн, рост на 2,14% с момента приостановки QT ($6,535 трлн):
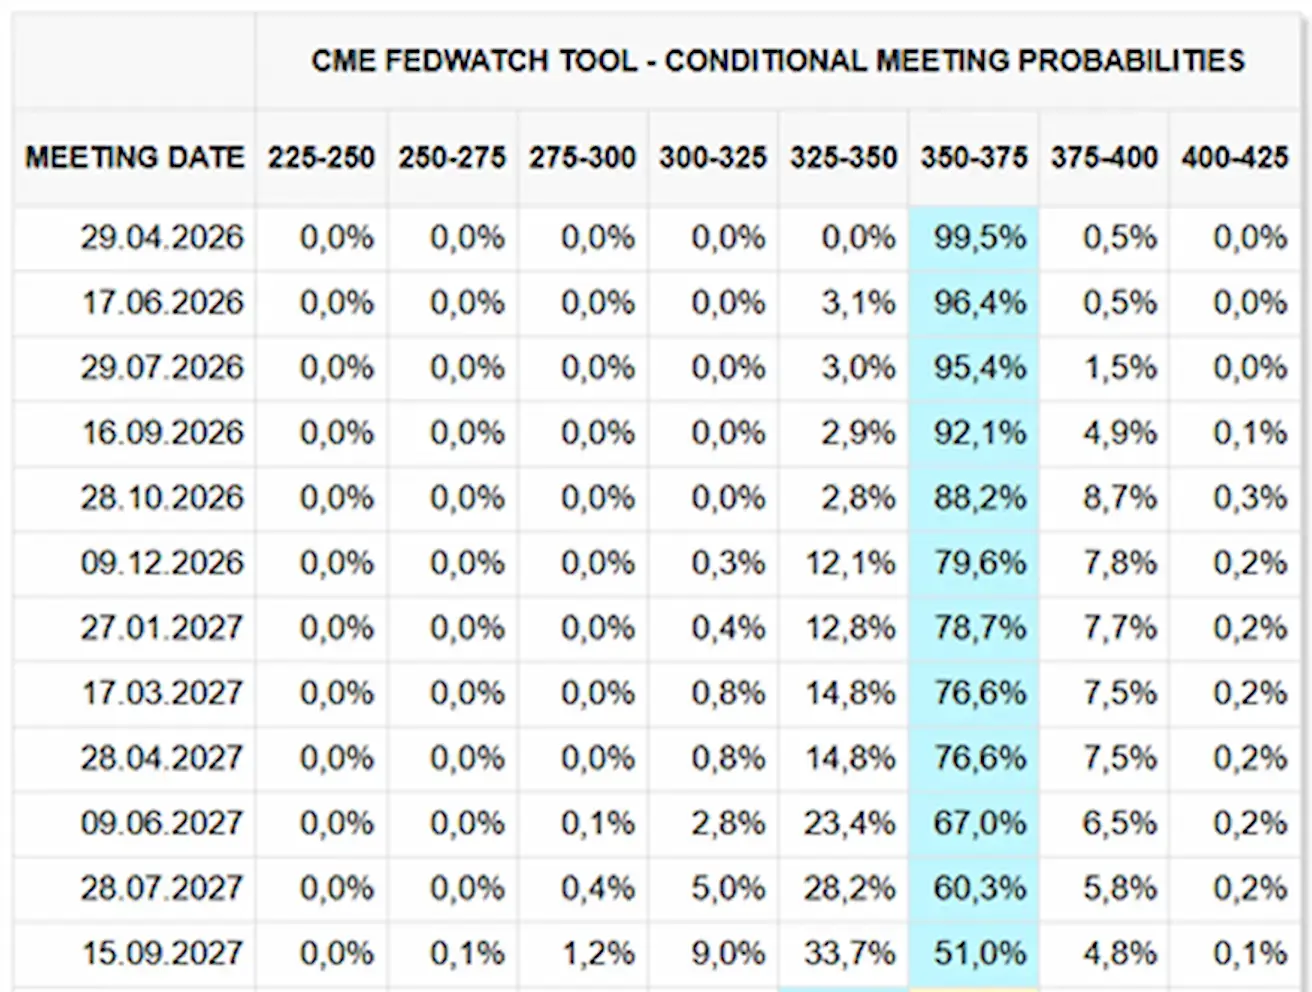
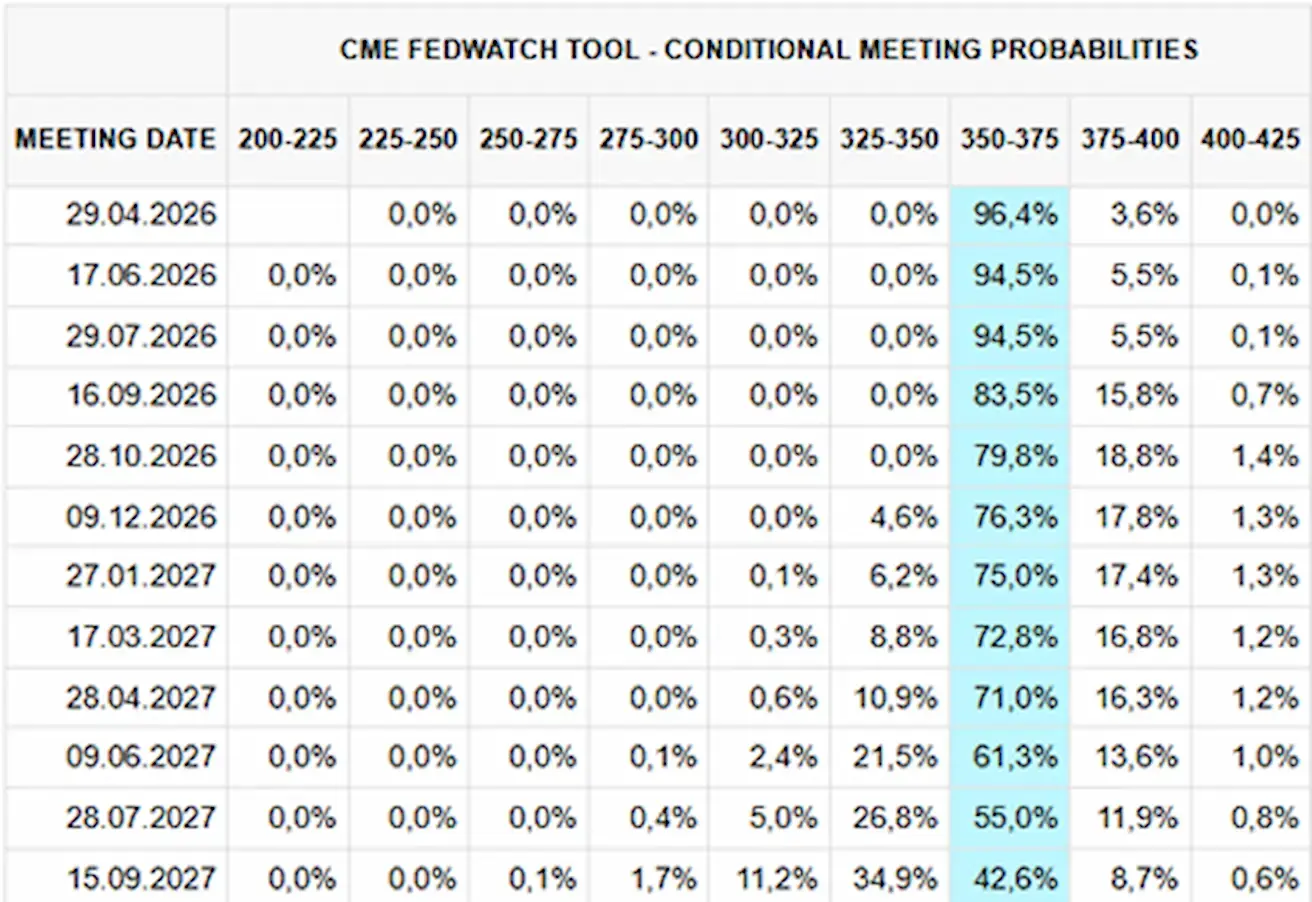
ПРОГНОЗ РЫНКА ПО СТАВКЕ (FEDWATCH)
На предстоящем заседании (29 апреля) вероятность сохранения текущей ключевой ставки оценивается в 99,48%:
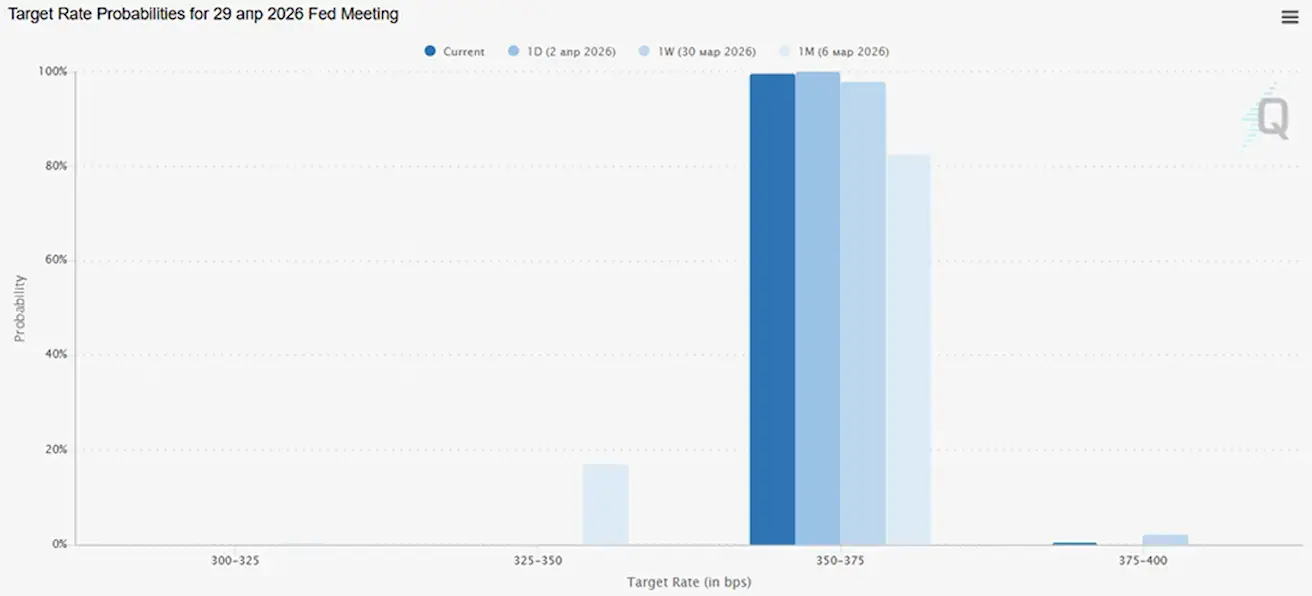
В течение следующих 12 месяцев рынок не закладывает снижение ставок:
Сегодня:
Неделей ранее:
Пауэлл, выступая в Кембридже по вопросу частного кредитования:
«На данном этапе мы не наблюдаем распространения проблем из сектора частного кредитования. Финансовая система в настоящее время устойчива, а частный кредит составляет относительно небольшую долю в общем объеме активов. Мы внимательно следим за развитием ситуации в сфере кредитования частного сектора».
Доля прямого кредитования в общем долге домохозяйств и компаний США составляет всего 3% от их совокупных обязательств:
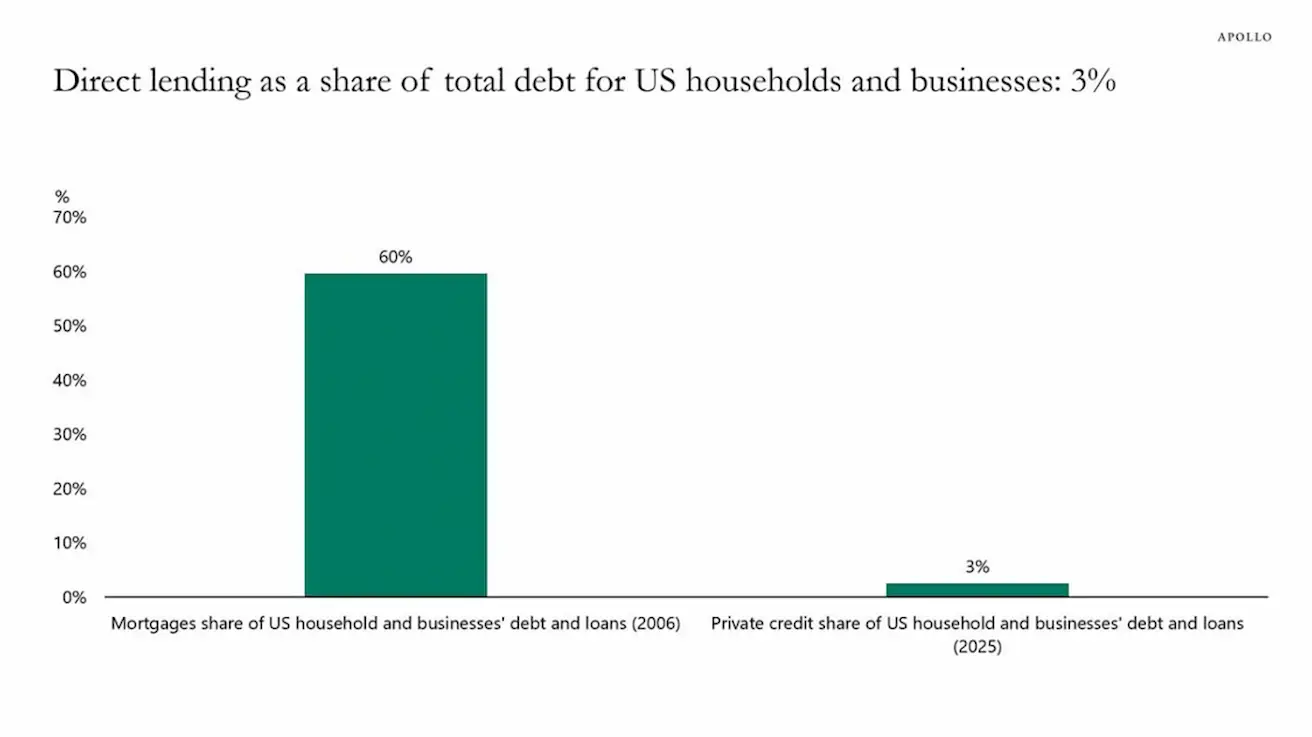
Для сравнения: на пике ипотечного пузыря в 2006 году ипотечные кредиты составляли около 60% общего долга домохозяйств и компаний.
Рынок
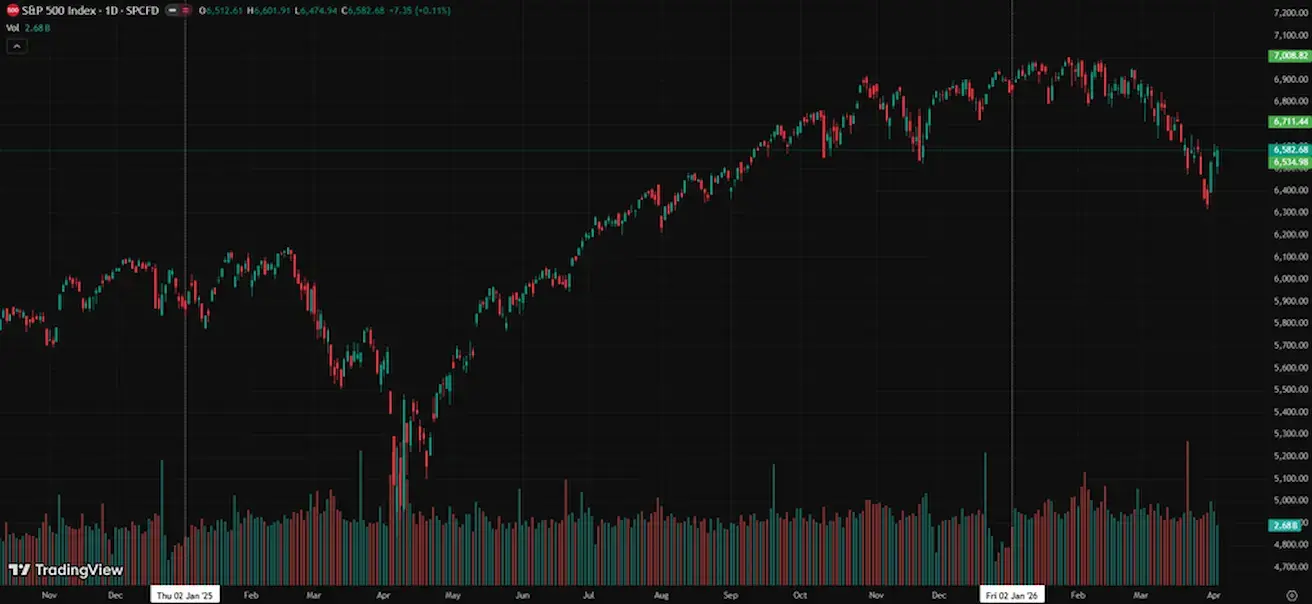
SP500
Динамика за неделю: 3,36% (закрытие недели на уровне 6582,68); с начала года: -3,84%.
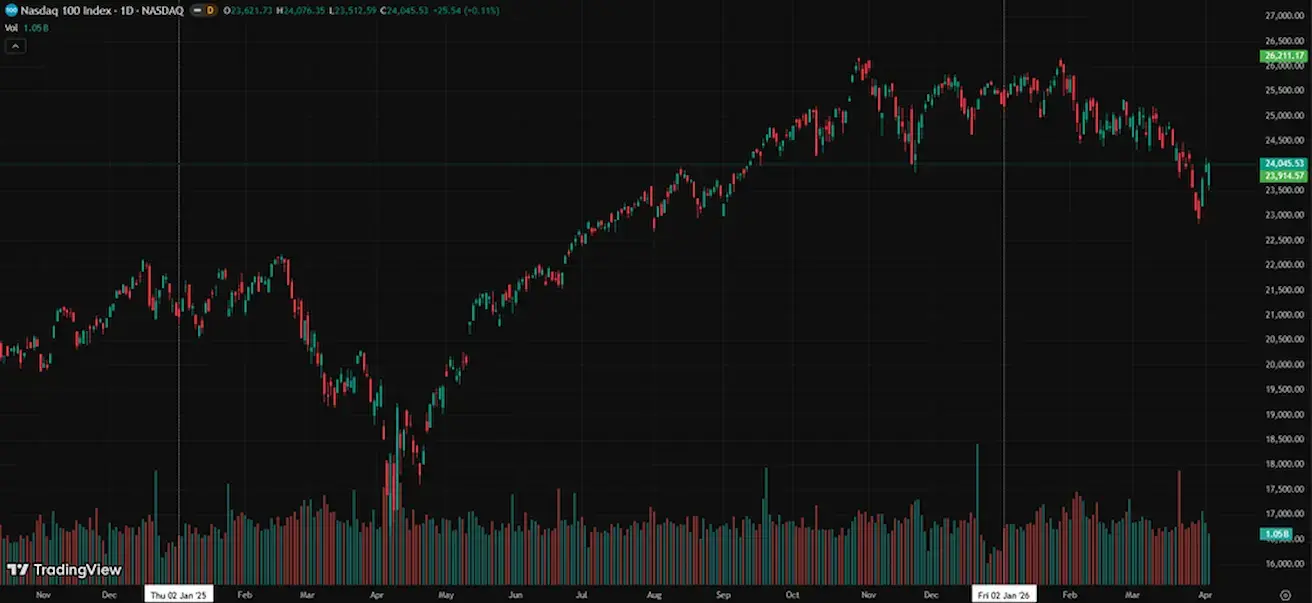
NASDAQ100
Динамика за неделю: +3,95% (закрытие недели на уровне 24045,53); с начала года: -4,77%.
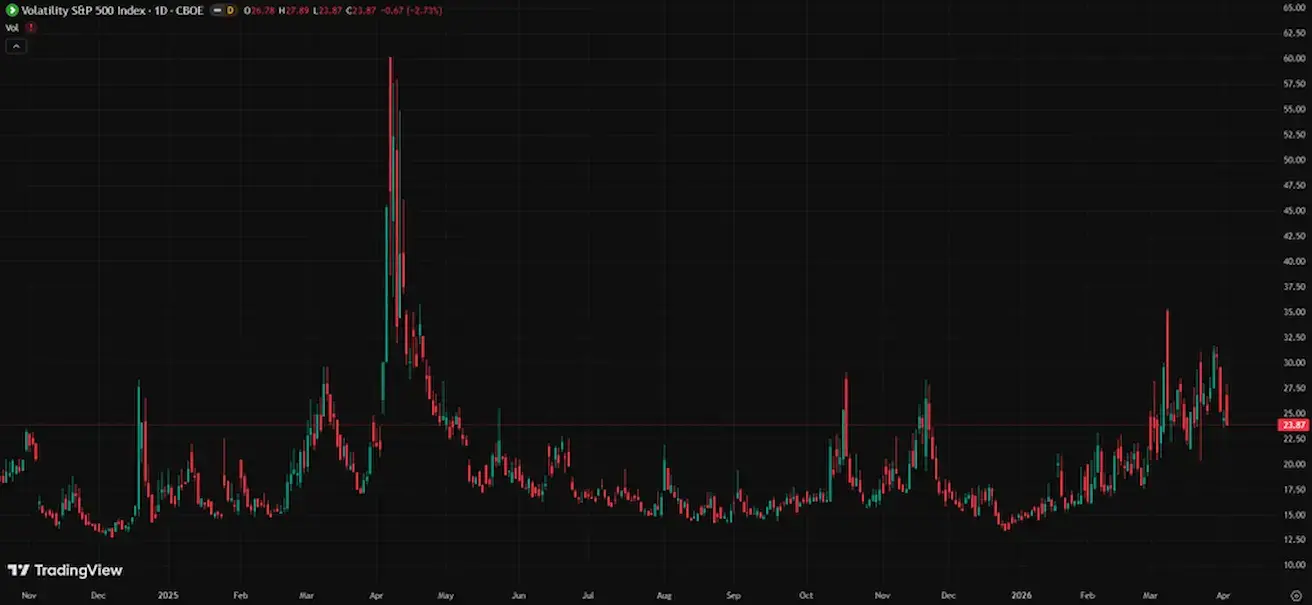
VIX
VIX (индекс волатильности): 23,87
RUSSEL 2000 (RUT)
Динамика за неделю: +3,95% (закрытие недели на уровне 24045,53); с начала года: -4,77%.
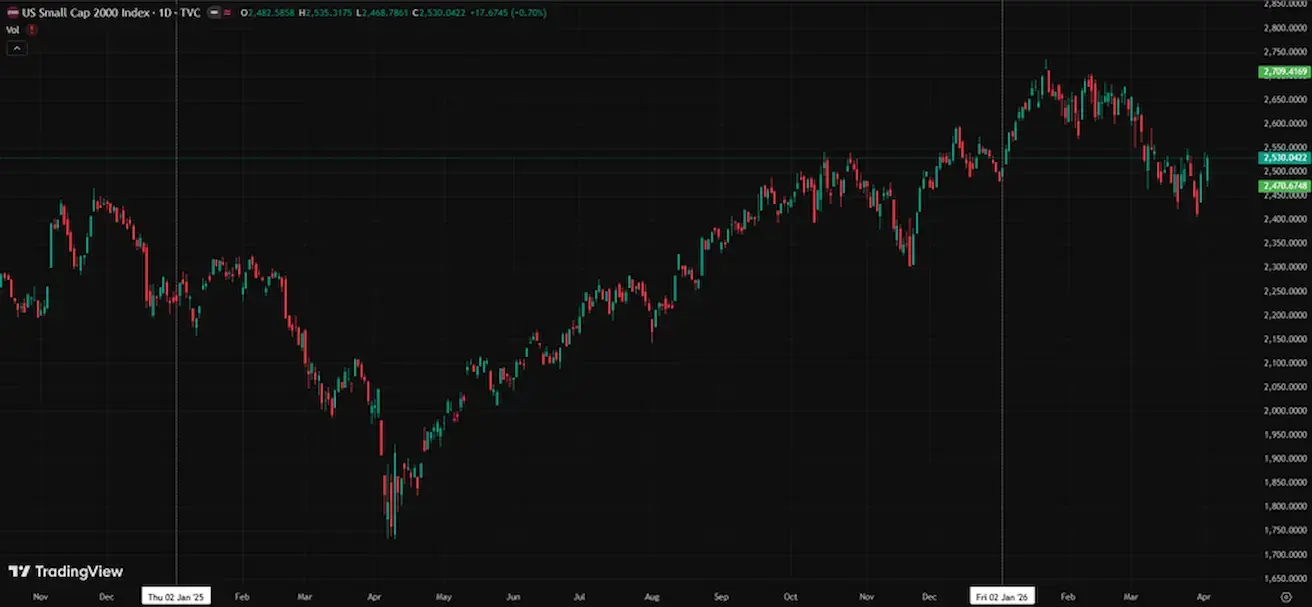
График четырехнедельного изменения 12-месячных прогнозов по прибыли на акцию (EPS) в технологическом секторе S&P 500. Зафиксирован самый значительный рост с 1995 года. Последнее значение: примерно +8–9%.
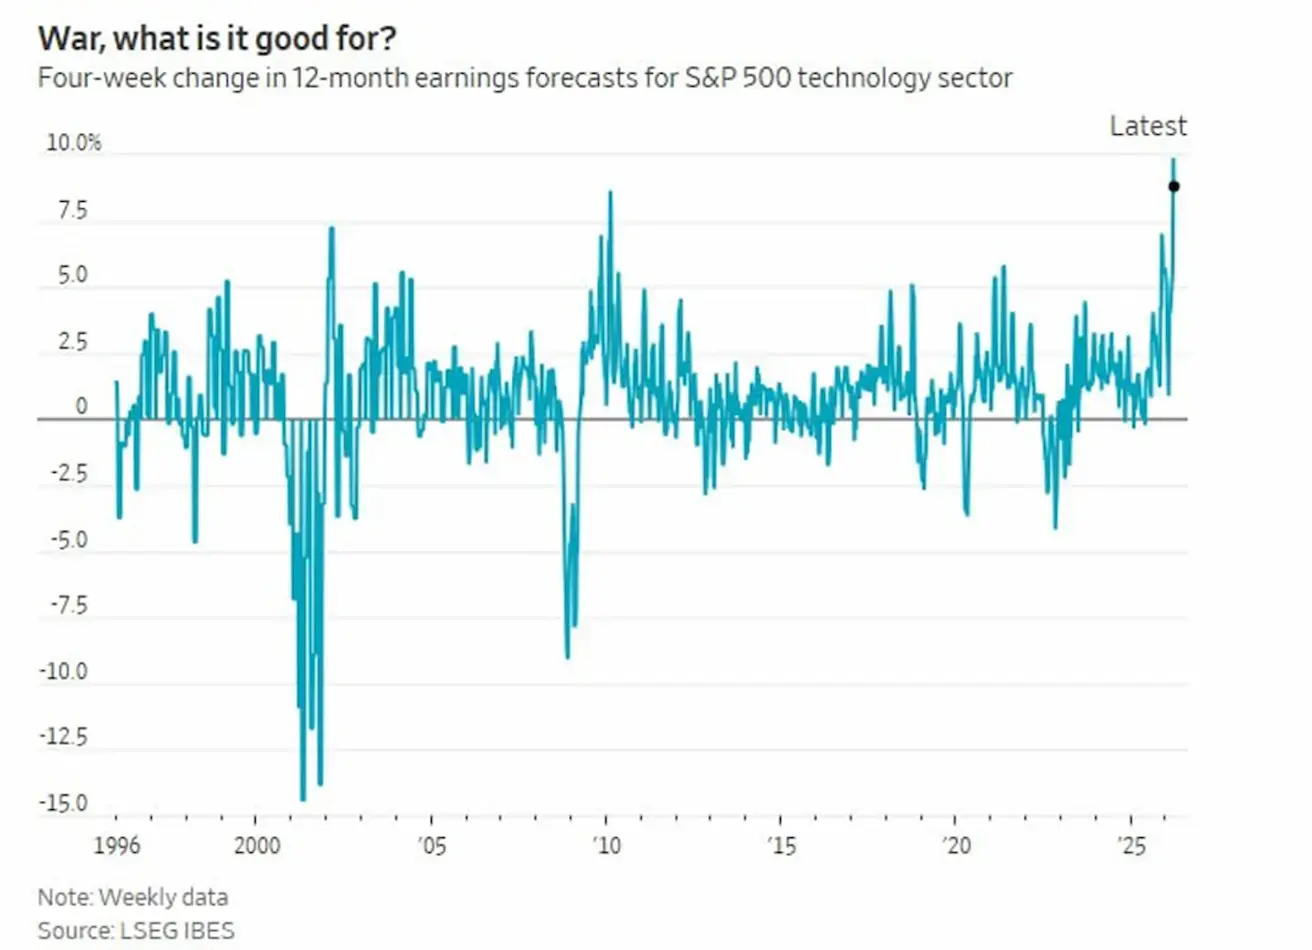
С одной стороны: геополитика → нефть → инфляция → давление на ликвидность. Однако одновременно с этим ожидания по прибыли технологических компаний резко растут.
Это объясняется тем, что в среднесрочной перспективе технологические компании менее чувствительны к ценовым шокам на сырье и не зависят напрямую от нефти, удобрений и других подобных факторов затрат.
В результате маржинальность остается более устойчивой, чему дополнительно способствует масштабный инвестиционный цикл, связанный с искусственным интеллектом.
Динамика корпоративной прибыли (EPS) в США:
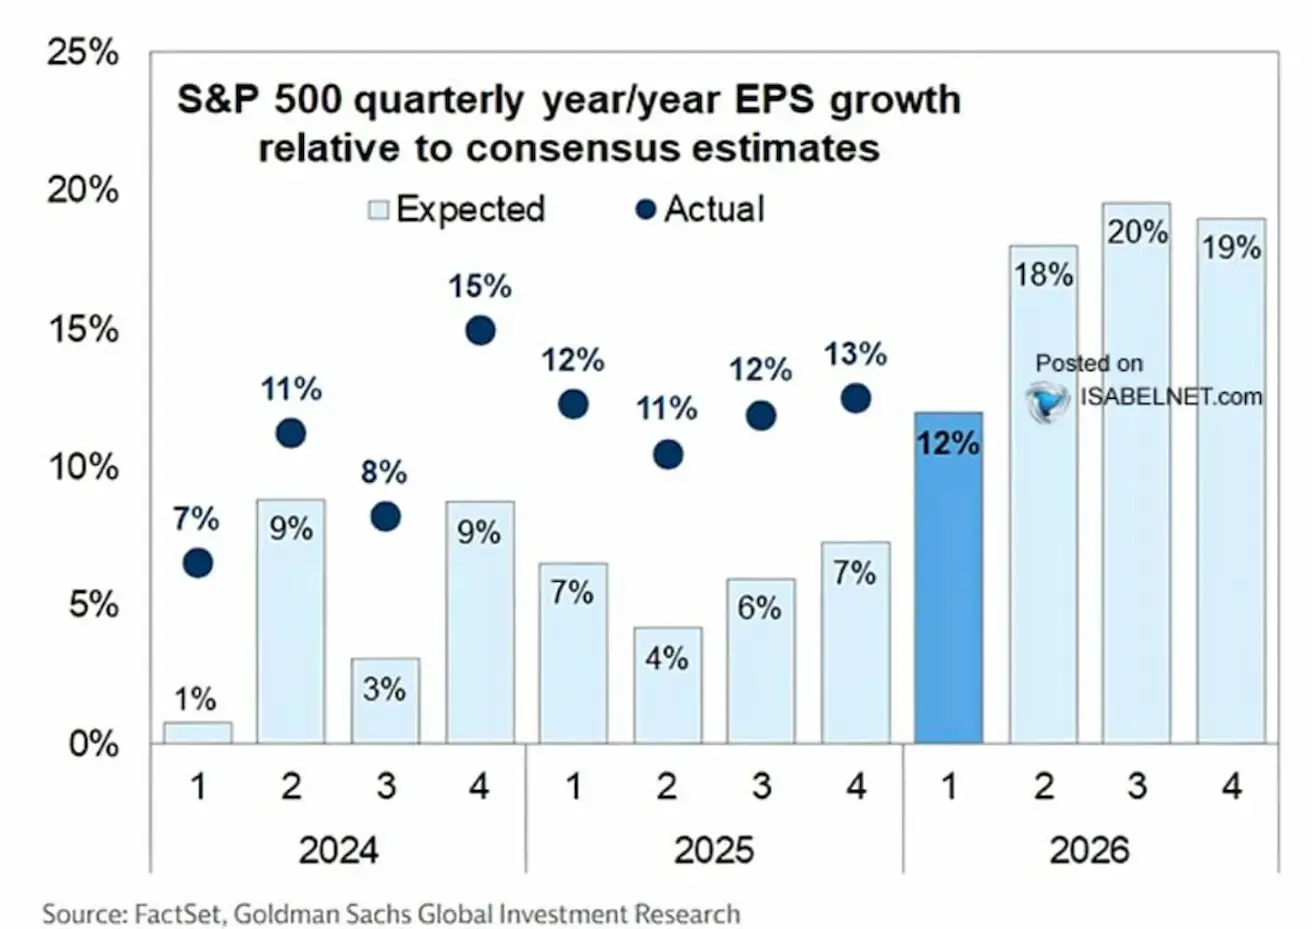
Корпоративная прибыль в США остается ключевой опорой для поддержки рынка. В 2024–2025 годах фактический рост EPS стабильно превышал ожидания аналитиков, формируя устойчивую тенденцию положительных сюрпризов по прибыли.
EPS за 1 квартал 2026 года составил 12%, превысив показатели предыдущих двух лет. В дальнейшем, несмотря на конфликт с Ираном в 2026 году, консенсус-прогноз по-прежнему предполагает сильный годовой рост прибыли на уровне 18–20%.
Еврозона
- Ключевые ставки пока остаются без изменений, однако инфляционные риски возрастают;
- Денежно-кредитная политика в целом нейтральна, но баланс рисков смещен в сторону инфляции;
- В связи с эскалацией конфликта на Ближнем Востоке ЕЦБ пересмотрел прогнозы по ВВП в сторону понижения и повысил прогноз по инфляции на ближайшие годы.
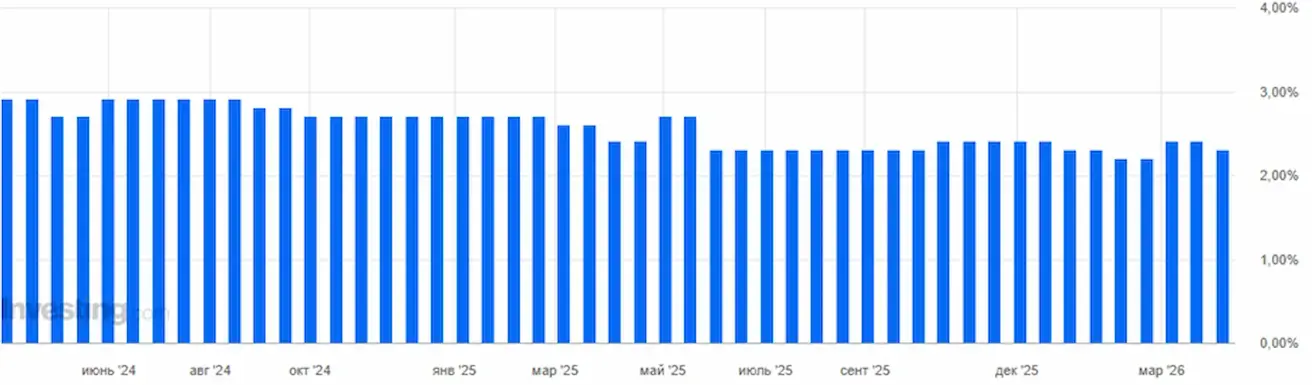
Процентные ставки:
- Ставка по депозитным операциям: 2,0% (пред.: 2,0%);
- Ставка по маржинальным кредитам: 2,4% (пред.: 2,4%) (ставка, по которой банки могут получать овернайт-финансирование от центрального банка);
- Краткосрочная (ключевая) ставка: 2,15% (пред.: 2,15%).
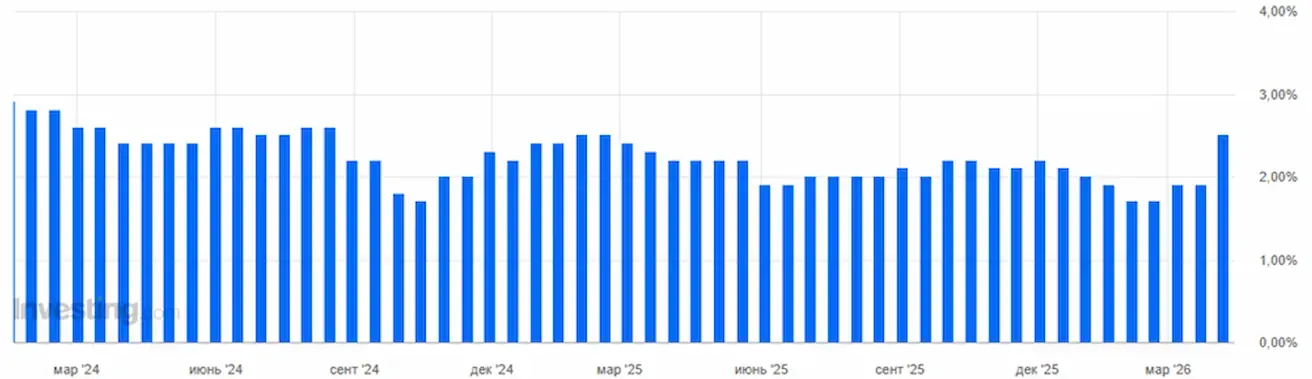
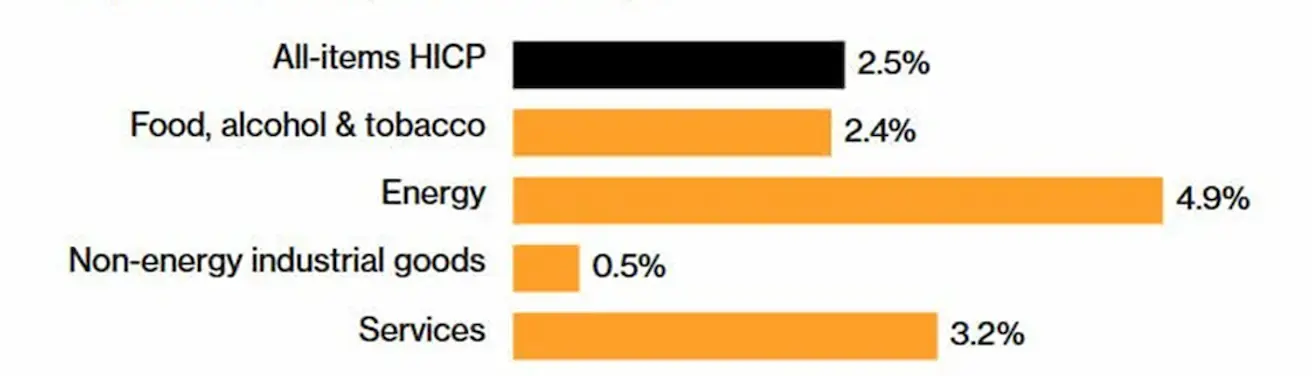
Инфляция: индекс потребительских цен (CPI) (март, предварительные данные):
- Базовый CPI (г/г): 2,3% (пред.: 2,4%):
- CPI (м/м): 1,2% (пред.: 0,6%);
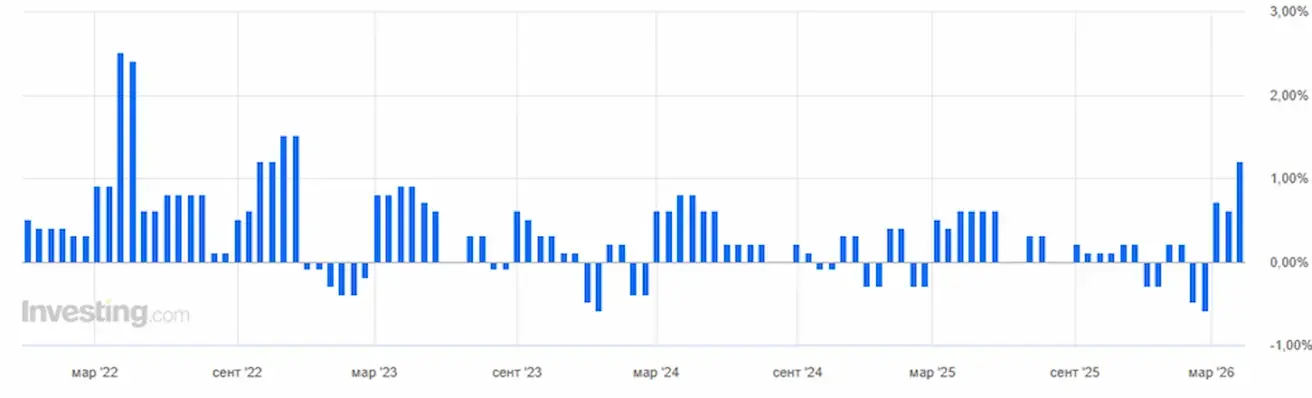
- CPI (г/г): 2,5% (пред.: 1,9%):
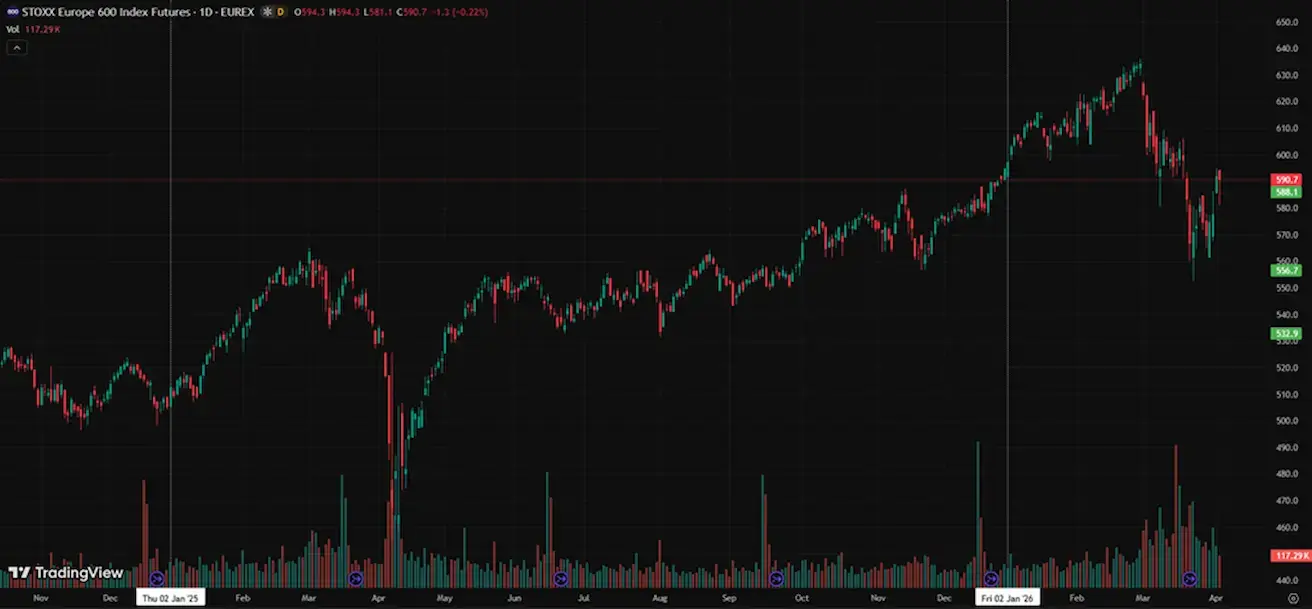
EURO STOXX 600 (FXXP1!)
Динамика за неделю: +3,65% (закрытие недели: 590,7); с начала года: -0,56%.
Китай
Экономика стабилизируется за счет экспорта, в то время как внутренний спрос и инвестиции остаются слабыми; стимулирующие меры адресные и осторожные.
- Ключевые ставки остаются без изменений;
- Денежно-кредитная политика носит стимулирующий характер;
- Китай подтвердил продолжение фискальной поддержки экономического роста в рамках плана на 2026 год (стимулирование внутреннего спроса, оптимизация налоговых льгот и субсидий, индустриальная модернизация).
Процентные ставки:
- 1-летняя базовая ставка по кредитам (среднесрочное кредитование): 3,00%;
- 5-летняя ставка (влияет на ипотеку): 3,50%.
Инфляционные показатели (февраль):
-
Индекс потребительских цен (CPI) (м/м): 0,1% (пред.: 0,2%); (г/г): 1,3% (пред.: 0,2%);
-
Индекс цен производителей (PPI) (г/г): -0,9% (пред.: -1,4%):
-
ВВП за 4 кв. (окончательные данные): кв/кв: 1,2% (пред.: 1,1%); г/г: 4,5% (пред.: 4,8%)
-
Уровень безработицы (февраль): 5,3% (пред.: 5,1%)
-
Промышленное производство (февраль, г/г): 6,3% (пред.: 5,9%)
-
Инвестиции в основной капитал (январь, г/г): -3,8% (пред.: -2,6%)
-
Розничные продажи (январь, г/г): 0,9% (пред.: 1,3%)
-
Импорт (февраль, г/г): 19,8% (пред.: 5,7%)
-
Экспорт (февраль, г/г): 21,8% (пред.: 6,6%)
-
Торговый баланс (USD, февраль): $213,62 млрд (пред.: $114,11 млрд):
Индексы деловой активности (PMI) (февраль):
- Промышленный сектор: 50,1 (пред.: 49,5);
- Непромышленный сектор: 50,4 (пред.: 49,0);
- Композитный индекс: 50,5 (пред.: 49,5).
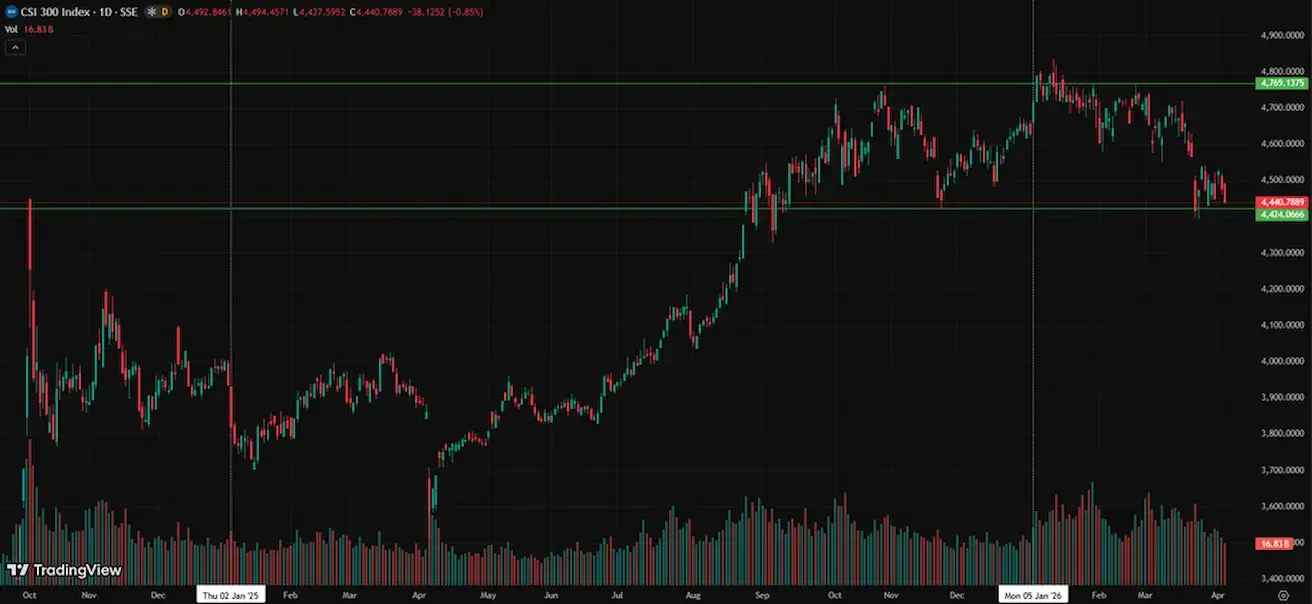
CSI 300 INDEX (000300.HK)
Динамика за неделю: -1,37% (закрытие недели на уровне 4440,7889); с начала года: -4,74%.
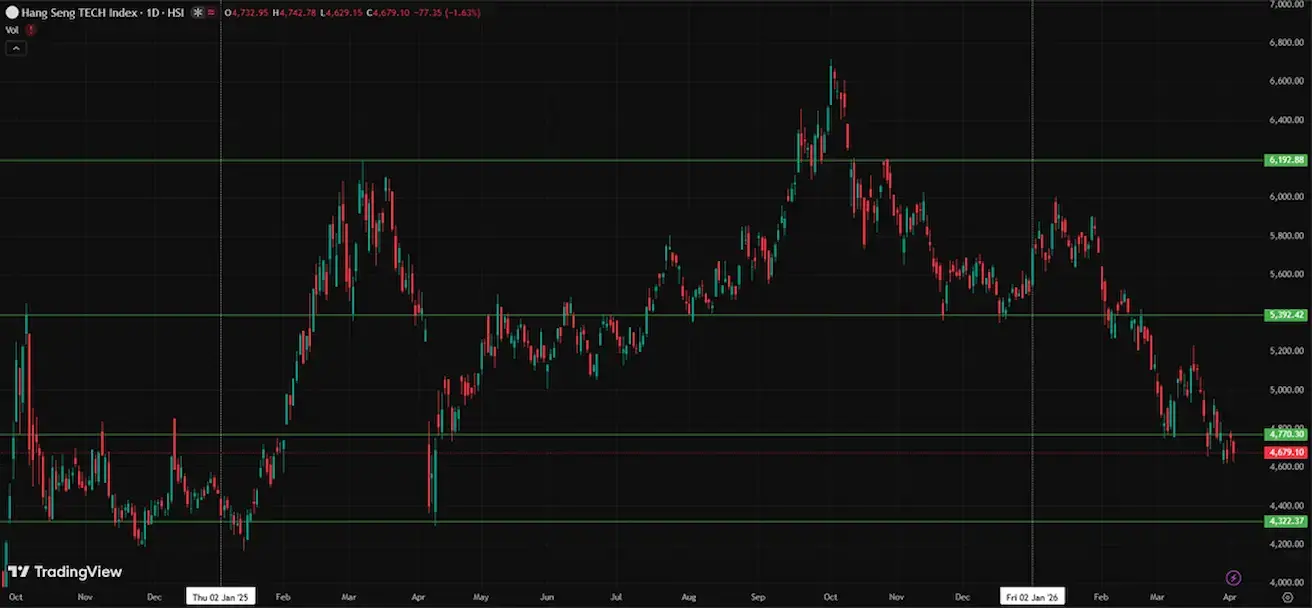
Hang Seng TECH Index (HSTECH)
Динамика за неделю: -2,07% (закрытие недели: 4679,1); с начала года: -15,0%.
ОЭСР (Организация экономического сотрудничества и развития) прогнозирует рост мировой экономики на уровне 2,9% в 2026 году (без изменений) и 3,0% в 2027 году (прежний прогноз — 3,1%).
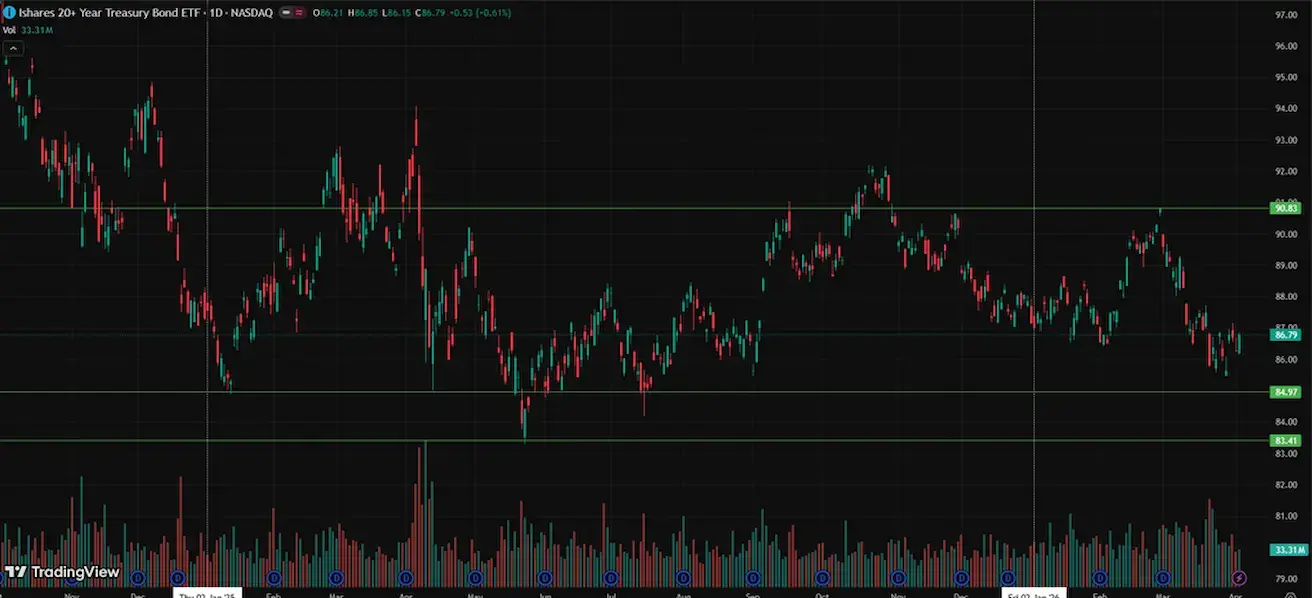
ДОЛГОВОЙ РЫНОК
Гособлигации США со сроком обращения 20+ лет (ETF TLT): динамика за неделю: +1,34% (закрытие недели: 86,79); с начала года: -0,42%. Цена отскочила от локального уровня поддержки.
ДОХОДНОСТИ И СПРЕДЫ
К концу недели доходности незначительно снизились.
- Рыночная доходность 10-летних казначейских облигаций США: 4,36% (пред.: 4,39%);
- Доходность 2-летних казначейских облигаций: 3,86% (пред.: 3,88%);
- Эффективная доходность индекса ICE BofA BBB US Corporate: 5,31% (пред.: 5,29%).
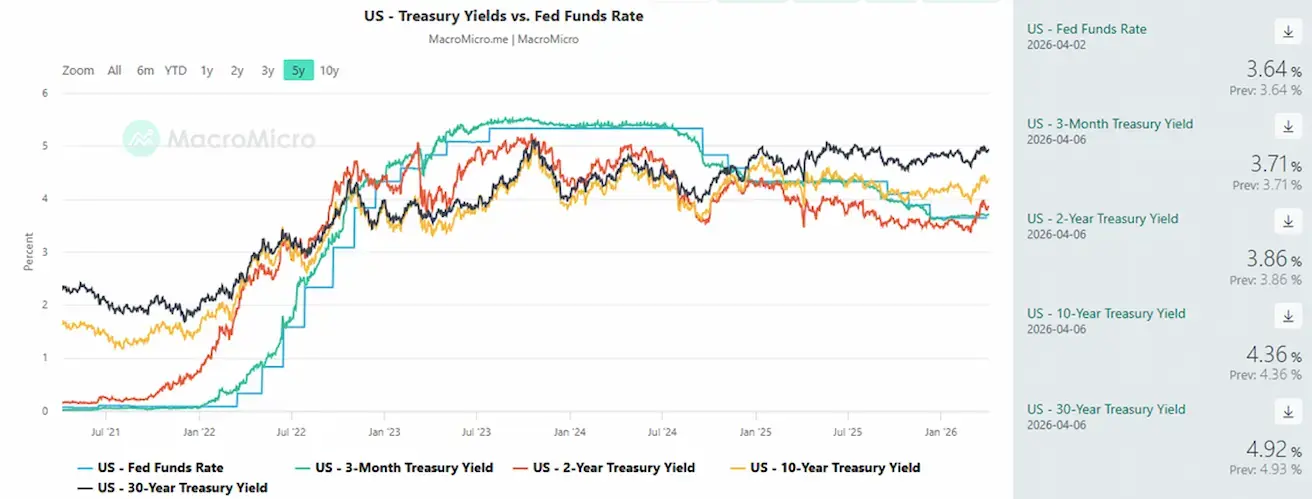
- Спред доходности между 10-летними и 2-летними казначейскими облигациями США составляет 50 базисных пунктов (пред.: 51);
- Спред доходности между 10-летними и 3-месячными казначейскими облигациями США составляет 65 базисных пунктов (пред.: 69).
Стоимость 5-летнего кредитного дефолтного свопа (CDS) США (страхование от дефолта): 37,31 б.п. (против 37,81 б.п. неделей ранее).
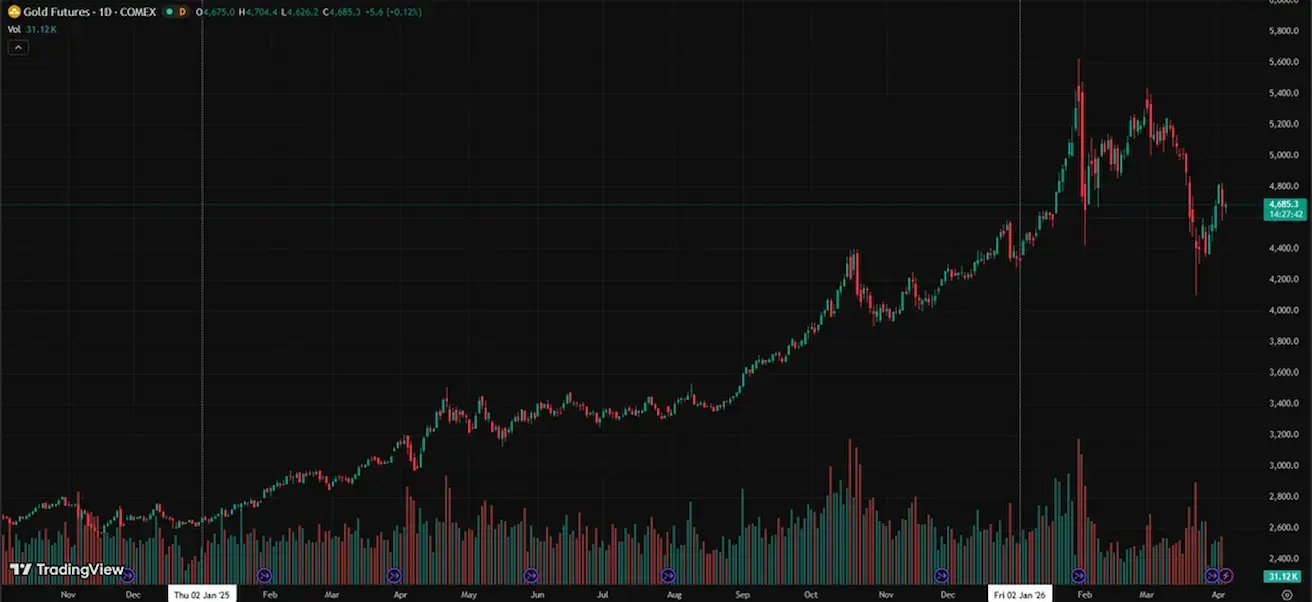
ФЬЮЧЕРСЫ НА ЗОЛОТО (GC)
Динамика за неделю: +4,17% (закрытие недели: $4679,7 за тройскую унцию); с начала года: +8,02%. Большинство центральных банков продолжат наращивать золотые резервы.
ФЬЮЧЕРСЫ НА НЕФТЬ
Динамика за неделю: +11,93% (закрытие недели: $111,54 за баррель). Динамика с начала года: +94,29%
- Страны-члены МЭА начали использовать резервы;
- OPEC+ увеличит добычу на 206 тыс. баррелей в сутки в мае;
- Геополитические риски на Ближнем Востоке могут приобрести более затяжной, структурный характер.
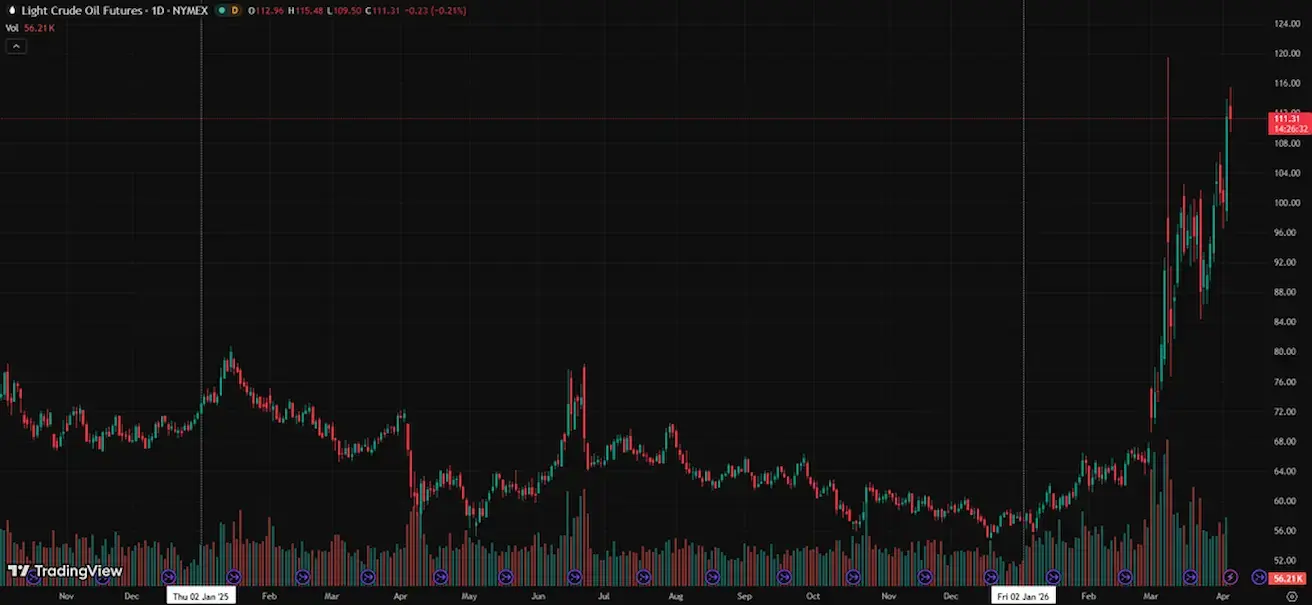
В воскресенье OPEC+ согласовала увеличение квот на добычу нефти на 206 тыс. баррелей в сутки в мае. Однако из-за закрытия Ормузского пролива и повреждения инфраструктуры в ключевых странах Персидского залива фактический прирост предложения будет минимальным.
Закрытие пролива сократило поставки на 12–15 млн баррелей в сутки (до 15% мирового предложения).
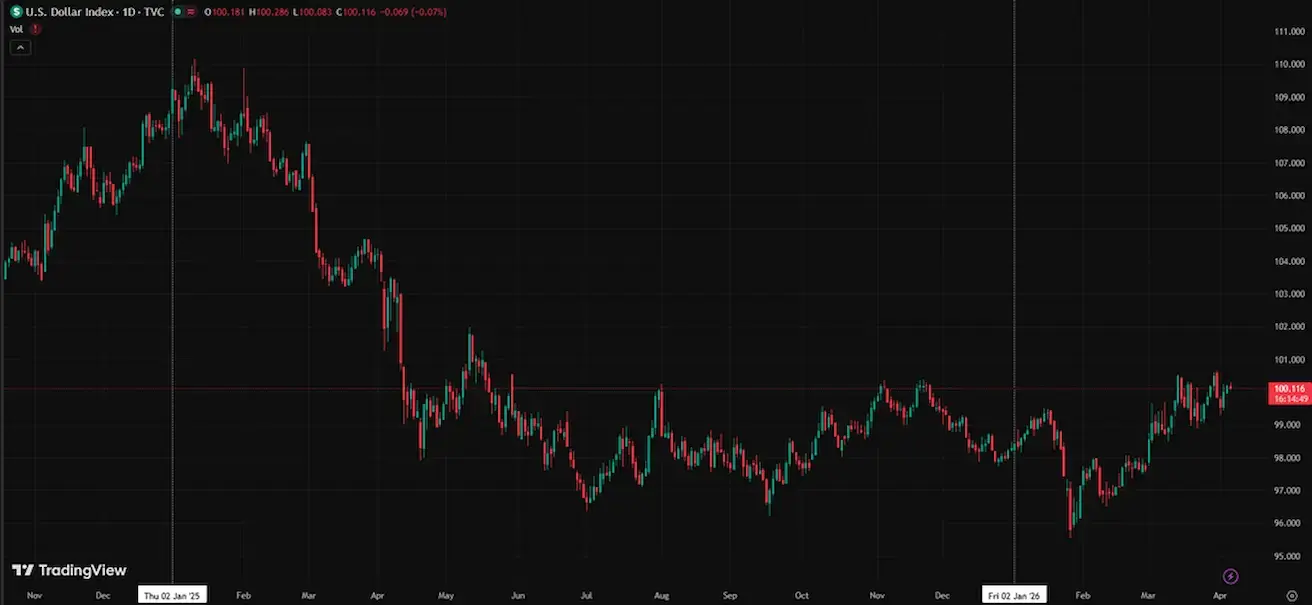
ФЬЮЧЕРСЫ НА ИНДЕКС ДОЛЛАРА (DX)
Динамика за неделю: -0,01% (закрытие недели: 100,185). Динамика с начала года: +2,23%.
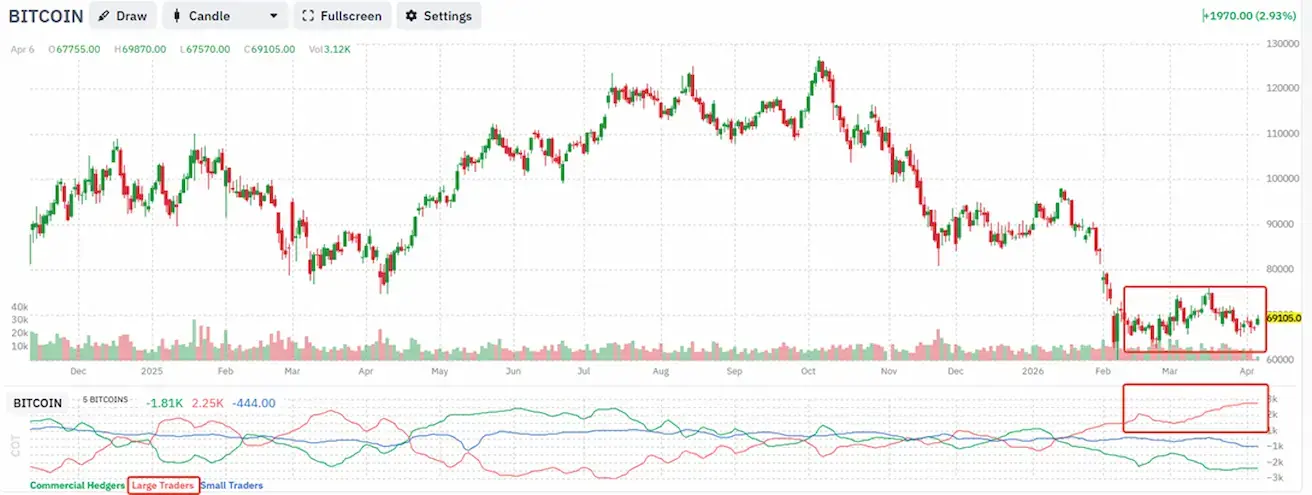
BTC ФЬЮЧЕРСЫ
Динамика за неделю: +4,62% (закрытие недели: $68 999); с начала года: -21,34%.
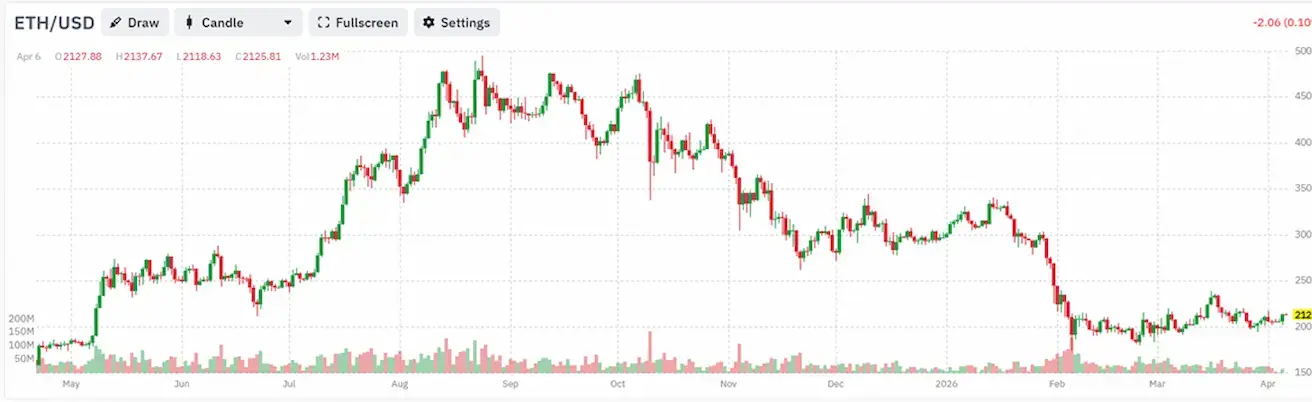
ETH ФЬЮЧЕРСЫ
Динамика за неделю: +6,24% (закрытие недели: $2106,3); с начала года: -29,17%.
Чистые длинные позиции крупных трейдеров в неконтрактной деятельности, согласно отчету COT, выросли до 2 106 контрактов. В настоящее время хедж-фонды и управляющие активами наиболее оптимистичны за последние два года и продолжают наращивать долгосрочные позиции.
В прошлый понедельник Министерство труда США предложило правило, обязывающее регуляторов расширить доступ к цифровым активам в пенсионных портфелях.
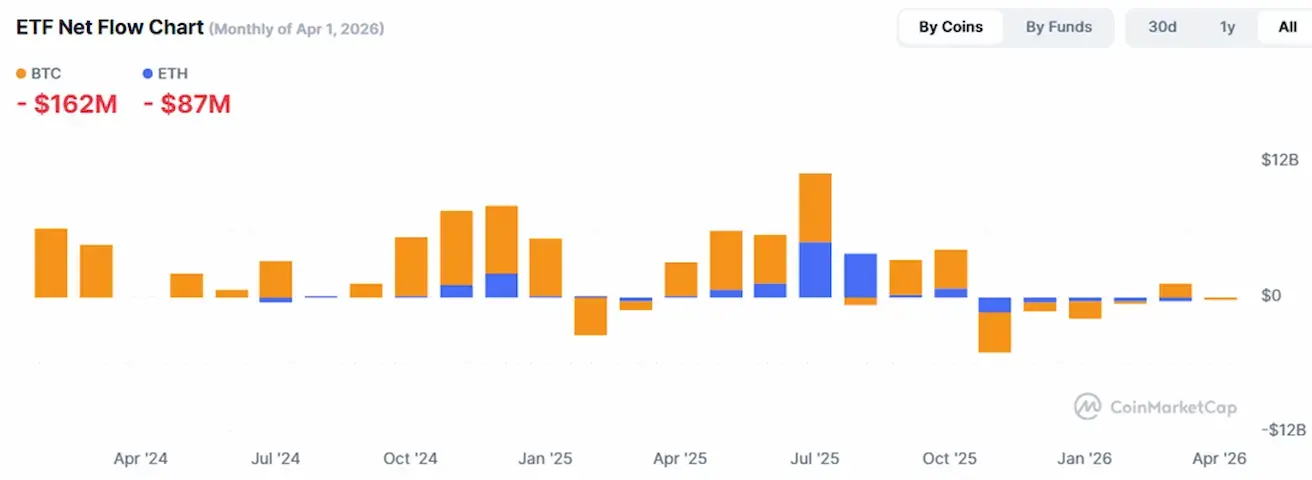
ОБЩАЯ КАПИТАЛИЗАЦИЯ РЫНКА КРИПТОВАЛЮТ
Общая капитализация рынка криптовалют: $2,38 трлн (против $2,33 трлн неделей ранее) (coinmarketcap.com).
Доли рынка криптоактивов:
- Bitcoin: 58,5% (58,0%)
- Ethereum: 10,9% (10,6%)
- Прочие: 30,6% (31,3%).
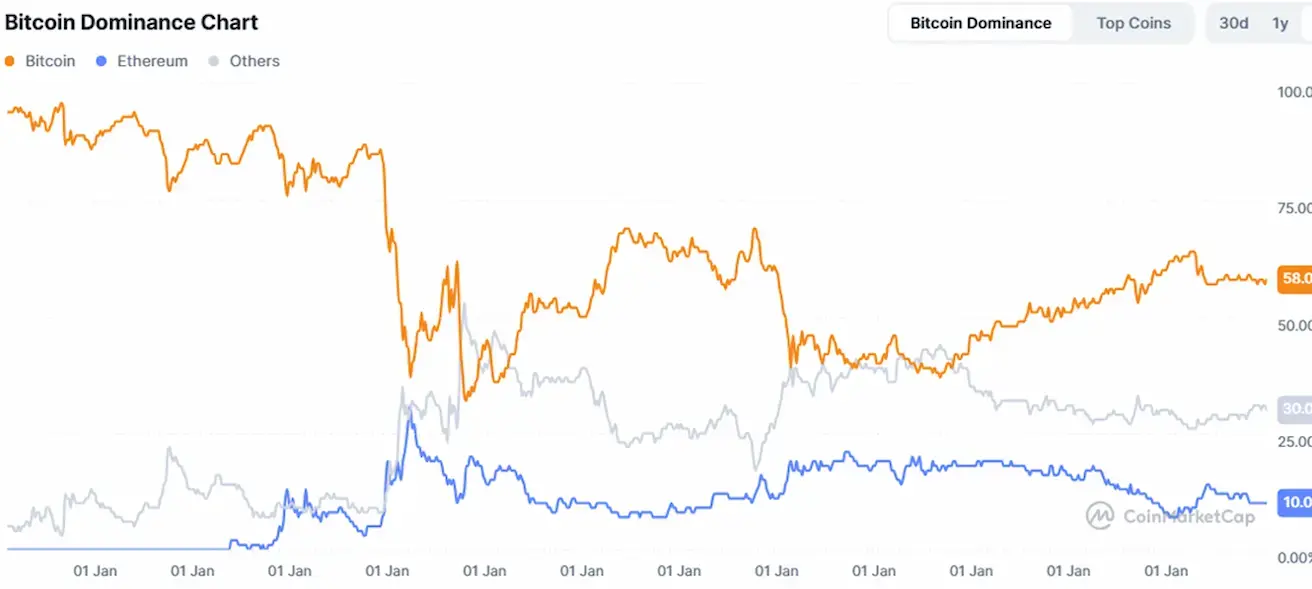
График чистых потоков ETF: